Sample Category Title
AUD/USD Weekly Outlook
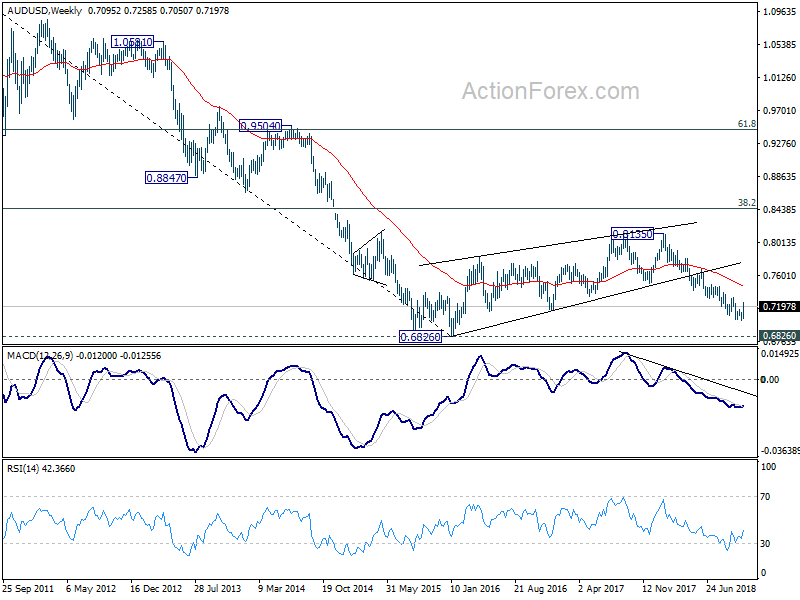
AUD/USD's rebound from 0.70202 accelerated higher last week. The development argues that a medium term bottom might be in place. Further rise is expected this week as long as 0.7159 minor support holds. Firm break of 0.7314 resistance will confirm this bullish case and target 38.2% retracement of 0.8135 to 0.7020 at 0.7446 next. However, sustained break of 0.7159 will turn focus back to 0.7020 low instead.
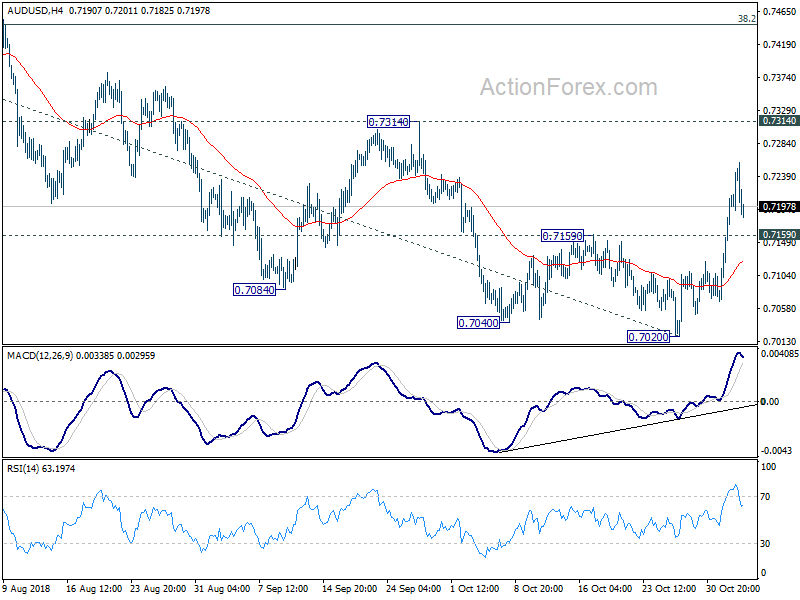
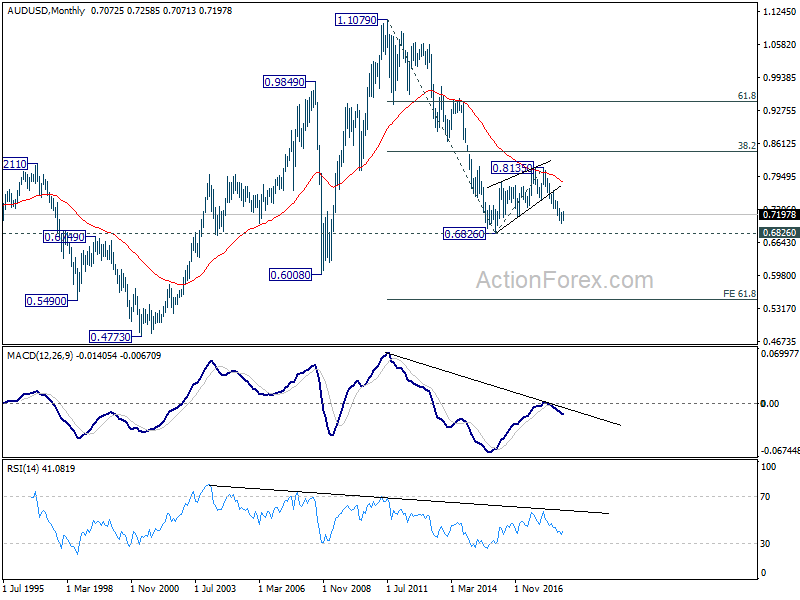
In the bigger picture, as long as 0.7314 resistance holds, fall from 0.8135 is tentatively treated as resuming long term down trend from 1.1079 (2011 high). Decisive break of 0.6826 will target 0.6008 key support next (2008 low). However, firm break of 0.7314 will suggest that whole decline from 0.8135 has completed. And, the corrective pattern from 0.6826 (2016 low) is extending with another rising leg towards 0.8135 before completion.
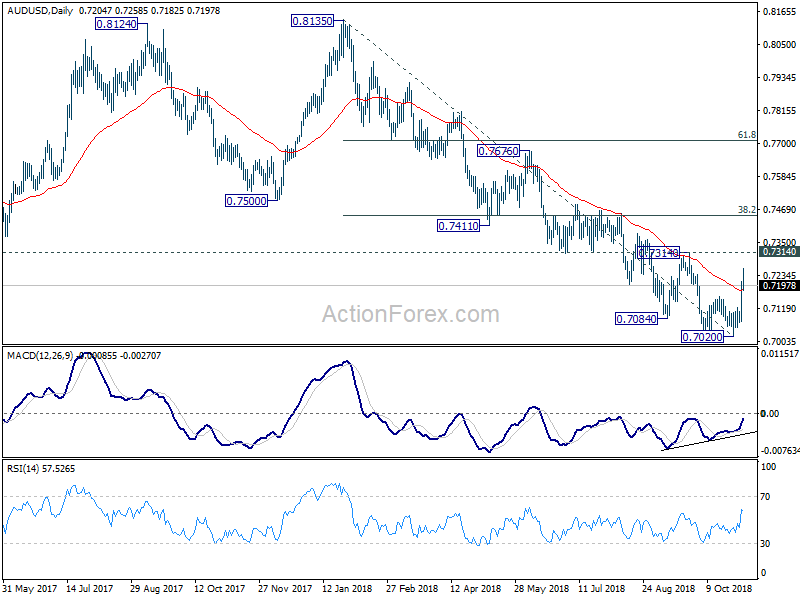
In the longer term picture, the corrective structure of rebound from 0.6826 (2016 low) to 0.8135, and the failure to break 38.2% retracement of 1.1079 (2011 high) to 0.6826 at 0.8451, carry bearish implications. AUD/USD was also rejected by 55 month EMA. Now, the down trend from 1.1079 is in favor to extend. On break of 0.6826, next target will be 61.8% projection of 1.1079 to 0.6826 from 0.8135 at 0.5507.
USD/CAD Weekly Outlook
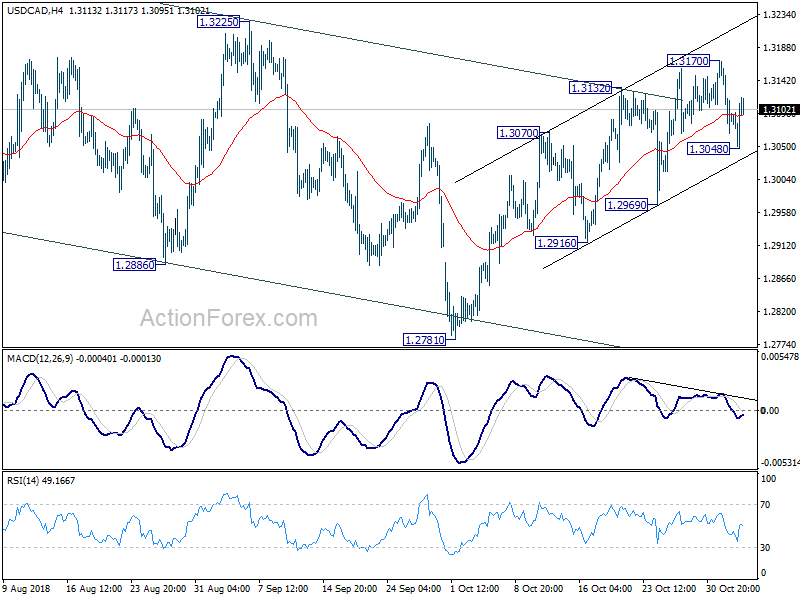
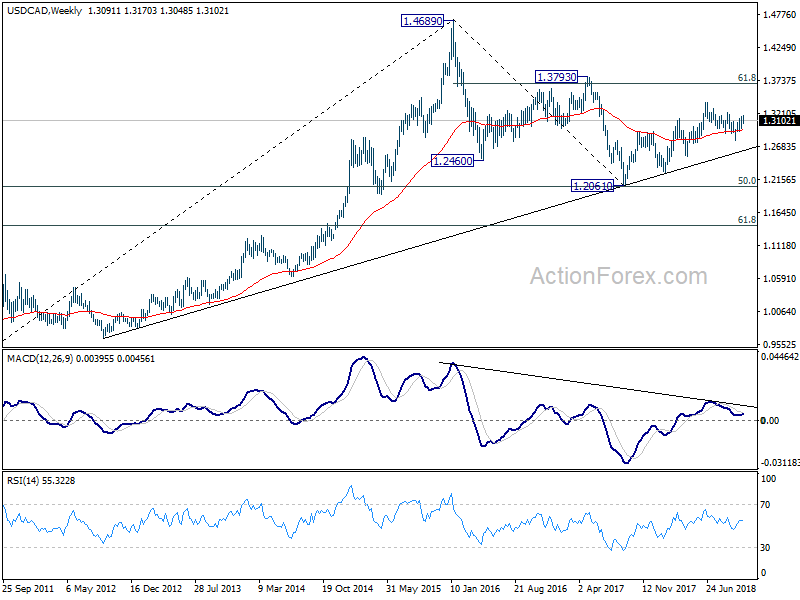
Despite retreating to 1.3048, USD/CAD quickly recovered, well ahead of 1.2969 support. Initial bias stays neutral this week first. On the upside, break of 1.3170 target 1.3225 key near term resistance. Break will confirm completion of choppy fall from 1.3385 and target a retest on this high. Though, break of 1.3048 will turn focus to 1.2969 support. Firm break there will indicate completion of whole rebound from 1.2781. In that case, whole fall from 1.3385 might extend through 1.2781 support before completion.
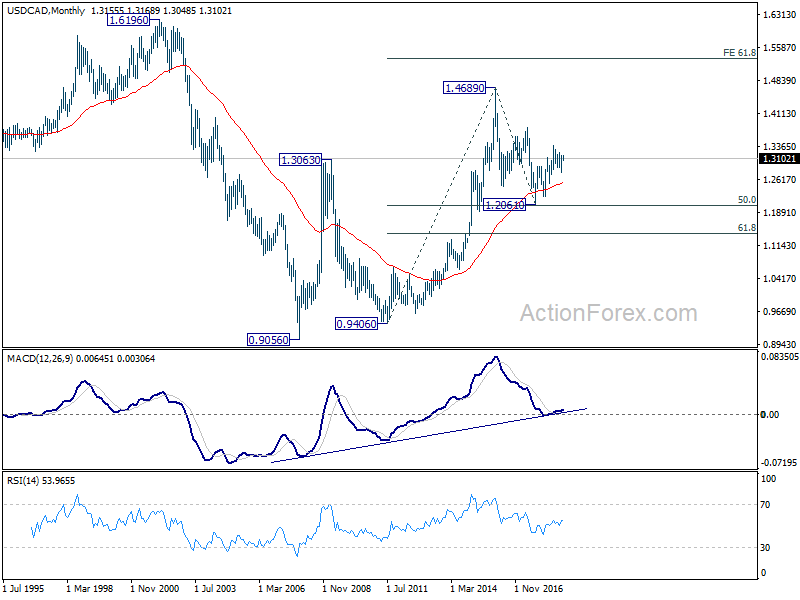
In the bigger picture, current development revives the case that corrective fall from 1.3385 has completed at 1.2781 already. And whole up trend from 1.2061 (2016 low) is ready to resume. Break of 1.3385 will target 61.8% retracement of 1.4689 (2016 high) to 1.2061 at 1.3685. This will now be the favored case as long as 1.2781 support holds.
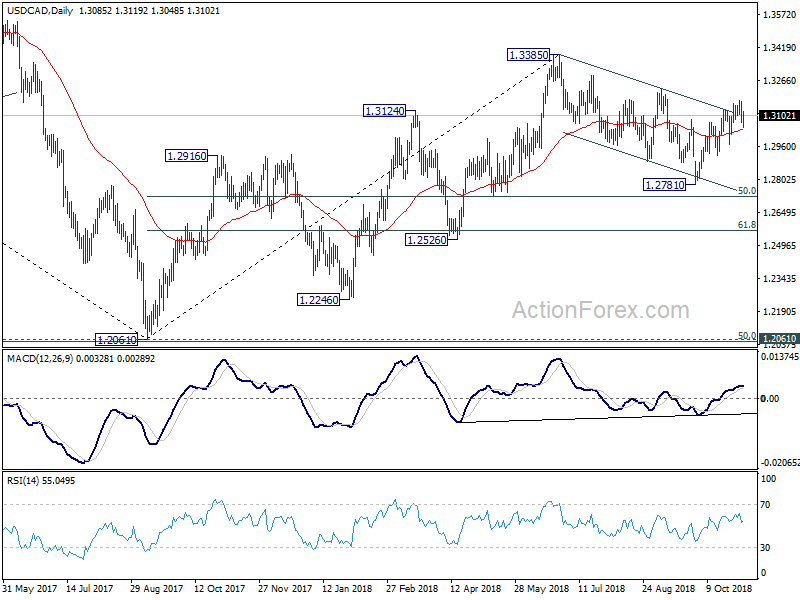
In the longer term picture, corrective fall from 1.4689 (2015 high) should have completed with three waves down to 1.2061, just ahead of 50% retracement of 0.9406 (2011 low) to 1.4689 (2015 high) at 1.2048. The development keeps long term up trend from 0.9406 and that from 0.9056 (2007 low) intact. For now, there is prospect of extending the long term up trend to 61.8% projection of 0.9406 to 1.4689 from 1.2061 at 1.5326 in medium to long term.
GBP/JPY Weekly Outlook
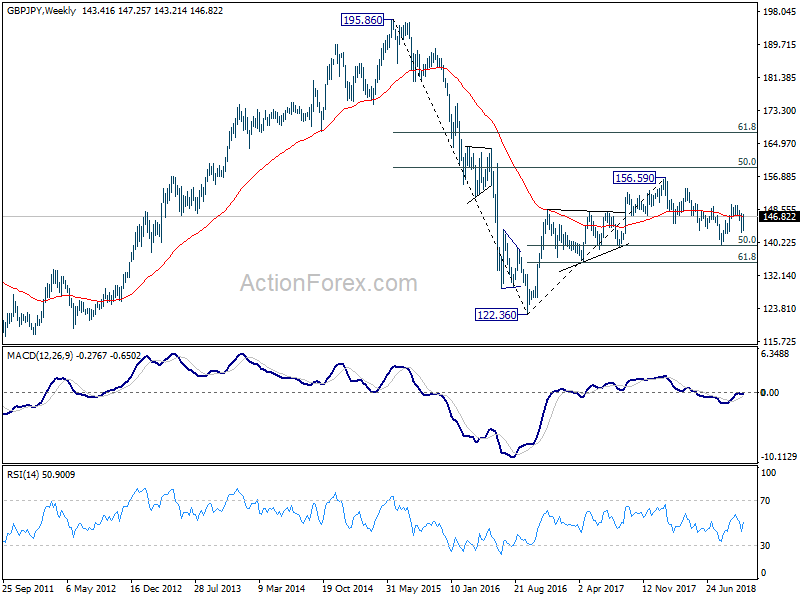
GBP/JPY's rebound from 142.76 accelerated higher last week and the development suggests that pull back from 149.70 has completed. Initial bias stays on the upside this week for 149.70 first. Break will resume the rise from 139.88 and target 153.84/156.59 resistance zone. On the downside, below 145.43 minor support will turn bias back to the downside for 142.76 again.
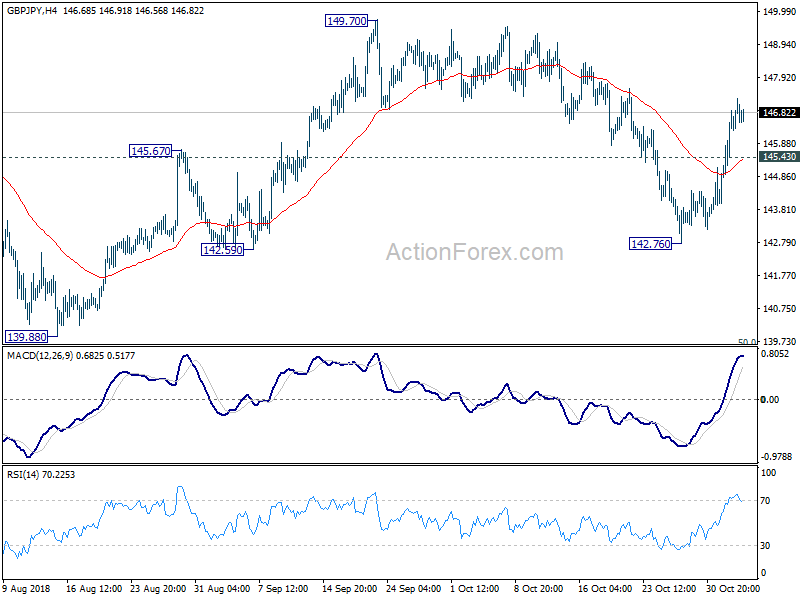
In the bigger picture, as long as 139.29 cluster support (50% retracement of 122.36 to 156.59 at 139.47) holds, up trend from 122.36 (2016 low) would still extend beyond 156.69 high. However, decisive break of 139.29/47 will suggest that such up trend is completed and turn outlook bearish. In that case, next target is 61.8% retracement at 135.43.
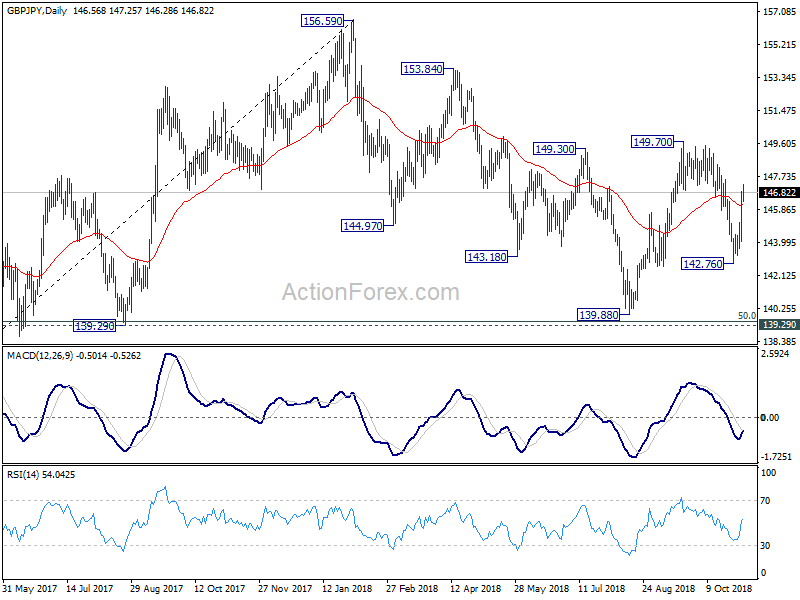
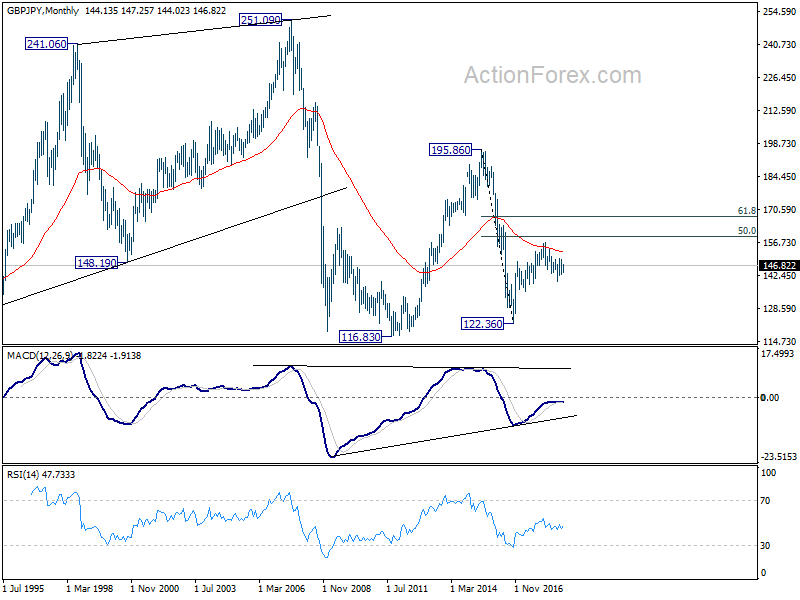
In the longer term picture, as long as 139.29 holds, rise from 122.36 is in favor to extend to 50% retracement of 195.86 (2015 high) to 122.36 (2016 low) at 159.11, and possibly further to 61.8% retracement at 167.78 before completion. However, firm break of 139.29 will turn focus back to 116.83/122.36 support zone instead (116.83 as 2011 low).
EUR/JPY Weekly Outlook
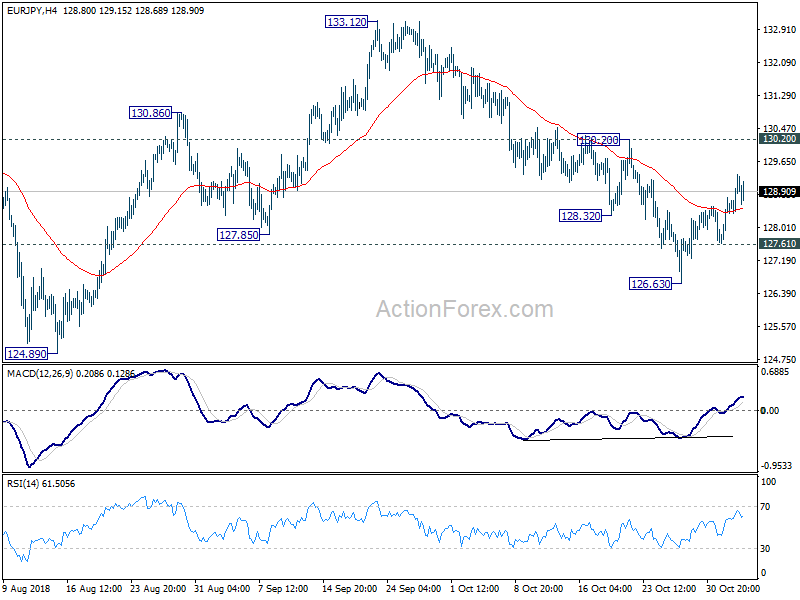
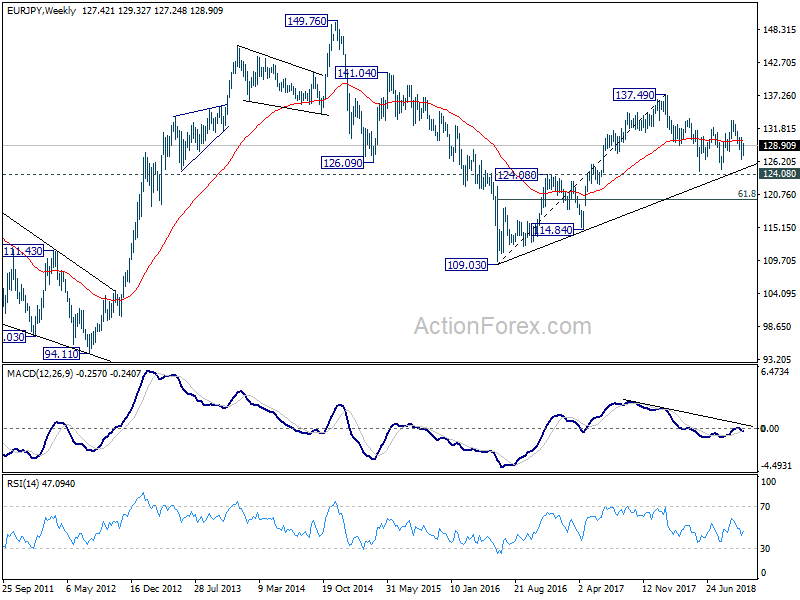
EUR/JPY's rebound from 126.63 short term bottom extended higher last week Initial bias stays on the upside for 130.20 resistance. Based on unconvincing upside momentum so far, we'd expect strong resistance from 130.20 to limit upside to bring another decline. On the downside, break of 127.61 minor support will turn bias to the downside. Break of 126.63 will extend the fall from 133.12 to retest 124.89 low. Nonetheless, sustained break of 130.20 will pave the way to 133.12 high.
In the bigger picture, as long as 124.08 key resistance turn supported holds, larger up trend from 109.03 (2016 low) is still in progress. Firm break of 137.49 structural resistance will target 141.04/149.76 resistance zone next. However, decisive break of 124.08 will argue that such rise from 109.03 has completed and turn outlook bearish. In that case, deeper fall would be seen to 61.8% retracement of 109.03 to 137.49 at 119.90.
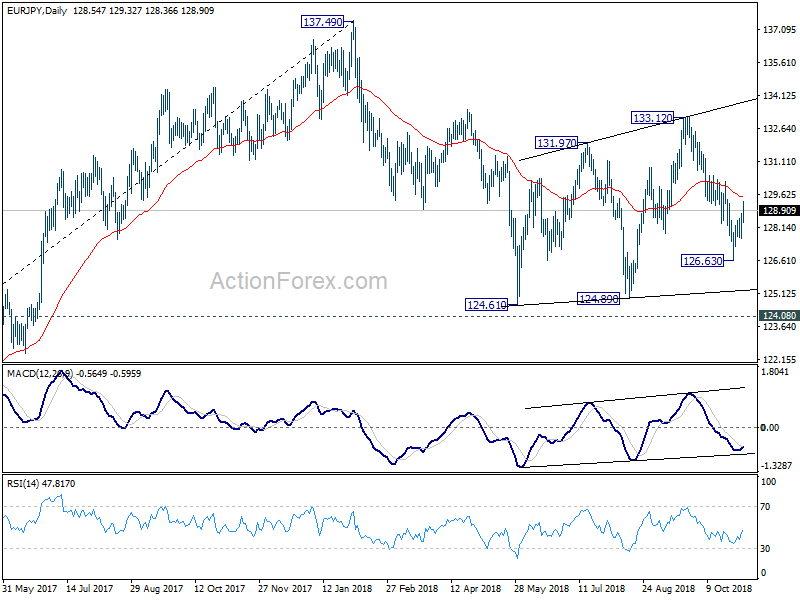
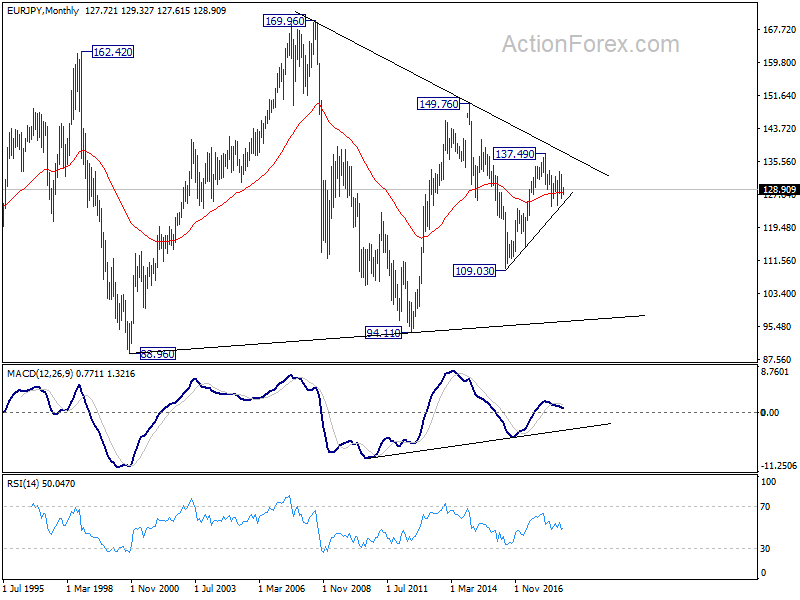
In the long term picture, at this point, EUR/JPY is staying in long term sideway pattern, established since 2000. Rise from 109.03 is seen as a leg inside the pattern. As long as 124.08 support holds, further rally is in favor in medium to long term through 149.76 high. However, break of 124.08 could extend the fall through 109.03 low instead.
EUR/GBP Weekly Outlook
EUR/GBP edged higher to 0.8939 last week but reversed and fell sharply since then. Initial bias stays on the downside this week for 0.8722 support first. Break will resume the whole fall from 0.9097 and target 0.8620 support next. On the upside, above 0.8864 minor resistance will turn intraday bias neutral first. But another fall is in favor as long as 0.8804 minor resistance holds.
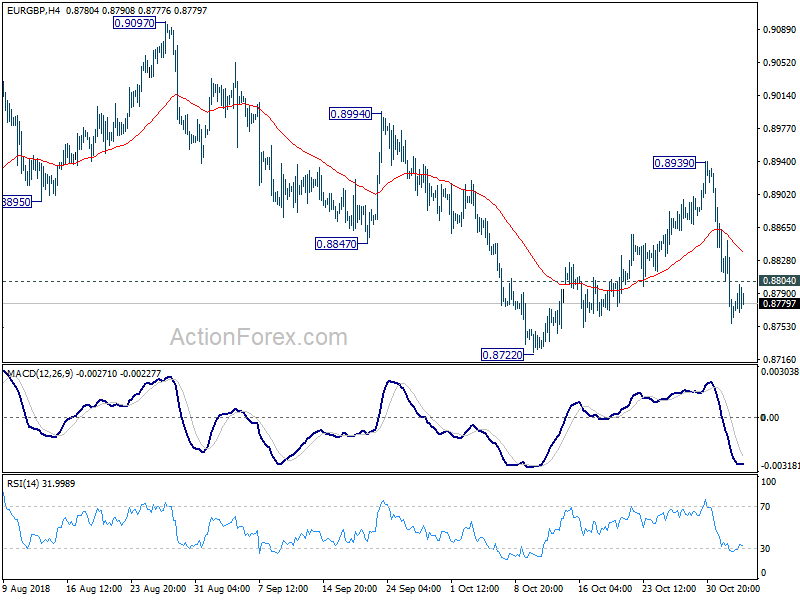
In the bigger picture, EUR/GBP is seen as staying in long term range pattern started at 0.9304 (2016 high). On the downside, break of 0.8722 will extend the falling leg through 0.8620 support. On the upside, break of 0.9097 will target 0.9304 resistance instead.
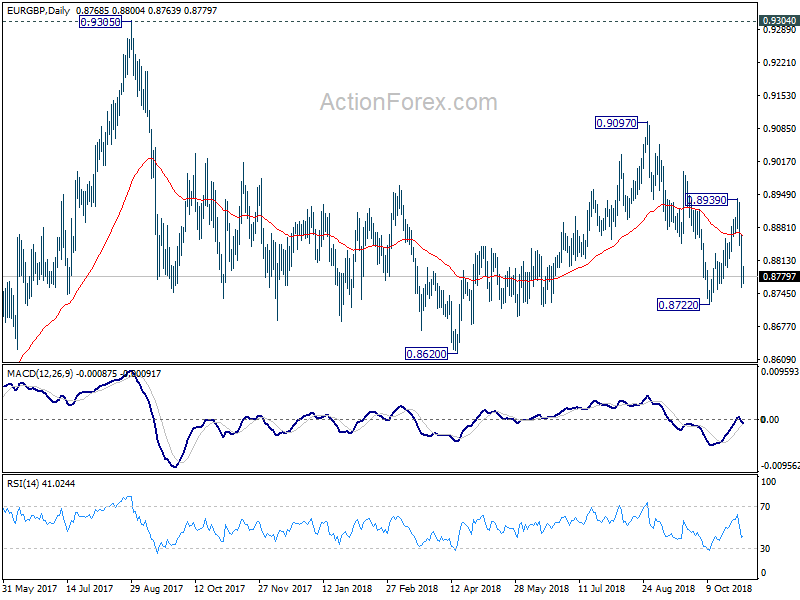
In the long term picture, we're holding on to the view that rise from 0.6935 (2015 low) is resuming the up trend from 0.5680 (2000 low). Hence, after the consolidation from 0.9304 completes, we'd expect another medium term up trend through 0.9799 to 100% projection of 0.5680 to 0.9799 from 0.6935 at 1.1054.
EUR/AUD Weekly Outlook
EUR/AUD's sharp decline and firm break of 1.5984 support last week is taken as an early sign of medium term trend reversal. But with a temporary low in place at 1.5742, initial bias is neutral this week first. Some consolidation could be seen but upside should be limited by 1.5984 support turned resistance to bring another decline. Below 1.5742 will turn bias back to the downside for 1.5601 support. Break there will pave the way to 1.5271/5313 cluster support zone next.
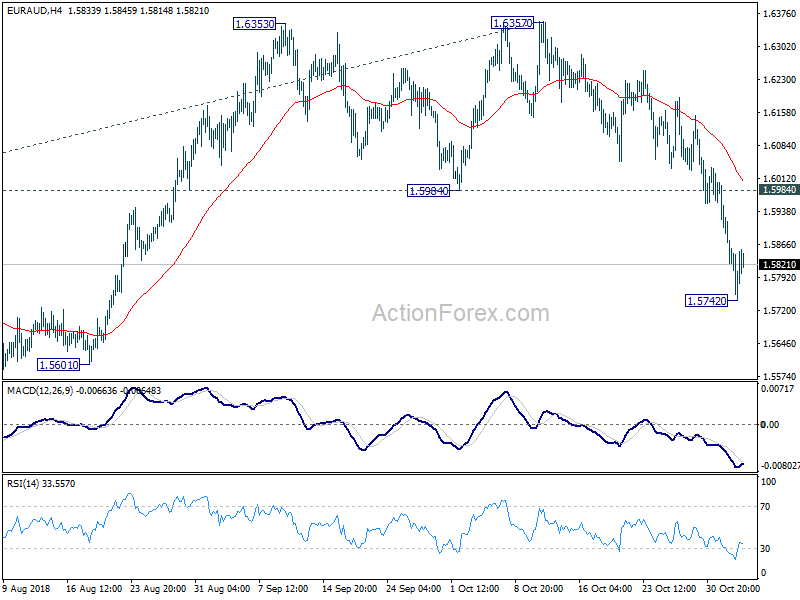
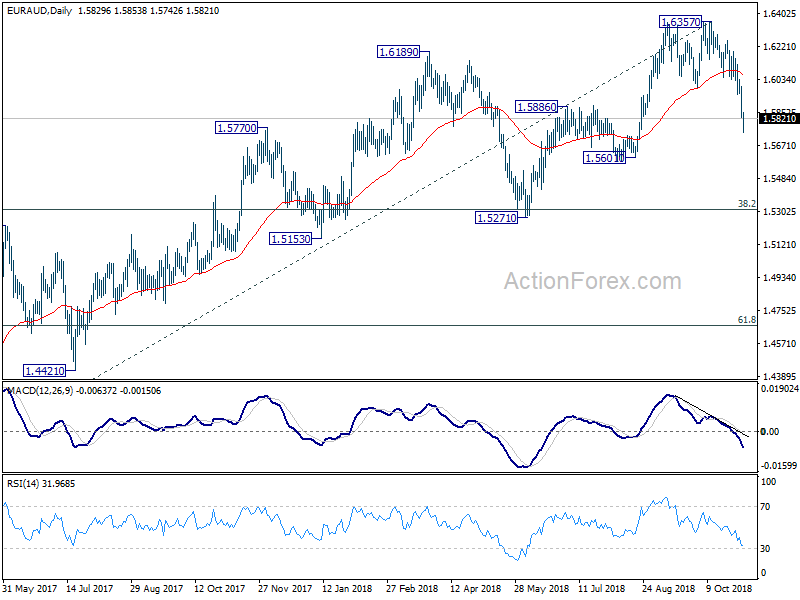
In the bigger picture, current development argues that up trend from 1.3624 (2017 low) is possibly completed at 1.6357, ahead of 1.6587 (2015 high). This is supported by bearish divergence condition in weekly MACD. Deeper decline is now in favor to 1.5271 cluster support (38.2% retracement of 1.3624 to 1.6357 at 1.5313). Break will target 61.8% retracement at 1.4668. On the upside, break of 1.6357 is needed to confirm up trend resumption. Otherwise, risk will now stay on the downside even in case of strong rebound.
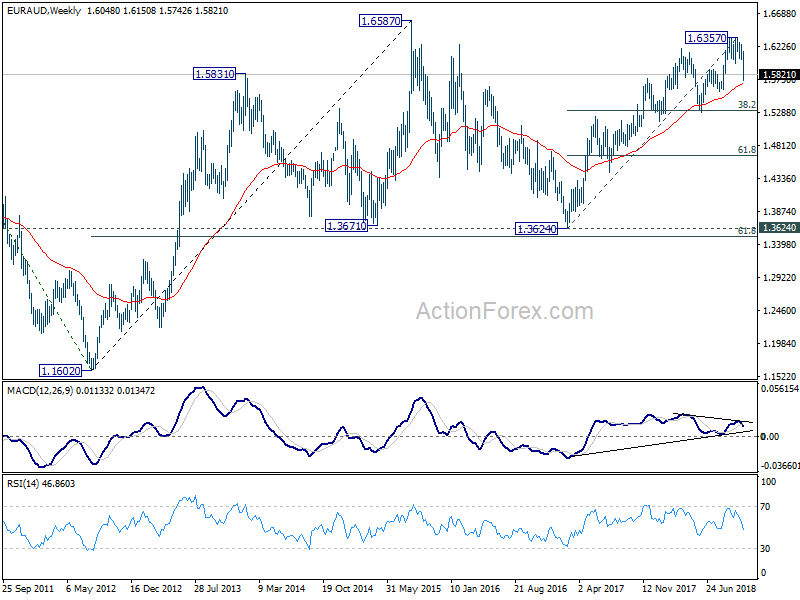
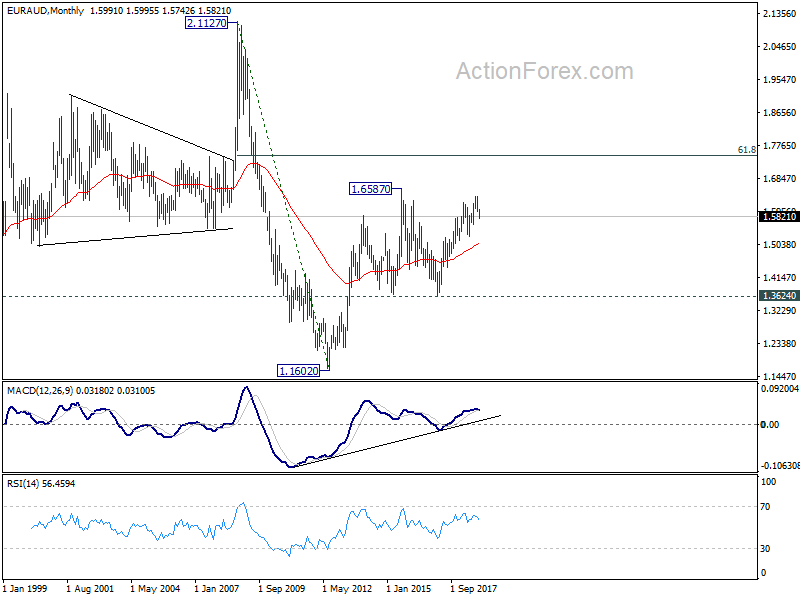
In the longer term picture, the rise from 1.1602 long term bottom (2012 low) isn't over yet. We'll keep monitoring the development but there is prospect of extending the rise to 61.8% retracement of 2.1127 to 1.1602 at 1.7488 and above. However, sustained trading below 1.3624 key support should indicate long term reversal and target 1.1602 long term bottom again.
EUR/CHF Weekly Outlook
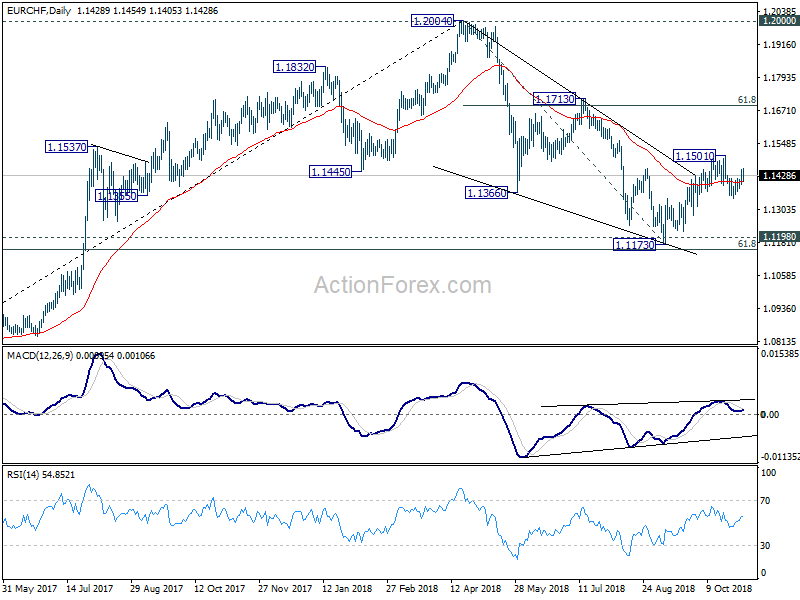
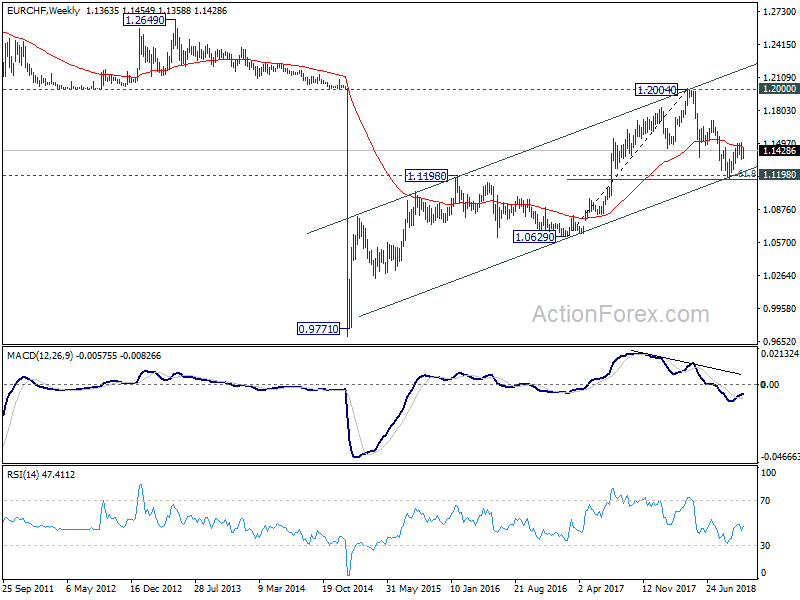
EUR/CHF's recovery from 1.1343 extended higher last week and mixed up the near term outlook. Initial bias is neutral this week first. On the upside, break of 1.1501 will revive the case of bullish reversal. Intraday bias will be turned back to the upside for 1.1713 resistance next. On the downside, break of 1.1343 will turn bias back to the downside for 1.1154/98 key support zone.
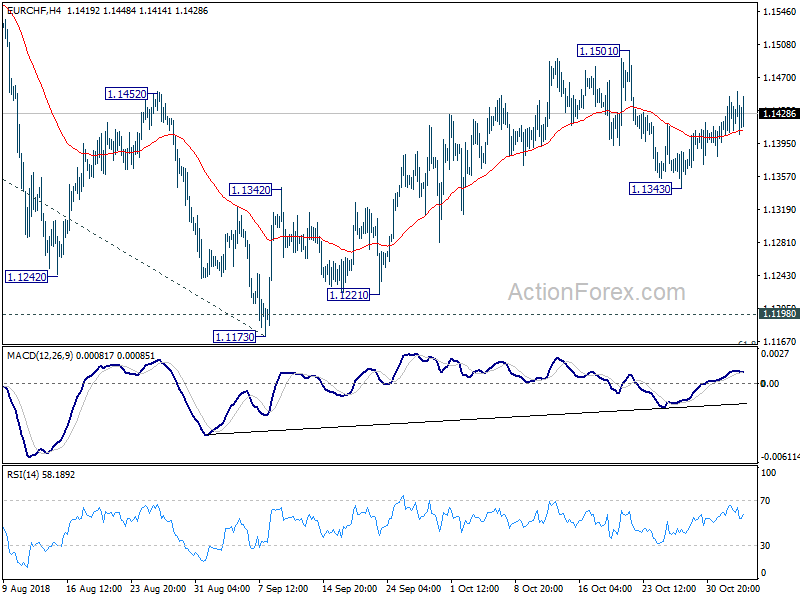
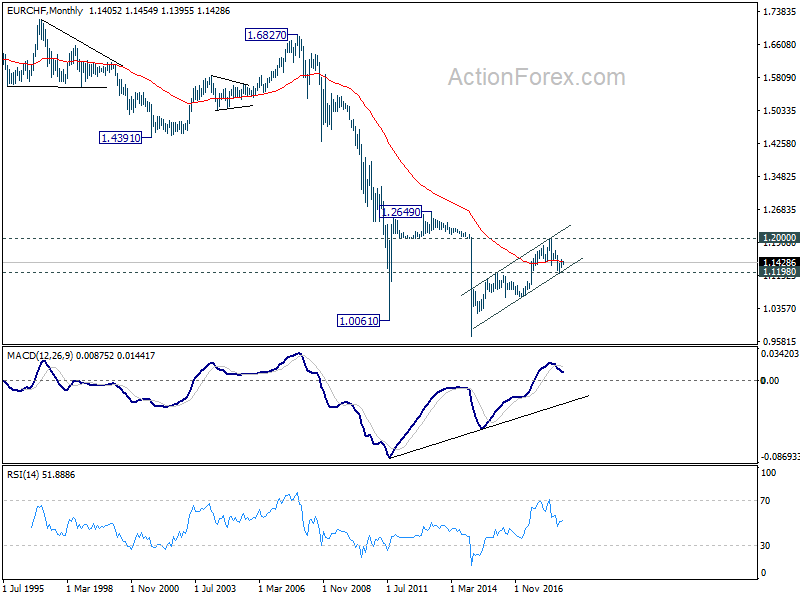
In the bigger picture, price actions from 1.2004 medium term top is seen as a correction only. Downside should be contained by support zone of 1.1198 (2016 high) and 61.8% retracement of 1.0629 to 1.2004 at 1.1154 to complete it and bring rebound. This cluster level is in proximity to long term channel support (now at 1.1243) too. A break of 1.2 key resistance is still expected in the medium term long term. However, sustained break of the mentioned support zone will mark reversal of the long term trend. In that case, 1.0629 key support will be back into focus.
Trade War Overshadows Fundmentals in the US, Election to Join the Party
What is a bigger driver of volatility in the markets, politics or monetary policy? Judging only from last week's development, politics got the nod, at least in the US. Investor sentiments initially sank on report that Trump was ready impose more tariffs on China, as soon as in December. But then, markets took a U-turn after presidents of both sides held a "long and very good" telephone conversation on Thursday. Suddenly, there is hope for de-escalating US-China trade war with the Trump-Xi meeting as sideline of G20 summit in Argentina on Nov 30 - Dec 1.
Global equities rebounded on the news, with exceptional strength seen in Hong Kong. Chinese Yuan was also lifted sharply up from the psychologically important 7 handle. US treasury yields also staged a strong rally, with additional help from solid non-farm payrolls report. It should also be remembered that Sterling enjoyed a marvellous rebound on hope that there could be a Brexit deal for that extra EU submit in November. But of course, one could argue that the Pound was also supported by a slight hawkish turn in BoE's new projections in the quarterly Inflation Report.
Over the week, New Zealand and Australian Dollar ended as the strongest ones, followed by Sterling. Yen and Swiss France were the weakest ones on return of risk appetite. Dollar staged a broad based rebound on Friday on NFP and treasury yields and ended just mixed.
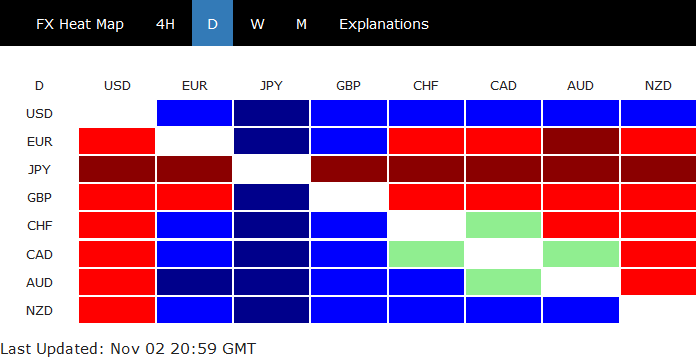
Looking ahead, three central banks will meet this week, RBA, RBNZ and Fed. All are expected to stand pat and are unlikely to move the markets. Economic data like UK GDP, ISM services, New Zealand employment, etc could trigger some movements. But in the end, it's likely US-China trade war, US mid-term election, Brexit negotiations, Italy-EU budget showdown that would determine the main directions.
30-year yield resumes up trend, 10-year yield to follow
While there were a lot of notable developments in the financial markets, we'd like to point to US treasury yield first. 30-year yield (TYX) surged through 3.424 near term resistance to resume medium term up trend. Near term outlook will now stay bullish as long as 3.300 support holds. Next near term target will be 100% projection of 2.651 to 3.247 from 2.963 at 3.559.
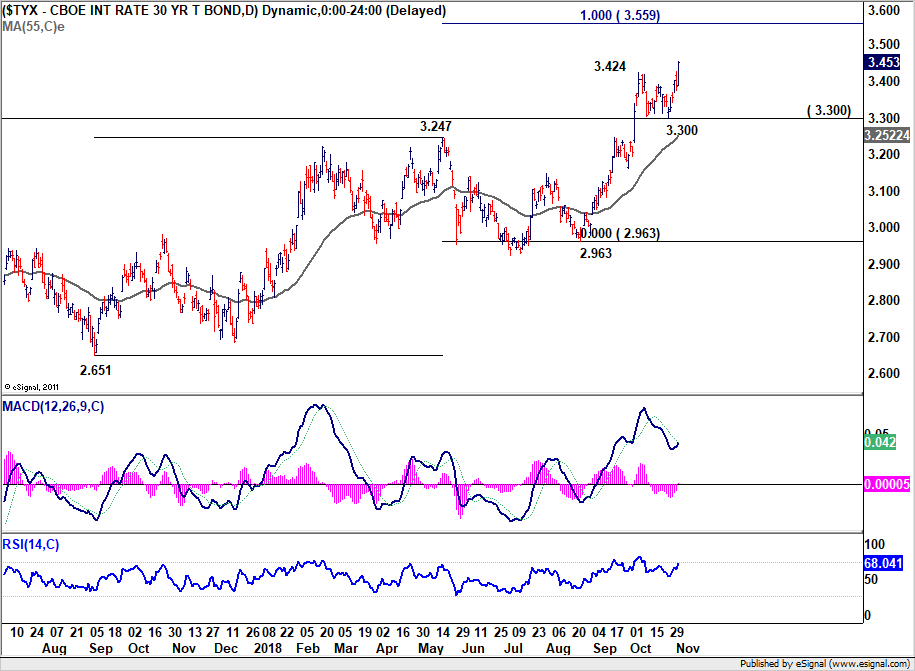
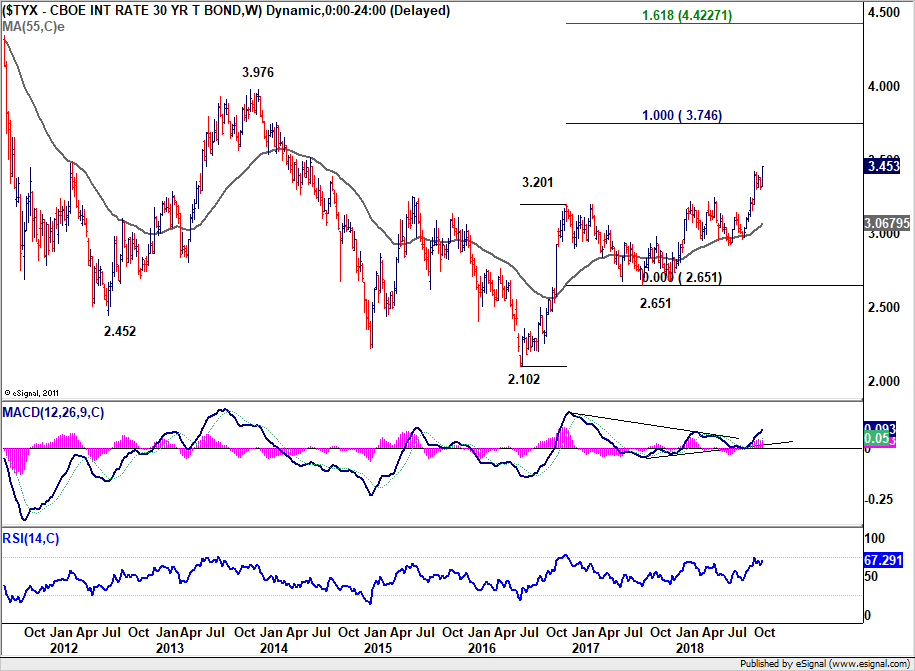
But we're actually looking at 100% projection of 2.102 to 3.201 from 2.651 at 3.746 in medium term, which will then put 3.976 key resistance into radar.
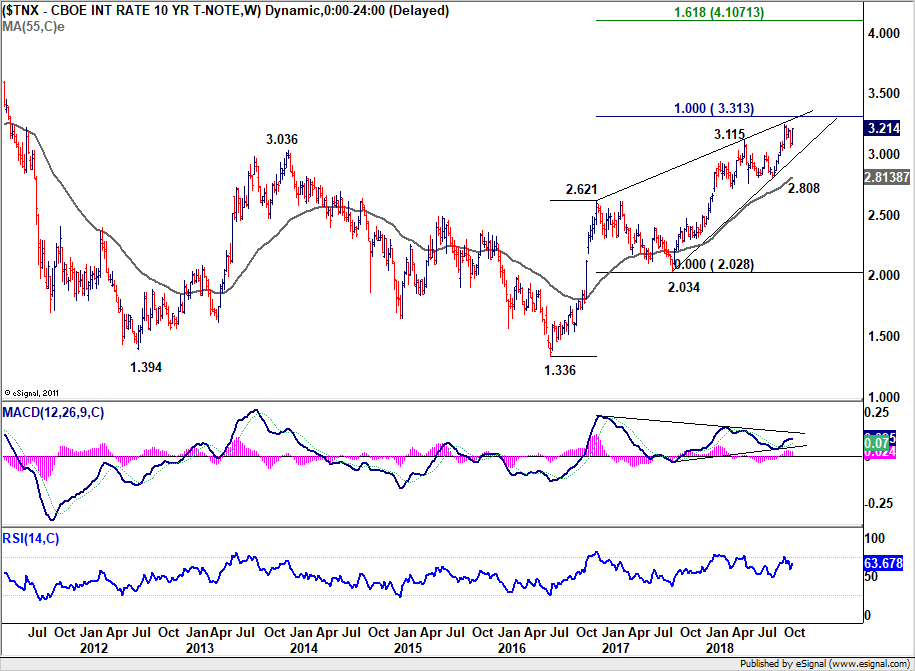
10-year yield (TNX) is not too far behind and the rebound from 55 day EMA is also a bullish sign. Rally in TYX will likely help lift TNX through 3.248 resistance soon.
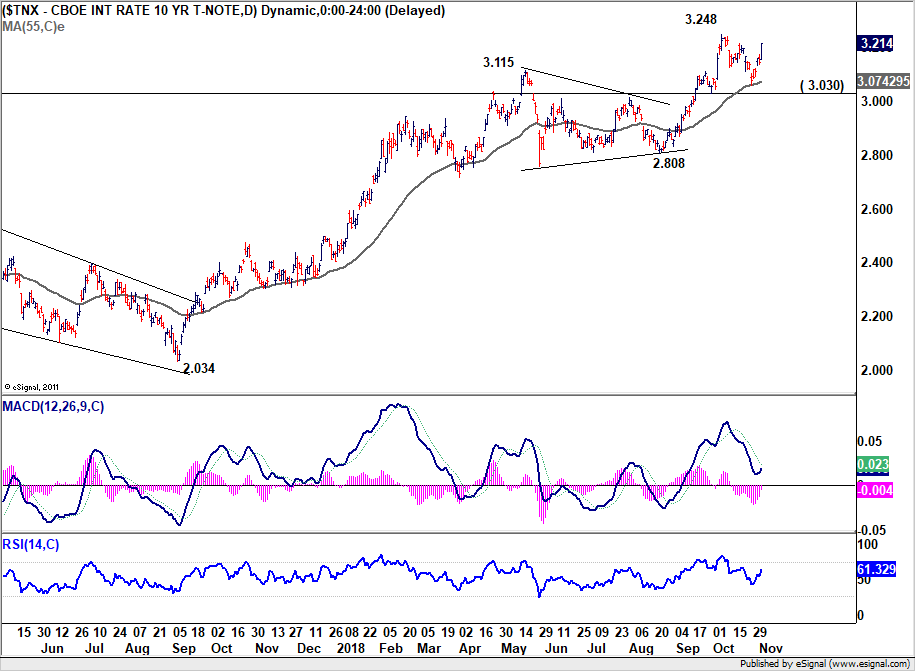
And in that case, 100% projection of 1.336 to 2.621 from 2.034 at 3.313 shouldn't be too difficult to overcome. Next medium term target will be above 4% handle at 161.8% projection at 4.107.
S&P 500 rebounded, but correction not finished
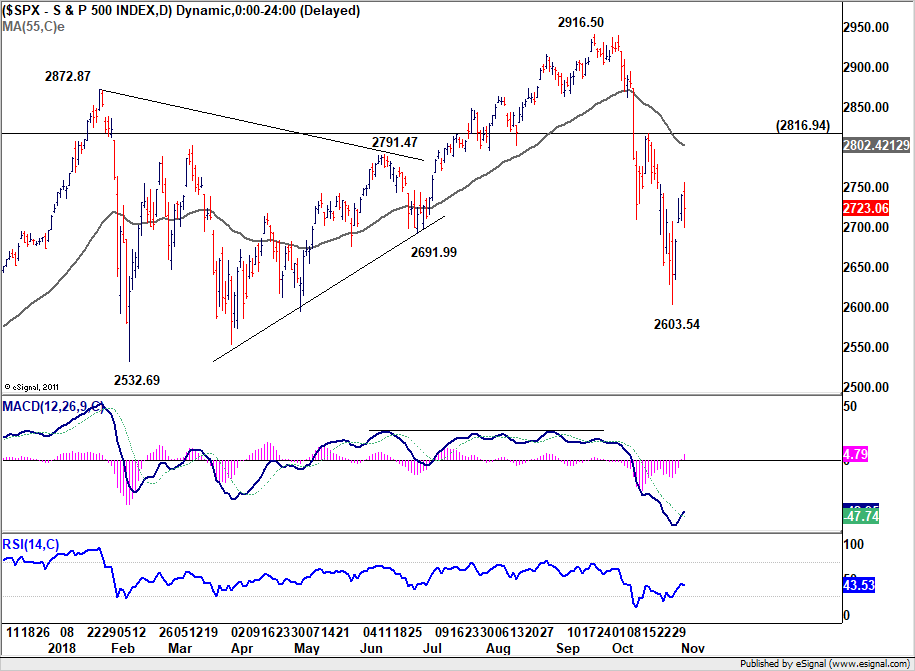
S&P 500's strong rebound from 2603.54 suggests near term stabilization. However, while further rally could be seen, upside attempts could be capped by surging treasury yields as well as political uncertainties after mid-term election. As long as 2816.94 resistance holds, the fall from 2916.50 is still in favor to extend lower.
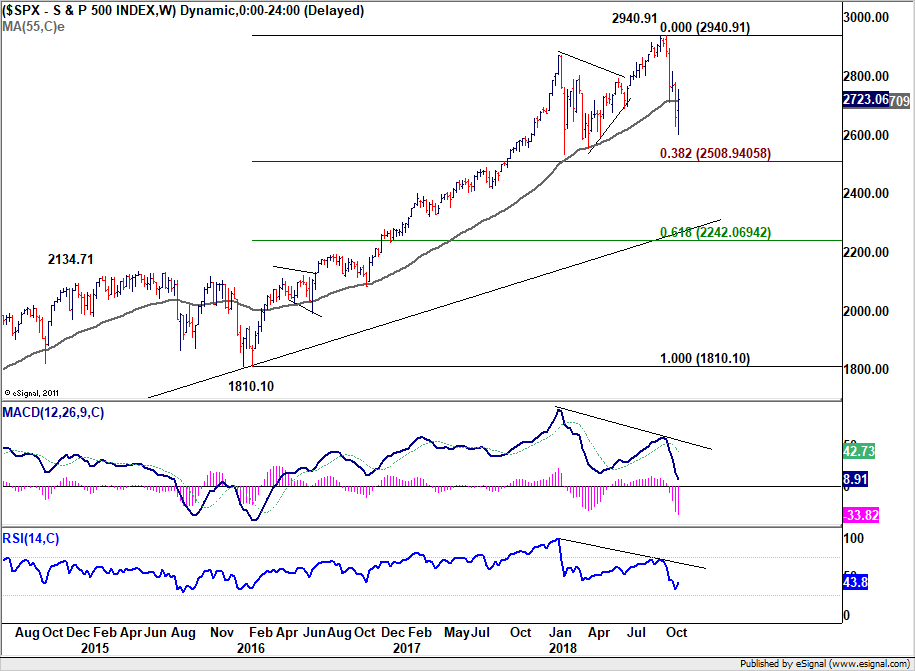
Such decline is view as correcting the whole up trend from 1810.10. And 38.2% retracement of 1810.10 to 2940.91 should at least be tested before this falling leg completes. Though, break of 2816.94 will argue that the pull back has completed earlier than we expected and retest of 2940.91 high would then be seen.
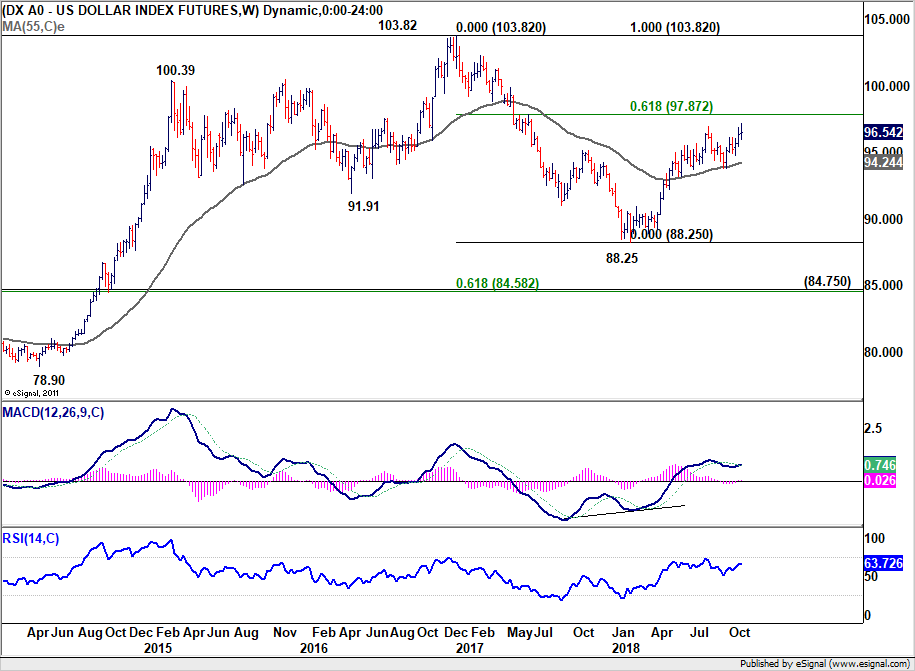
Dollar index rejected but 96.98, but not giving up yet
Dollar index breached 96.98 key resistance to 97.02 but retreated sharply. It originally looked like the index was rejected by 96.98 already. But Friday's late rebound raised the chance that the fall from 97.02 is merely a pull back and the rise from 93.81 is still intact. Now, further rise will be mildly in favor as long as Friday's low at 95.98 holds. Break of 97.02 will confirm rise resumption for 97.87 fibonacci level next. But break will 95.98 will at least bring deeper pull back to 55 day EMA at 95.51.
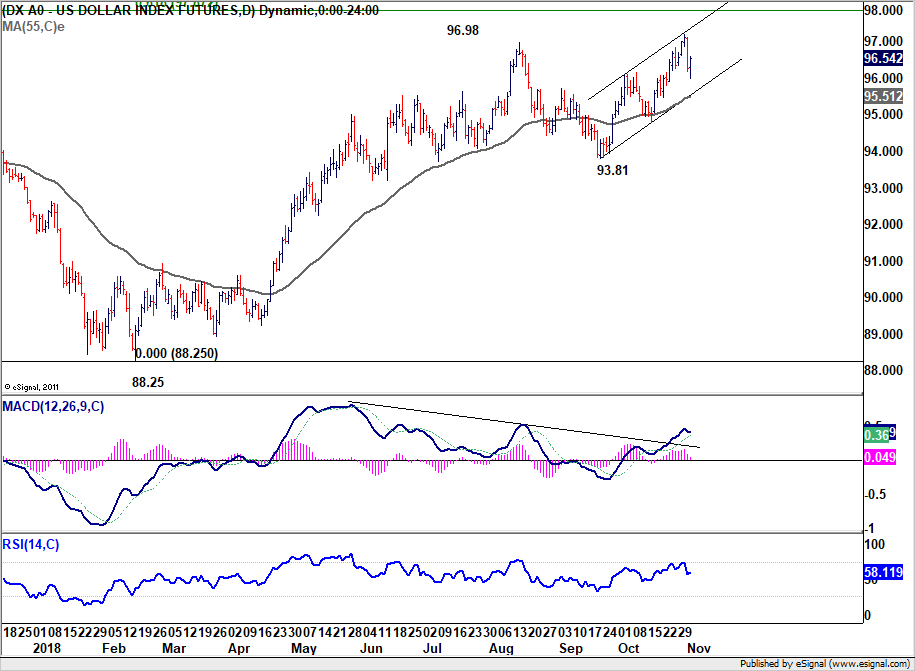
Also, if the rise from 88.25 is confirmed to have resumed, firm break of 61.8% retracement of 103.82 to 88.25 at 97.87 will pave the way to retest 103.82 high.
Chinese markets responded well to trade breakthrough
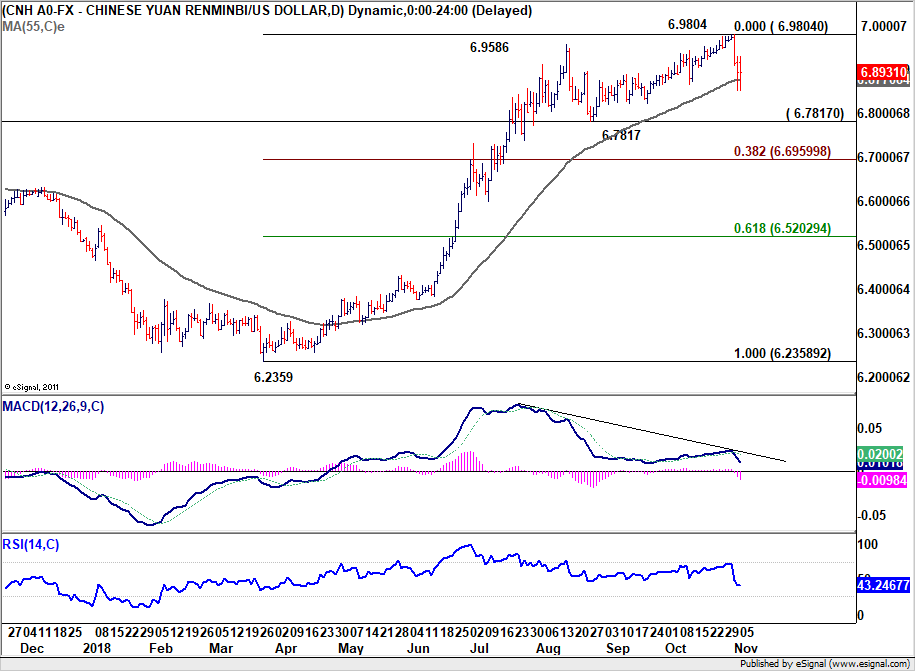
The Chinese markets responded rather positively to the trade war news. USD/CNH's sharp fall on Thursday and Friday suggests that a medium term top is formed at 6.9804, on bearish divergence condition in daily MACD, and 55 day EMA breached. That is, the offshore Yuan has defended the psychologically important 7 handle for now. Deeper decline is now in favor for 6.7817 and possibly back to 6.6960 (38.2% retracement of 6.2359 to 6.9804.
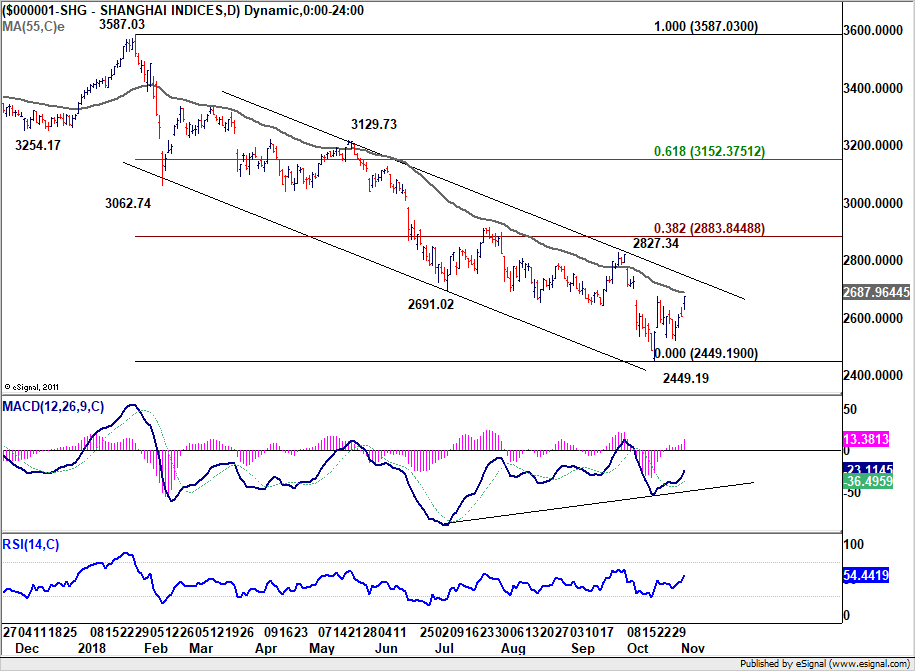
The Shanghai SSE closed the week at 2676.47, above 2675.40 near term resistance. The development reaffirmed the case of medium term bottoming at 2449.19, on bullish convergence condition in daily MACD. And, rebound from 2449.19 is likely resuming to correct the down trend from 3587.03. 55 day EMA (now at 2687.96) is the first hurdle. Break will solidify this bullish case and bring stronger rise back to 38.2% retracement of 3587.03 to 2449.19 at 2883.84. Though, there is still little prospect of reclaiming 3000 handle yet.
Position trading strategy
We currently have no position on hand. We mentioned last week that it's about time for Dollar to have a bearish near term reversal. And it actually happened in a way. That is, GBP/USD led by rebounding ahead of 1.2661 key support. EUR/USD followed by rebounding off equivalent support at 1.1300. AUD/USD and NZD/USD may even be reversing the medium term trend. However, as noted above, the late rebound in Dollar index countered this bearish view. And, such rebound was supported by strong rise in US yield.
However, is the greenback ready to resume medium term rise? It doesn't look very convincing too. US stocks are vulnerable to another fall as correction extends, in particular if that's a response to rise in yield. And that would put some pressure on Fed's rate hikes, which will in turn cap Dollar's rally. Additionally, Dollar's drain on emerging markets might be starting to reverse. USD/TRY's recent fall is a clear example. And now it could be the turn of Chinese Yuan and Hong Kong Dollar. That would be another factoring that limit Dollar's rally. So, we'd prefer to leave Dollar alone for now.
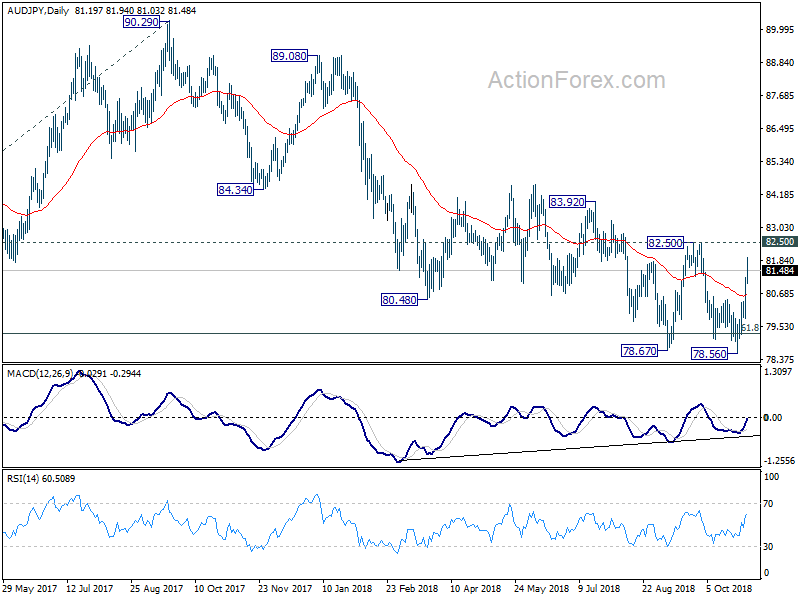
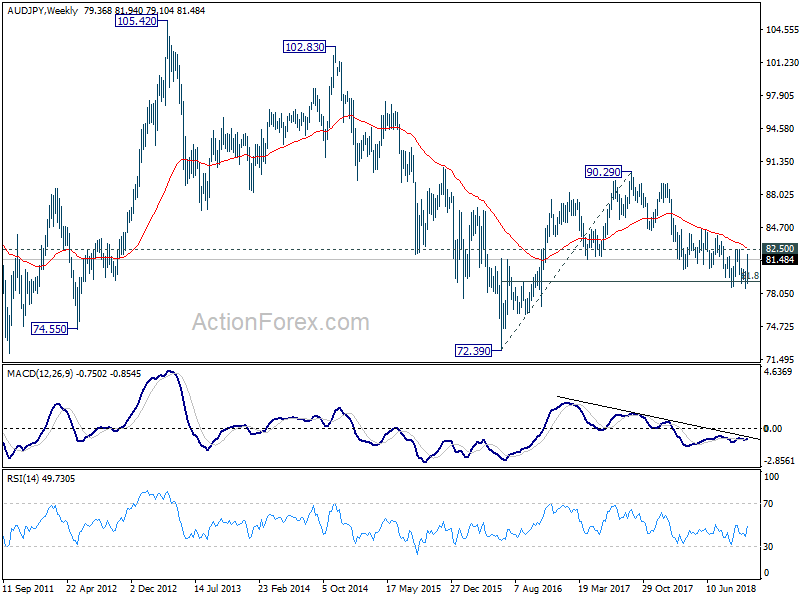
Meanwhile, if US-China trade conflict is really going into some resolution, AUD/JPY could be a pair to buy. Technically, bullish convergence in daily MACD provides the base of a trend reversal. It failed to sustain below 61.8% retracement of 72.39 (2016 low) to 90.29 (2017 high) at 79.22. Also, the cross could be forming a double bottom pattern (78.67, 78.56). Though, as with trading any pattern, it's not advisable to jump the gun. So, we'll be patient and wait for the double bottom to complete first. As the choppy fall from 90.29 is corrective looking, we're seeing the prospect of at least retesting 90.29. So, it's worth the wait.
GBP/USD Weekly Outlook
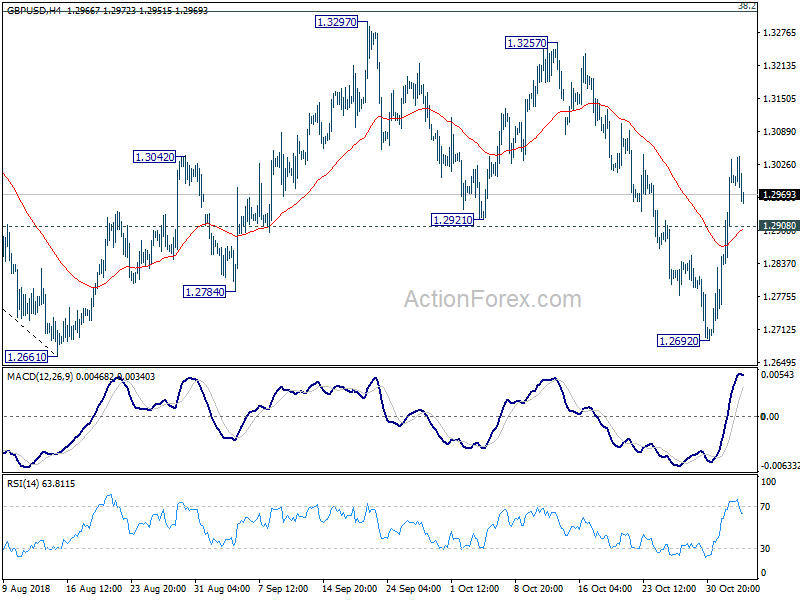
GBP/USD dipped to 1.2692 initially last week but rebounded strongly ahead of 1.2661 key support. The development suggests that fall from 1.3297 has completed and the consolidation pattern from 1.2661 is extending with another rising leg. Further rise is expected this week as long as 1.2908 minor support holds. Rise from 1.2692 should target 1.3297 resistance Nonetheless, we'd expect strong resistance from 1.3316 fibonacci level to limit upside to bring down trend resumption eventually. On the downside, below 1.2908 minor support will turn bias back to the downside for 1.2692 instead.
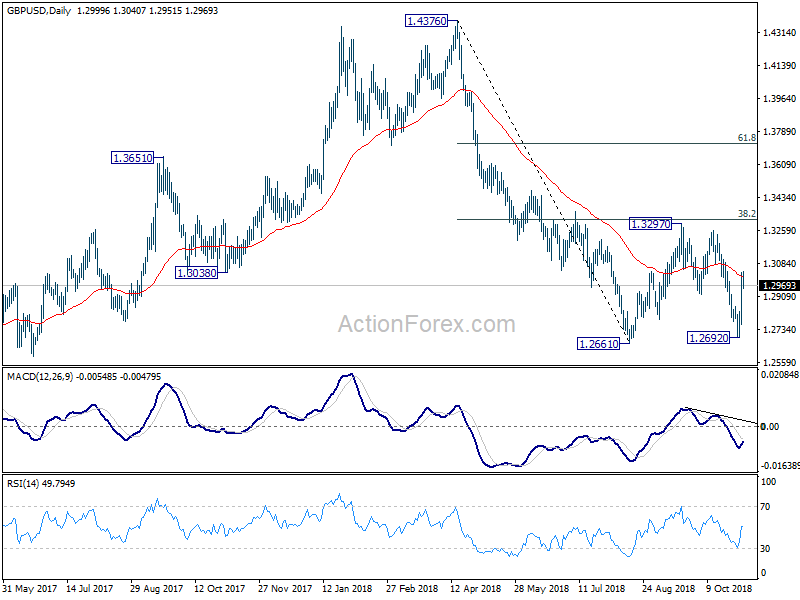
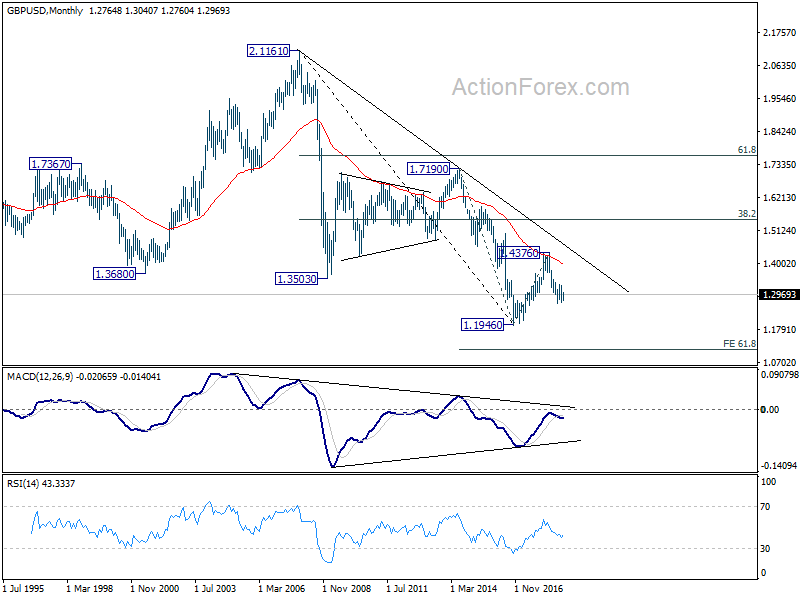
In the bigger picture, whole medium term rebound from 1.1946 (2016 low) should have completed at 1.4376 already, after rejection from 55 month EMA. The structure and momentum of the fall from 1.4376 argues that it's resuming long term down trend. And this will be the preferred case as long as 38.2% retracement of 1.4376 to 1.2661 at 1.3316 holds. However, firm break of 1.3316 would bring stronger rebound to 61.8% retracement at 1.3721. And, the eventual depth of the fall from 1.4376, and the chance of hitting 1.1946 low, will depend on the strength of the interim corrective rebound from 1.2661.
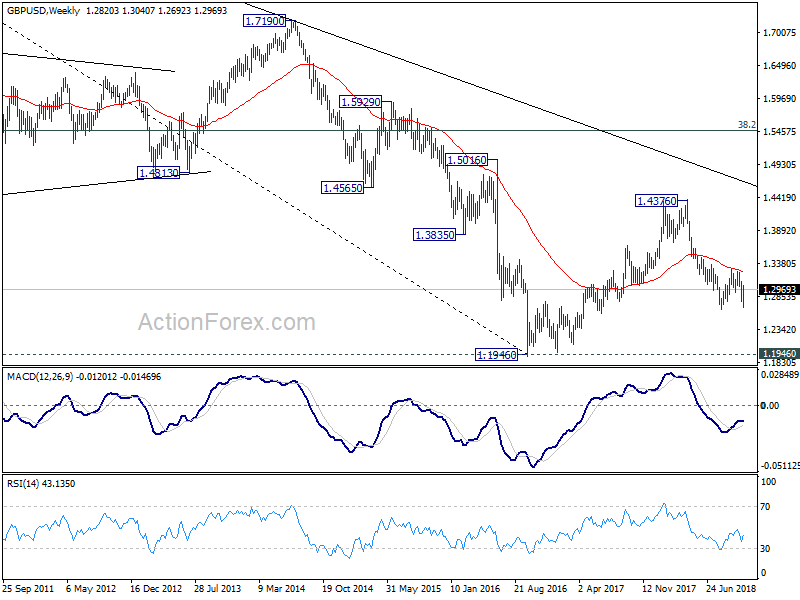
In the longer term picture, outlook in GBP/USD is held bearish. Rebound from 1.1946 was rejected solidly by falling 55 month EMA. The pair was limited well below 38.2% retracement of 2.1161 (2007 high) to 1.1946, as well as the decade long falling trend line. On break of 1.1946, next target will be 61.8% projection of 1.7190 to 1.1946 from 1.4376 at 1.1135.
Summary 11/5 – 11/9
Monday, Nov 5, 2018
[php_everywhere instance="1"]
Tuesday, Nov 6, 2018
[php_everywhere instance="2"]
Wednesday, Nov 7 2018
[php_everywhere instance="3"]
Thursday, Nov 8, 2018
[php_everywhere instance="4"]
Friday, Nov 9, 2018
[php_everywhere instance="5"]
Weekly Economic and Financial Commentary: Volatile Financial Markets, but Solid Economic Data
U.S. Review
Volatile Financial Markets, but Solid Economic Data
- This week saw plenty of U.S. economic data released, and most of it painted a positive picture of the current state of the U.S. economy.
- The Fed's preferred measure of inflation was right on target in September, and consumer confidence once again hit a new cycle high in October.
- Wage and salary growth also reached a cycle-high in Q3 according to data from the Employment Cost Index. Labor market tightening continued into Q4, with employers adding 250,000 jobs in October.
Volatile Financial Markets, but Solid Economic Data
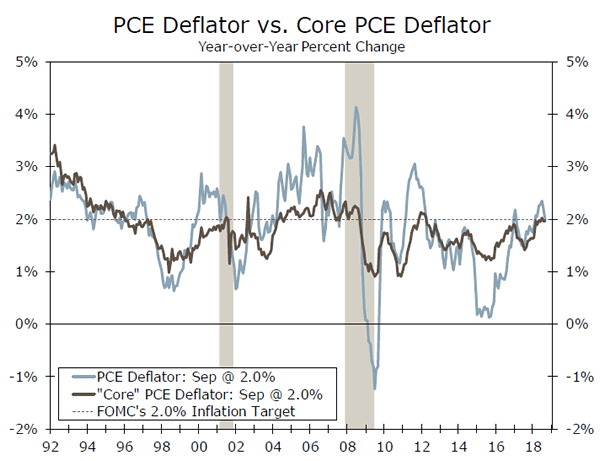
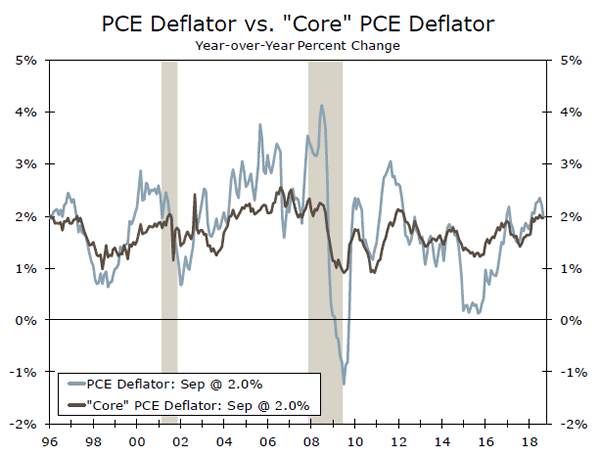
This week saw plenty of U.S. economic data released, and most of it painted a positive picture of the current state of the U.S. economy. Personal spending rose a solid 0.4% in September, consistent with the robust pace of consumption reported in last week's Q3 GDP release. Spending was driven by a surge in durables, which, at least in part, was due to replacement demand after Hurricane Florence. Perhaps of more interest was the inflation data that was contained in the personal income report. The Fed's preferred gauge of inflation, the PCE deflator, came in right on top of the Fed's 2.0% target for both the headline and the "core" measure (see chart on front page). With inflation still squarely on target, we believe the Fed remains on target to raise rates at its December meeting.
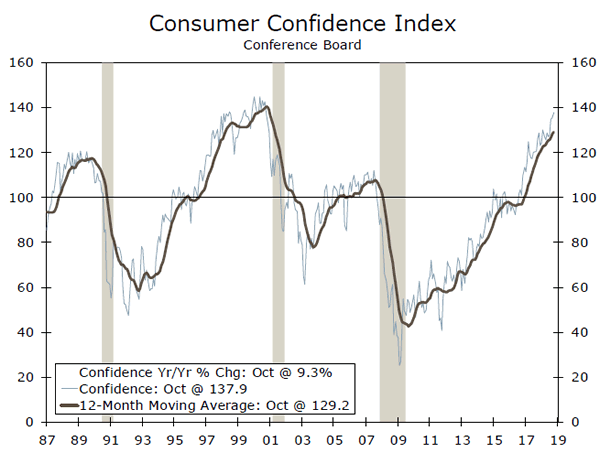
Boosting the case for additional Fed rate hikes was another cycle high in the Consumer Confidence Index, which hit 137.9 in October (top chart). The index is now only about seven points below the alltime high reached in January 2000 at the peak of the tech bubble. Encouragingly, the gain was driven by increases in both the present situation and expectations component. Consumers were more upbeat about job availability and income expectations, consistent with the ever-tightening labor market.
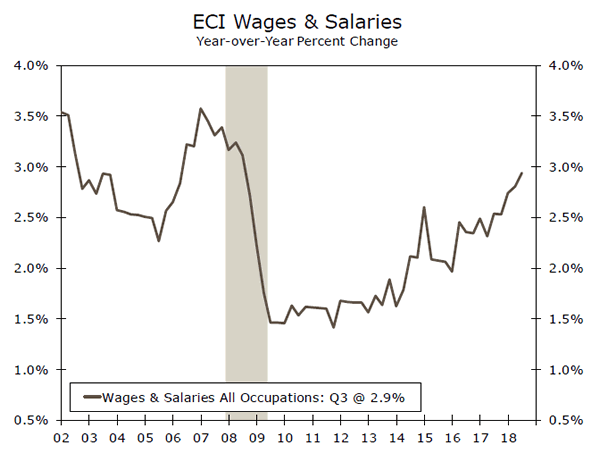
Labor market tightness was also evident in the Employment Cost Index release this week. Labor costs continued to climb over the third quarter, with the ECI increasing slightly faster than expected at 0.8%. Over the past year, the ECI is up 2.8% versus 2.5% this time last year. Compensation costs grew faster in Q3 due to a pickup in the wages component. Wages and salaries strengthened 0.9% over the quarter, and private sector wages are up 3.1% over the past year, which is the strongest pace of the expansion. Despite it being a slow grind higher, wage growth in the United States is clearly on an upward trend (middle chart), in line with what would be expected from diminishing labor market slack.
One area of weakness this week was a softer-than-expected reading from the ISM manufacturing index. Both the production and new orders components fell in October, as did the employment component. At 57.7, the index still signals that output growth in the factor sector remains solid, but the index has slipped below both its six- and 12-month moving averages. The strong dollar and trade tensions are likely offsetting some of the boost provided by the healthy domestic economy.
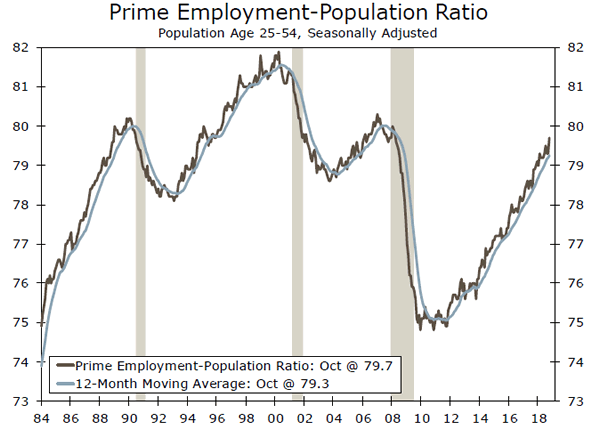
Finally, employment growth was 250,000 in October, surpassing already lofty expectations for a 200,000 job gain. Average hourly earnings also increased over the month and rose above a 3.0% year-over-year pace for the first time since 2009. Job growth was broad-based, with strong gains in manufacturing, education & health services and leisure & hospitality. Through the monthly noise, the tightening labor market is evident across a number of metrics. The prime age employment-population ratio, which measures what percent of the U.S. population age 25-54 is employed, continues to move higher on trend and is nearing the peak reached in the previous cycle (bottom chart).
U.S. Outlook
ISM Non-Manufacturing • Monday
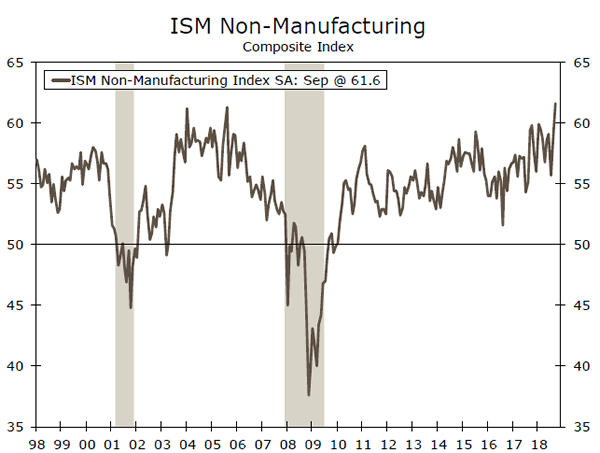
Activity across the economy remained solid in September, as indicated by the ISM non-manufacturing index. The index, which includes the service sector as well as construction and mining industries, soared to a 21-year high in September of 61.6.
While last week's GDP report suggested solid momentum heading into the final quarter of the year, we wouldn't be surprised to see the ISM non-manufacturing index give back some of its recent gain. Trade concerns are beginning to percolate beyond the manufacturing sector, and other gauges of the service sector, including the Markit, Richmond Fed and Dallas Fed Services PMIs, have moderated from a few months ago. We estimate the ISM nonmanufacturing index fell back to 59.8 in October, which would still be consistent with activity expanding at a solid clip across the bulk of the economy.
Previous: 61.6 Wells Fargo: 59.8 Consensus: 59.0
FOMC Decision • Thursday
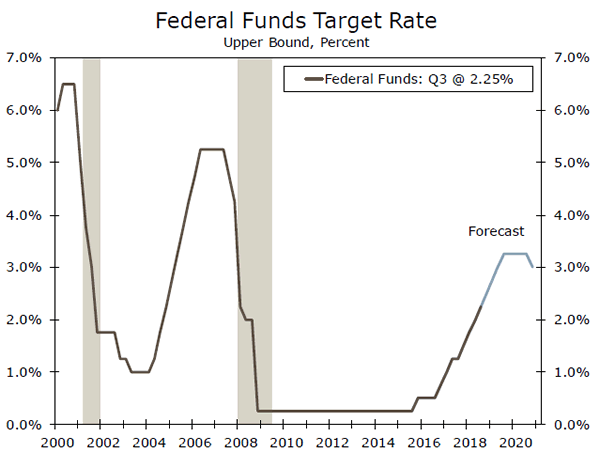
The previous FOMC meeting brought a widely-expected quarter-point rate hike as well as upward revisions to the Fed's expectations for GDP growth. Rate projections submitted by the committee for the next few years were virtually unchanged and suggested that, despite removing the description of policy as "accommodative," the near-term path of policy has not shifted.
Wednesday's meeting will not include a press conference (the last as the Chair will hold one after each meeting next year). Another strong quarter of growth and job gains should keep the statement's tone upbeat. We would not be surprised to see a nod to the recent volatility in financial markets, but committee members have not appeared worried about the recent moves. Therefore, we are not expecting the Fed to signal any change to the current path of policy and we expect the FOMC to leave rates unchanged before hiking again in December.
Previous: 2.00-2.25% Wells Fargo: 2.00-2.25% Consensus: 2.00-2.25%
Producer Price Index • Friday
Last month producer prices rose for the first time since June. The 0.2% gain was entirely driven by the service sector, while prices for food and energy goods declined. On a year-over-year basis, the producer price index slipped to 2.6%, but the underlying trend remains firm. Excluding food, energy and trade services (measured by margins, not selling prices), our preferred measure of core PPI was unchanged at 2.9%.
Producer prices likely rose another 0.2% in October. That should be enough to push the year-ago rate to 2.5%. Input costs have continued to increase in recent months, suggesting further price pressure. The share of manufacturers reporting higher input costs remains elevated, while the cost of intermediate services and goods is still running above finished goods and services.
Previous: 0.2% Wells Fargo: 0.2% Consensus: 0.3% (Month-over-Month)

Global Review
Global Trade Concerns Back in Focus
- Global trade fears re-emerged after U.S. President Donald Trump threatened to impose tariffs on the remainder of Chinese goods if upcoming talks with Chinese President Xi in late November do not result in a favorable trade deal. Chinese PMIs fell more than expected, adding to concerns around a more precipitous slowdown in China's economic growth.
- In other developments, the Bank of England and Bank of Japan both held monetary policy steady as expected. Meanwhile, on the data front, Eurozone Q3 GDP grew at the slowest pace since 2014, while Mexico's growth figures pointed to ongoing economic strength.
Global Trade Concerns Back in Focus
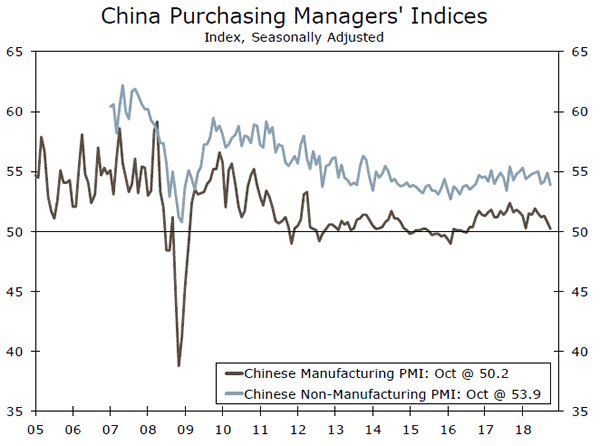
Markets returned their focus to global trade developments this week after a statement from U.S. President Trump that he would announce tariffs on the remainder of Chinese goods by early December if talks between Trump and Chinese President Xi did not result in a favorable trade deal. This announcement simply represents the latest escalation in U.S. rhetoric around potential further trade measures against China. Indeed, the U.S. has already imposed tariffs on $250 billion of Chinese goods, with the 10% tariff on $200 billion of those goods set to increase to 25% by year end if a deal is not reached before then. The ongoing trade conflict represents a significant downside risk for the Chinese economy, and additional U.S. tariffs could spur further policy support measures from Chinese monetary and fiscal authorities. This week's release of Chinese PMIs added to concerns around a slowing economy, as the manufacturing PMI fell to 50.2 in October, the lowest level since 2016, although the services PMI remained firmly in expansion territory at 53.9 (top chart).
In other policy developments, meetings from major developed market central banks this week were fairly uneventful. The Bank of Japan made no change to its monetary policy stance and reaffirmed its commitment to highly accommodative monetary policy. Meanwhile, the Bank of England also held its policy rate steady, but noted rising excess demand and building domestic cost pressures, signaling an increased impetus for further rate hikes. However, we do not expect the BoE to raise rates again until it has more clarity over the Brexit situation, particularly whether the E.U. and U.K. can reach a deal before the March 2019 deadline.
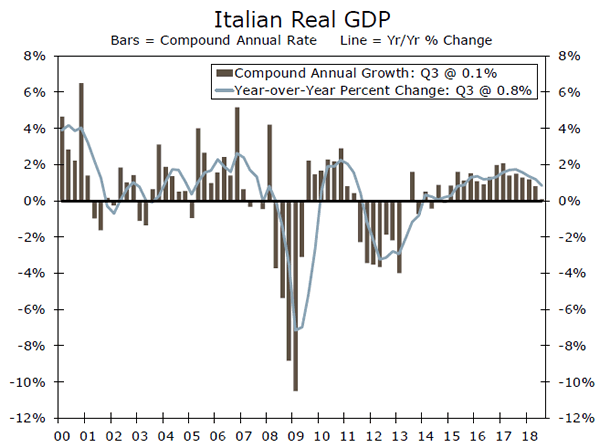
On the data front, European GDP figures were generally disappointing. The Eurozone economy as a whole grew just o.2% on a sequential basis in Q2, while the year-over-year growth pace slowed to 1.7%, the lowest since 2014. Looking at the country breakdown, much of the weakness appeared to be due to stagnation in the Italian economy, where the year-over-year pace of GDP growth softened to just 0.8% in Q3 (middle chart). Those Italian GDP numbers could complicate the push by Italy's government for more fiscal stimulus, as it has already been criticized for having overly optimistic growth targets (~1.5% nominal GDP growth). However, we doubt these growth figures are weak enough to derail the European Central Bank's (ECB) plans to end its bond purchase program in December, while the timing and pace of initial ECB rate hikes will likely depend on the evolution of Eurozone GDP and inflation figures going forward.
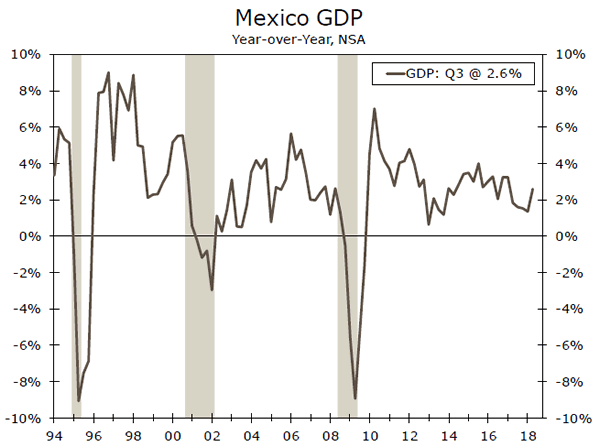
Meanwhile, Mexico's economic growth figures for Q3 were quite solid, as real GDP rose 0.9% on a sequential basis and the yearover- year growth pace picked up to 2.6% (bottom chart). Growth was fairly broadly based across different sectors of the economy, with services in particular showing strength. That said, despite strong economic data this week, Mexico's financial markets showed outsized volatility as incoming President Andres Manual Lopez Obrador (AMLO) vowed to cancel construction of a new airport in Mexico City, raising concerns around the foreign investment climate under the incoming AMLO administration.

Global Outlook
China Trade Balance • Thursday
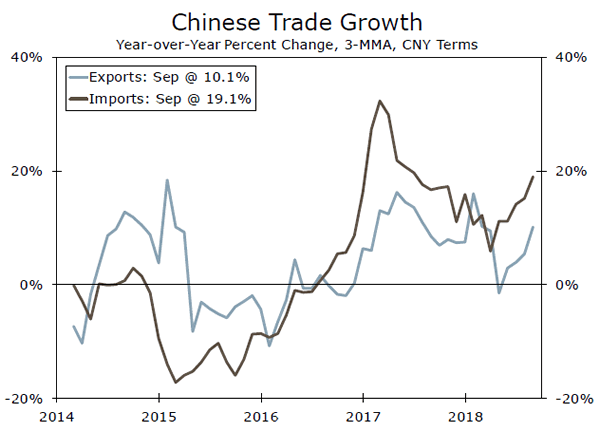
The Chinese economy has been at the center of global economic focus this year amid the ongoing trade tensions with the United States. China's trade numbers have been of particular interest as the U.S. imposed tariffs on a total of $250 billion, or roughly half, of all imports from China. It is difficult to precisely quantify the effect of those tariffs on Chinese trade, but there have not been material signs of slowing in total Chinese export growth.
In fact, if anything, export growth has increased in recent months, perhaps a reflection of Chinese exporters looking to get ahead of possible further tariffs from the U.S. administration. Thus, it will be important to watch these figures in the coming months to see whether there is a continued pickup or a renewed slowdown.
Previous: $31.7B
Mexico CPI • Thursday
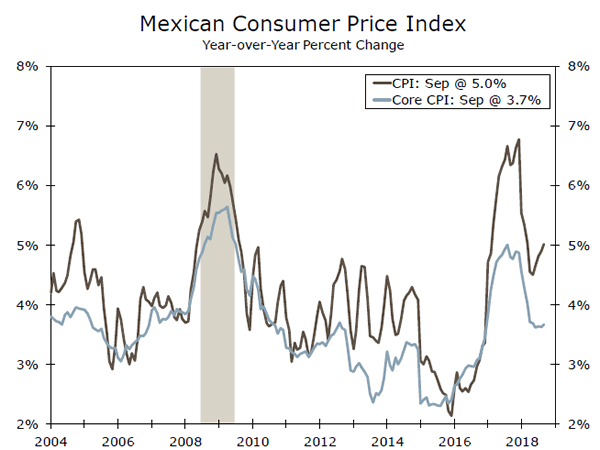
Mexico's inflation has been a bit of a rollercoaster in recent years, largely reflecting significant volatility in the value of the Mexican peso versus the U.S. dollar. Peso weakness in 2016 and 2017 led to a sharp increase in CPI inflation, but price gains subsequently slowed earlier this year as the peso stabilized somewhat. In more recent months, however, inflation has moved higher, partly driven by higher oil prices (core CPI inflation has been relatively steady).
The resilience in headline CPI inflation is likely contributing to a cautious stance from Mexico's central bank, which has hiked rates a cumulative 475 bps since 2015 and has given no signals of an intention to cut interest rates any time soon. In fact, at its latest meeting, policymakers struck a hawkish tone, suggesting rates could rise even further. In our view, Mexico's central bank may not cut rates until 2019, and it will likely take more concrete signs that inflation is receding for the central bank to consider doing so. Previous: 5.0%
Consensus: 4.9% (Year-over-Year)
U.K. GDP • Friday
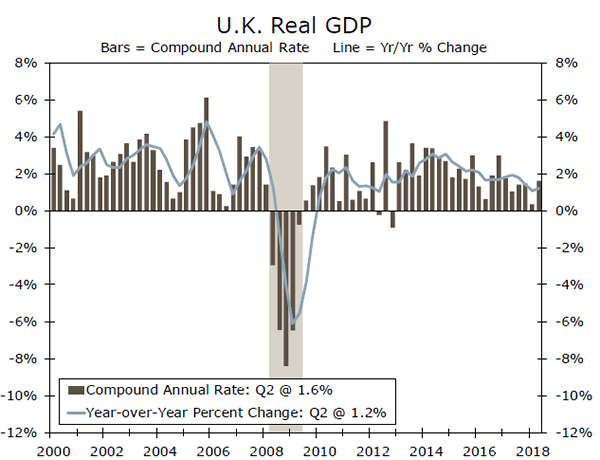
U.K. economic growth has generally underwhelmed in 2018, with real GDP rising just 1.2% year over year in Q2. If our full-year forecast for U.K. GDP growth of 1.2% is realized, it would be the weakest annual pace of U.K. GDP growth since 2009.
A closer look at activity figures suggests somewhat diverging performances among different sectors of the U.K. economy. U.K. consumers have benefitted from a pickup in a wage growth and receding inflation, with retail sales growth having picked up in recent months. Meanwhile, there are signs of weakness in the business sector, with manufacturing output growth trending lower. With Brexit uncertainty likely to persist in the coming months, it is hard to envision a significant rebound in U.K. investment activity. We expect real GDP to have risen 0.5% on a sequential basis in Q3, consistent with a 1.4% year-over-year growth pace.
Previous: 1.2% Wells Fargo: 1.4% Consensus: 1.5% (Year-over-Year)
Point of View
Interest Rate Watch
A Little Less Uncertainty
The financial markets turned around this week as some of the issues clouding the outlook cleared a bit. October's stock market sell-off appears to have been rooted in the Fed's belief that the extraordinarily accommodative monetary policy put in place in the aftermath of the financial crisis and painfully slow recovery was no longer needed. The Fed's plan is to gradually return the federal funds rate to neutral or slightly above that if it needs to break the economy's momentum.
Despite the Fed's more heated rhetoric, the case for the Fed moving more aggressively than the path outlined in its dot plot is not very strong. Inflation has been slow to materialize (top chart) and one-off bumps in prices from trade tensions are unlikely to set off a self-reinforcing wage-price spiral.
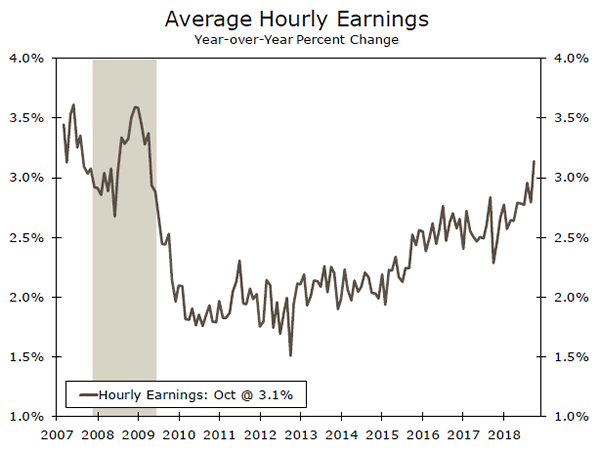
Wages have also been slow to recover. The latest average hourly earnings data show wages rising 3.1% over the past year, the largest gain since 2009 (middle chart). The jump reflects just a 0.2% rise in October and a weak year-ago number. Wage increases in the 3%-3.5% range would be a good thing, however, and would be partially offset by productivity growth, which has risen at a 2.5% pace since tax cuts were enacted but just 1.3% over the past four quarters. If you split the difference, productivity appears set to offset half the increase in wages, which should keep inflation near the Fed's target of 2%.
Trade tensions may also be set to deescalate. We have long felt tariffs were being used as a negotiating tool and some accommodation would be reached following the November election. Both sides felt their position would be strengthened by the midterm results. A divided Congress would create a little more political theatre in the U.S. but would not threaten to undermine the progress made by reducing taxes and burdensome regulations, allowing U.S. growth to continue along its recent stronger path.
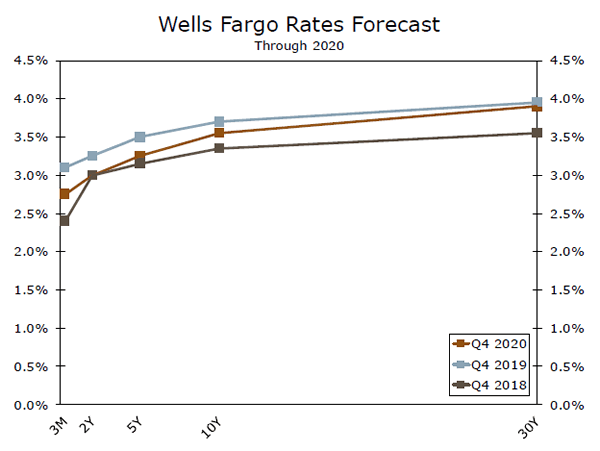
Long-term rates dipped this week, even as the financial markets strengthened. We see interest rates continuing to gradually move higher (bottom chart), as confidence grows that U.S. economic growth will likely remain well above 2%, while inflation remains close to the Fed's 2% percent target.
Credit Market Insights
Got Junk?
In previous reports we have highlighted that the debt-to-GDP ratio of the non-financial corporate sector has reached an all-time high. In addition, a growing portion of corporate debt is short term, increasing the susceptibility of balance sheets to interest rate increases. But what about the credit rating of this debt? Eager to take advantage of historically low spreads over the past decade, corporations issued vast amounts of lower-rated debt. According to Bloomberg Barclays Index data, corporate debt rated BBB—the lowest investment grade (IG) rating—has tripled since 2008 to almost $2.5 trillion, and now comprises 49% of total IG debt outstanding, a record share. Thus, a large proportion of outstanding debt is one credit downgrade away from "junk" status, which would increase corporate borrowing costs and impair the ability of firms to rollover their liabilities, as investors demand higher yield for greater credit risk.
While not overly concerned about the financial health of U.S. corporations, we see three drivers of further modest deterioration in corporate financial health— rollover risk as the Fed marches ahead with rate increases, tighter profit margins and exogenous shocks to the financial system or investor sentiment. As the credit cycle ages, rates rise and profit margins contract, creditworthiness will come under greater scrutiny. Indeed, credit spreads have been rising much of this year, and issuance has fallen. Widespread ratings downgrades have the potential to accelerate this deterioration, and are a risk worth monitoring.
Topic of the Week
Checking in on the Fed's Mandate
The Fed's mandate in conducting monetary policy consists of: maximum sustainable employment, stable prices and moderate long-term interest rates.
By just about any measure, the labor market is at, or very close to, "full employment." The unemployment rate is at 3.7%, continuing jobless claims came in at the lowest level in over 45 years this week and the largest problem cited by businesses is not having enough workers to choose from. So what are the implications for Fed policy?
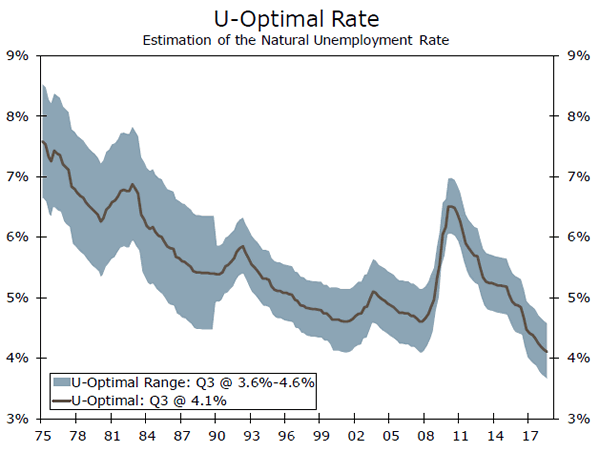
While the Fed analyzes many indicators in conducting its policy stance, an accurate measure of the natural unemployment rate, or the lowest the unemployment rate can go while maintaining stable inflation, would assist in supporting its mandate. We have developed a technical methodology in estimating the natural rate, which we refer to as "u-optimal."
We estimate that u-optimal currently stands at 4.1%, which is a bit above the Q3 unemployment rate of 3.8%. But, as a precise estimate of the natural rate is not directly observable, one should think of it as a range (top chart). This estimated range has implications for the Fed.
Since the actual unemployment rate (3.7%) is within our estimated range (3.6%-4.6%), the Fed likely can continue to raise rates at a gradual pace. If it were below our range, then the Fed may find it necessary to undertake a more aggressive pace of rate hikes. Why?
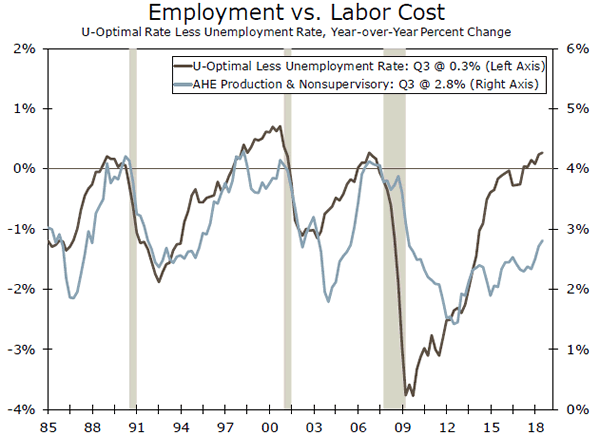
As depicted in the bottom chart, a decrease in labor market slack (black line), or a narrowing between u-optimal and the actual unemployment rate, has historically been associated with a rise in wage inflation (blue line). Although wage growth has trended higher in recent years, it is still well short of rates that prevailed at this point in previous cycles. Therefore, there is the risk that limited slack in the labor market could lead to further wage acceleration going forward, which could cause inflation to move markedly above the Fed's target of 2%.