Sample Category Title
Market Morning Briefing: Dollar Yen Has Immediate Support At 113 And Lower Supports At 112.5 And 111.5
STOCKS
Most Equity indices, which saw a good short-covering rally for most of last week, could run into profit-taking/ resistance early this week. At the same time, they do not look bearish either.
The Dow (25270.83, -109.91) has already seen some profit-taking on Friday (contrary to our earlier expectation of a rise towards 25750-26000) as the strong US employment data (see Interest Rates below) led to an increase in US Yields. A small dip towards 25000, or even 24500, could be seen, but that while above 24000 things will not be bearish either.
The DAX (11519) may have immediate Resistance at 11553 (21-day MA) and 11690 (Friday's high). Expect the DAX to range sideways between 11200-600 this week.
In Asia, the Shanghai (2669, -0.41%) already trades a little lower. Strong medium-term Resistance is seen at 2700-2750. Immediate Support also seen at 2600-2550. How the Shanghai shapes up in the coming days is going to be very interesting.
The Nikkei (21985, -1.16%) is down sharply compared to Friday. It has good Resistance at 22300-500 and could become bearish in case of a fall below 21200.
The Nifty (10553, +172.55) saw a good rally on Friday, but is reported to be trading lower near 10545 in Singapore. A dip towards 10400-200 is possible over this week and the next. The Sensex (35011.65, +1.68%) too may dip towards 34250 this week after the strong rally seen last week.
COMMODITIES
Brent (72.41)could dip even lower towards support near 71.5 on daily line chart before rising from there. The 55 weeks MA at 71.69 could provide crucial support in the weeks ahead.
WTI (62.68) broke below the 55 weeks MA near 65 last week and could now move even lower towards support near 60 on 3 day line chart. There is immediate resistance near 64 on daily candles which would need to be broken for us to start looking at the upside again.
Gold (1233.50) could move up higher towards resistance near 1250 over the next couple of weeks. Immediate support near 1225-1230 should keep the downside restricted.
Copper (2.787): If Copper breaches 2.80 again in the next 1-2 sessions, the chances of a rise towards 2.85 over the next couple of weeks increases.
FOREX
While below 1.1425, 1.31 and 0.725 respectively, Euro, Pound and Aussie could fall gradually over the next 1-2 weeks. Consequently, USDINR’s downside might just be restricted near 72.45-00 in the near term.
Euro (1.1388) came off from resistance near 1.1456 on Friday and could move lower towards 1.135 in today’s session while it stays below resistance near 1.1425 . A gradual fall to 1.13 looks likely over this week/by next week.
Dollar Index (96.48) – While above 96.30-40, Dollar Index could continue rising towards 96.70 in today’s session and ultimately target resistance near 97.20-25 over this week/by next week.
Dollar Yen (113.16) has immediate support at 113 and lower supports at 112.5 and 111.5. While above 113, the preference is for a rise towards 114.0-114.5 by next week. A break below 112.5 (if seen) would greatly reduce chances of another rise to 114 and beyond.
Euro-Yen (128.88) : As Dollar Yen rises towards 114.0-114.5 while Euro stays below 1.1425, the upside for Euro Yen in the next couple of weeks should be capped below 130-131. Resistance is seen near 131 on 3 day line chart – so, a rise towards 130-131 in this week could take place, after which it could come off from there.
Pound (1.2987) has crucial resistance on weekly candles at 1.31 and support near 1.28. While below 1.31, the preference would be for an ultimate break below 1.28 – which if happens, would be very bearish for the Pound. However, a break above 1.31 would make us start looking at the possibility of an interim near term rise towards 1.33-34 before the broader downtrend is then resumed.
Aussie (0.7185) came off from a high near 0.7258 on Friday and is now again trading below resistance near 0.72 on weekly candles. It would be crucial to see whether it dips back below 0.7180-70 in the next couple of sessions- if it does, we might again see a fall towards 0.710-0.705 over the next 1-2 weeks. Only a week close above the 21 weeks MA (0.7267) would the bias on Aussie shift to the upside.
Dollar Rupee (72.79) – With Euro and Aussie coming off from 1.145 and 0.726 on Friday, USDINR has had a gap up opening near 72.90. USDINR’s downside might just be restricted near 72.45-00 in the near term.
INTEREST RATES
US Employment data came in very strong on Friday. Of particular interest is that the Average Hourly Earnings has accelerated to 3.14% Y/y growth, suggesting increased tightness in the US labour market. This makes a rate hike in December a near-certainty and even raises chances of hike in the forthcoming FOMC meeting on 8th Nov. This has led to an increase in US yields.
The US 10Yr has moved up to 3.21% contrary to our expectation of a fall to 3.10%. It may now move up some more towards important Resistance in the 3.25-3.30% region.
The German 10Yr (0.43%) and the Japanese 10Yr (0.13%) also look like they can move up a bit towards 0.53% and 0.16% respectively.
However, the German-US 10Yr Spread (-2.78%) is at a crucial Support within an overall strong downtrend. We need to see if there is a bit of a bounce from here, or whether the Support is broken. If the Support is broken, it could limit the recent strength in the Euro (1.1440). In contrast, there is Resistance near current level on the US-Japan 10Yr Spread (3.08%). Maybe that could limit the recent strength in Dollar-Yen (112.80) as well. We have to see that.
EUR/USD Facing Uphill Task Near 1.1450
Key Highlights
- The Euro recovered recently, but it faced a strong resistance near 1.1450 against the US Dollar.
- There is a crucial bearish trend line in place with resistance at 1.1450 on the 4-hours chart of EUR/USD.
- The US nonfarm payrolls figure in Oct 2018 increased 250K, more than the 190K forecast.
- Today, the US ISM Non-Manufacturing Index for Oct 2018 will be released, which is forecasted to decline from 61.6 to 59.5.
EURUSD Technical Analysis
The Euro extended declines this past week and traded towards 1.1300 against the US Dollar. Later, the EUR/USD pair recovered, but it faced a strong resistance near the 1.1450 resistance.
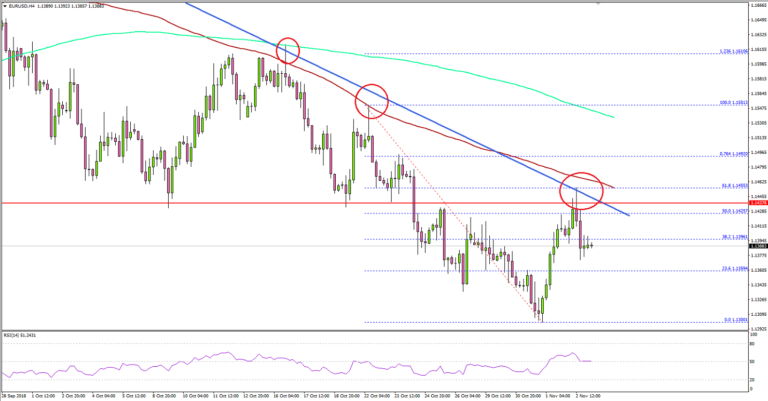
Looking at the 4-hours chart, the pair traded as low as 1.1300 and recovered above the 1.1400 resistance. There was a break above the 50% Fib retracement level of the recent decline from the 1.1551 high to 1.1300 low.
However, the pair struggled to clear a major resistance near 1.1450, which was a support earlier. Moreover, there was a failure near the 100 simple moving average (4-hours) plus the 61.8% Fib retracement level of the recent decline from the 1.1551 high to 1.1300 low.
More importantly, there is a crucial bearish trend line in place with resistance at 1.1450 on the same chart. Therefore, it won’t be easy for buyers to clear the 1.1440 and 1.1450 resistance levels.
On the downside, the main support is near the 1.1350, below which the pair is likely to revisit the 1.1300 support area.
Fundamentally, the US nonfarm payrolls figure in Oct 2018 was released by the US Department of Labor. The market was looking for an increase from the last reading of 134K to 190K.
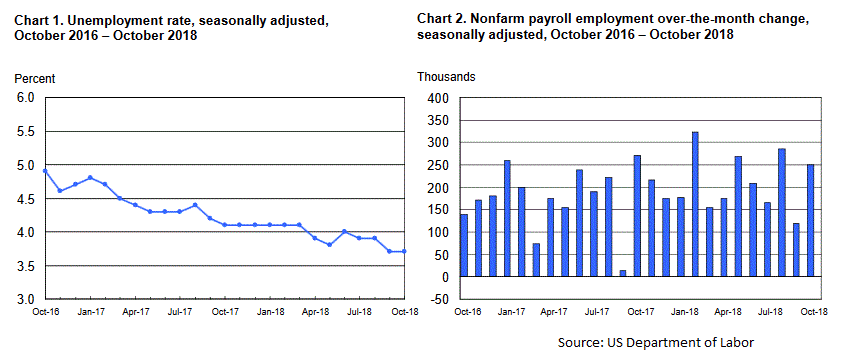
The actual result was better than the forecast as the US nonfarm payrolls increased 250K in Oct 2018. However, the last reading was revised from 134K to 118K, and the unemployment rate remained unchanged from 3.7%.
The report added:
The unemployment rate remained at 3.7 percent in October, and the number of unemployed persons was little changed at 6.1 million. Over the year, the unemployment rate and the number of unemployed persons declined by 0.4 percentage point and 449,000, respectively.
Overall, the US Dollar is likely to remain in an uptrend and pairs like EUR/USD and GBP/USD could struggle to recover in the coming days.
Economic Releases to Watch Today
- UK Services PMI for Oct 2018 – Forecast 53.3, versus 53.9 previous.
- US Services PMI for Oct 2018 – Forecast 54.7, versus 54.7 previous.
- US ISM Non-Manufacturing Index for Oct 2018 – Forecast 59.5, versus 61.6 previous.
GOLD Threatens More Bull Pressure Towards 1,243.00 Zone
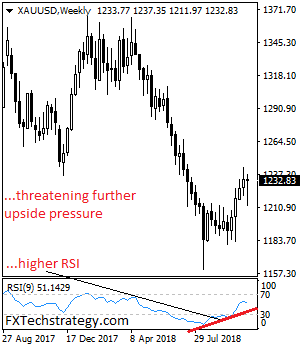
GOLD threatens more bull pressure as it looks to retarget the 1,243.41 resistance zone. On the downside, support comes in at the 1,220.00 level where a break will turn attention to the 1,210.00 level. Further down, a cut through here will open the door for a move lower towards the 1,200.00 level. Below here if seen could trigger further downside pressure targeting the 1,1990.00 level. Resistance resides at the 1,243.41 level where a break will aim at the 1,250.00 level. Above here will expose the 1,260.00 level. Further out, resistance stands at the 1,270.00 level. Its weekly RSI is bullish and pointing higher suggesting further strength. All in all, GOLD looks to recover further higher.
EURUSD Short Term Bearishness Remains Valid
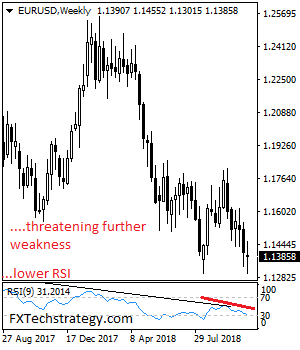
EURUSD short term bearishness remains valid with more weakness expected in the new week. This is coming on the back of its past week flat close. Support lies at the 1.1350 where a violation will aim at the 1.1300 level. A break below here will aim at the 1.1250 level. Further down, support lies at the 1.1200. Its weekly RSI is bearish and pointing lower suggesting further weakness. On the upside, resistance resides at 1.1400 level. A break through there will open the door for further upside towards the 1.1500 level. Further up, resistance comes in at the 1.1550 level where a violation will expose the 1.1600 level. All in all, EURUSD continues to face further downside pressure in the medium term.
Decision Time
Decision Time
Month-end flow combined with Midterm elections uncertainty was more than enough to keep investors busy, and there were enough head fakes from the Trump camp regarding progress on a trade deal with China to keep political uncertainly boiling. While the equity market and risk sentiment stabilise around current levels and some of the worst-case scenarios around trade war hedges unwind, overall risk sentiment has failed to pick up.
Investors are far too wary of an empty promise, but ultimately, they will need to decide how much of President Trump’s olive branch to China was a ploy to boost equity markets ahead of the US mid-term elections on Tuesday and how much of it is a bona fide attempt to reach an agreement.
Speaking of unwinding of worst-case scenario bets, USDCNH posted a bearish outside week after fast money ran for the exit as a push above seven would be less likely ahead of November G-20. If US-China negotiation channels remain open, an escalation on the US tariff front remains less likely so China will be more incentivised to keep Yuan weakness in check. None the less, the rally in the RMB complex also helped other Asian currencies which had their best week since late January.
Oil markets
Regardless of whether the markets are getting it right or not on the waivers debate, the temporary waivers on US sanctions against Iranian crude oil exports for eight nations provide at least some short-term cushion against the impact of sanctions due to take effect today.
While Iranian productions and exports declines will likely accelerate in the months ahead as massive importers like China and India become 100 % compliant on the sanction front. Traders are still dealing with increased flowage from the US, Russia and even OPEC.
Markets are looking for a base perhaps signalling a period of consolidation, but in the absence of a supply shocker, price retracements may be elusive and short-lived as the market deal with what appears to be a near-term oil surplus while factoring in a slowing global economy.
Gold Markets
Wedding season and demand ahead of Diwali are keeping jewellers busy. However, this belies the fact that gold demand for the first nine months of 2018 was the weakest since 2009, this despite central bank adding to gold reserves throughout August and September. But keep in mind much of Asian demand was sidelined due to the higher cost of gold in real currency terms as Asian currencies like the Rupee and Yuan have weakened considerably this year.
But Friday’s US payroll data where average hourly wages increased above 3 % for the first time since 2009 triggering a 5 $ drop on gold prices as this more robust inflation print keep the Federal Reserve Boards interest rates rise trajectory in check. Still with enough political uncertainly brewing, Gold should remain bid on dips as if the GOP loses significant support causing the USD to wobble, gold should be a hot commodity to own.
Asian Markets
Local Investor sentiment will remain nervous after local stock markets rallied hard on Friday, only to see fund managers selling US stocks on the numerous Trump headline twists and turns.
The Malaysian Ringgit
Although the government forecast a deficit of 3.7% for its 2018 budget, up from earlier forecasts of 2.8%. The Ringgit gained on Friday due to a weaker Yuan, but investors were also cheering when the Government announced it was doubling its Dividend from Petronas.
Main focus today
PMI numbers will be released for Singapore, Hong Kong and the Philippines. The market’s attention will be on the Caixin China PMI numbers where a negative number will raise more hopes for stimulus.
Malaysia will report trade figures while Indonesian GDP will also be published.
Chinese President Xi will be addressing the first international import forum in Shanghai.
Earnings in the region are expected from Softbank, Westpac, DBS and State Bank of India.
Eco Data 11/5/18
[php_everywhere instance="1"]
EUR/USD Weekly Outlook
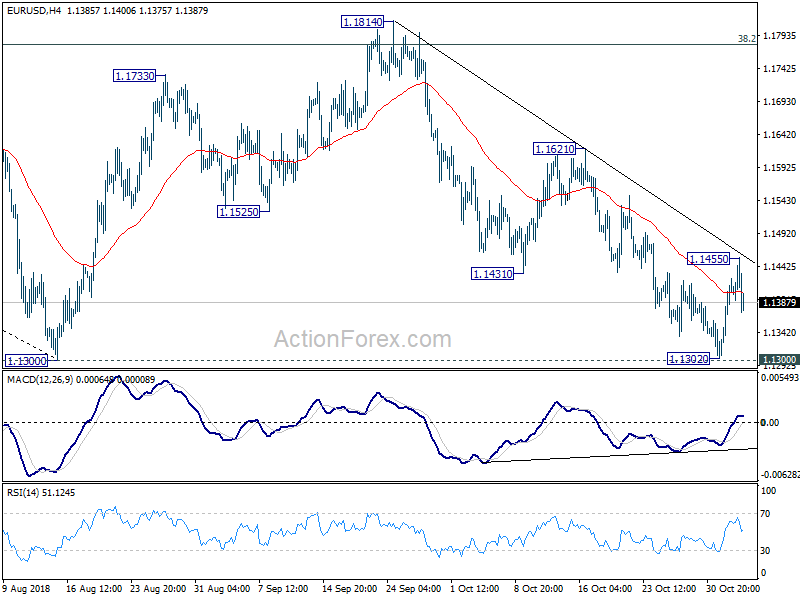
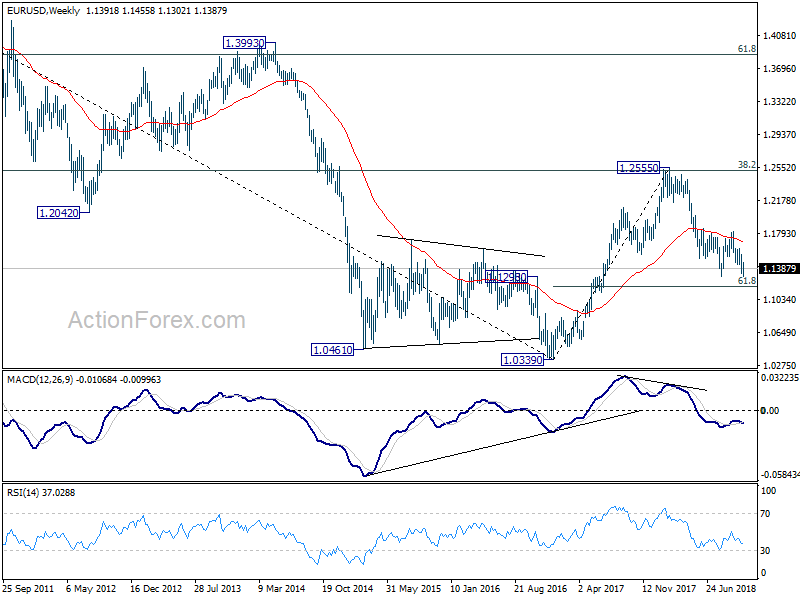
EUR/USD edged lower to 1.1302 last week but recovered just ahead of 1.1300 key support. Though, as a temporary top is formed at 1.1455 ahead of trend line resistance, initial bias is neutral this week first. On the upside, above 1.1455 reaffirm that consolidation pattern from 1.1300 has started the third, rising leg. Further rise should be seen to 1.1621 resistance and above. But upside should be limited by 1.1814 to bring down trend resumption eventually. On the downside, break of 1.300 will resume whole down trend from 1.2555 and target 1.1186 fibonacci level next.
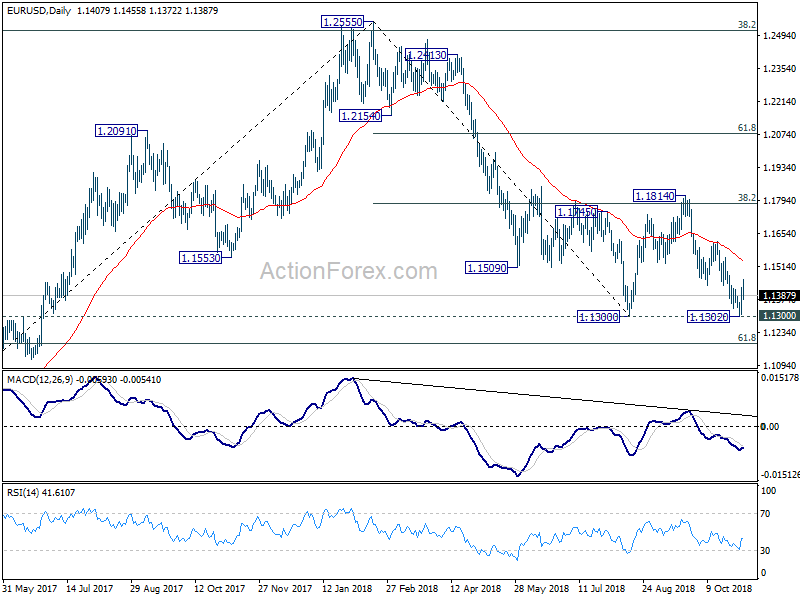
In the bigger picture, price actions from 1.1300 is seen as a corrective pattern. Decisive break of 1.1300 will resume the down trend from 1.2555 to 61.8% retracement of 1.0339 (2017 low) to 1.2555 at 1.1186 next. Sustained break there will pave the way to retest 1.0339. In case the consolidation from 1.1300 extends, upside should be limited by 1.1814 and 38.2% retracement of 1.2555 to 1.1300 at 1.1779. to bring down trend resumption eventually.
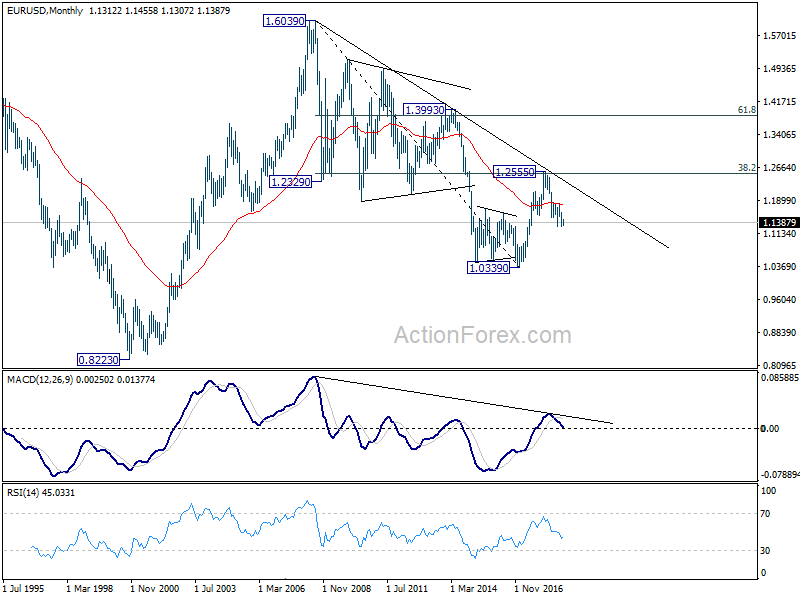
In the long term picture, the rejection from 38.2% retracement of 1.6039 to 1.0339 at 1.2516 argues that long term down trend from 1.6039 (2008 high) might not be over yet. EUR/USD is also held below decade long trend line resistance. Firm break of 61.8% retracement of 1.0339 to 1.2555 at 1.1186 should at least bring a retest on 1.0339 low.
USD/JPY Weekly Outlook
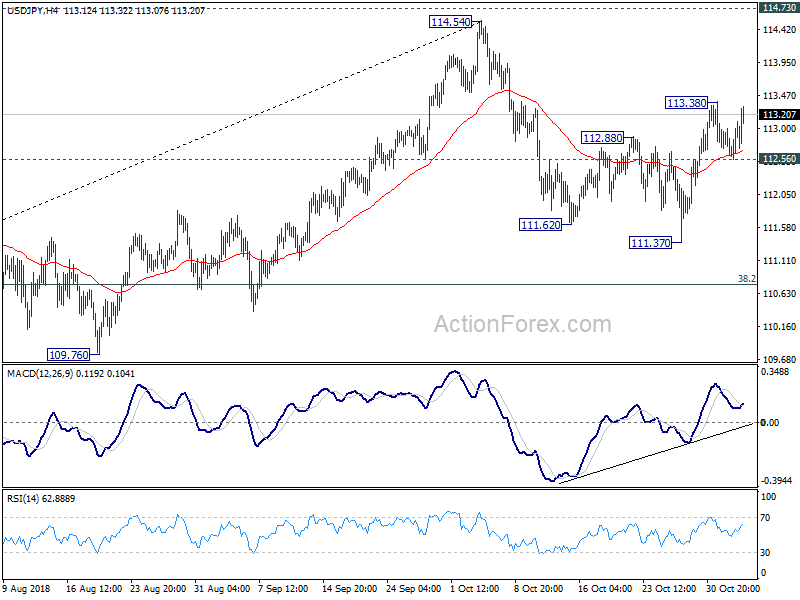
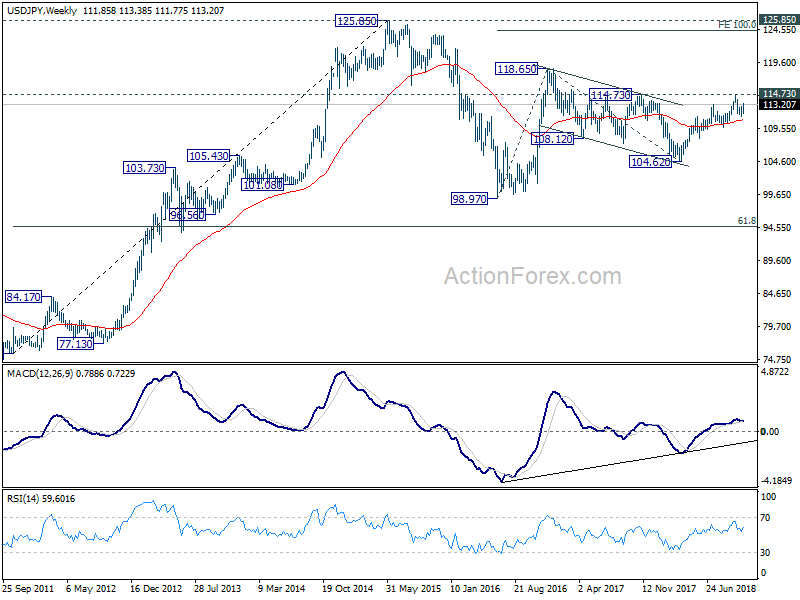
USD/JPY edged higher to 113.38 last week but turned sideway since then. Another rise is mildly in favor this week as long as 112.56 minor support holds. Above 113.38 will extend the rebound from 111.37 to retest 114.54/73 key resistance zone. On the downside, break of 112.56 will likely extend the correction from 114.54 to 38.2% retracement of 104.62 to 114.54 at 110.75 before completion.
In the bigger picture, corrective fall from 118.65 (2016 high) should have completed with three waves down to 104.62. Decisive break of 114.73 resistance will likely resume whole rally from 98.97 (2016 low) to 100% projection of 98.97 to 118.65 from 104.62 at 124.30, which is reasonably close to 125.85 (2015 high). This will stay as the preferred case as long as 109.76 support holds. However, decisive break of 109.76 will dampen this bullish view and turns outlook mixed again.
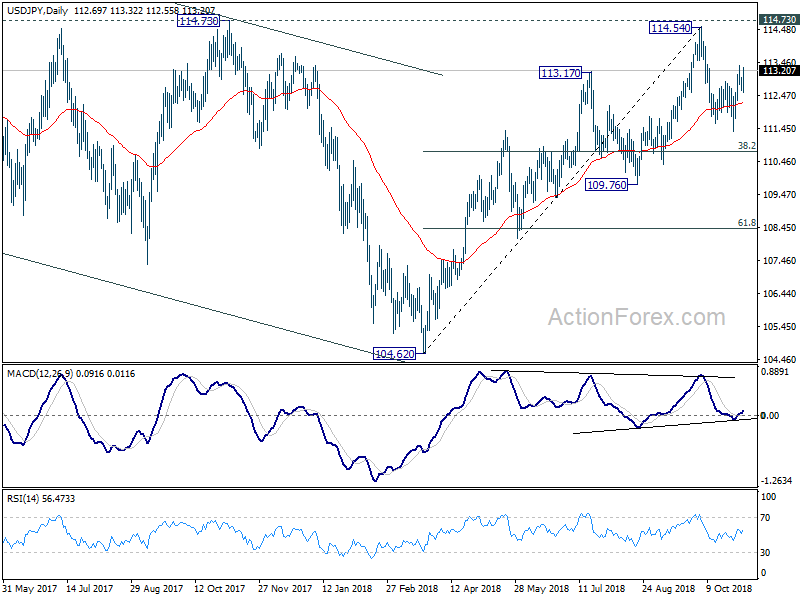
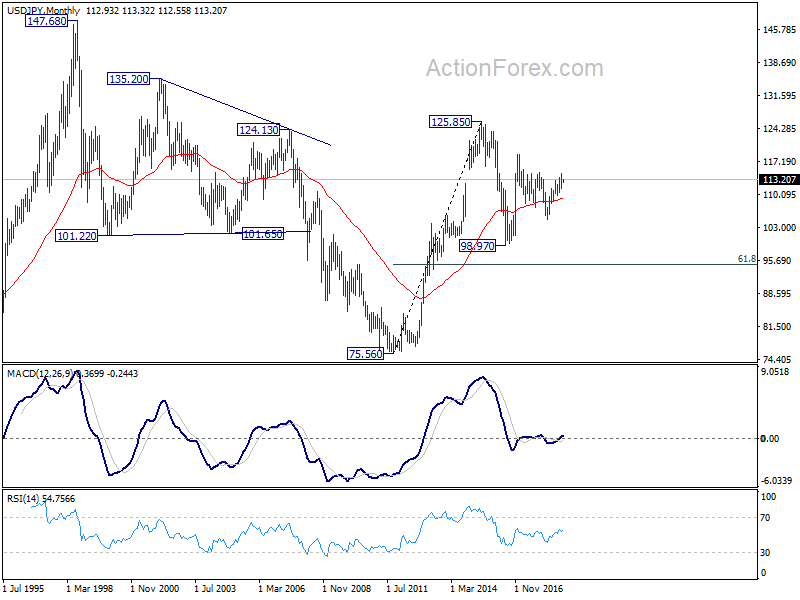
In the long term picture, the rise from 75.56 (2011 low) long term bottom to 125.85 top is viewed as an impulsive move, no change in this view. Price actions from 125.85 are seen as a corrective move which could still extend. In case of deeper fall, downside should be contained by 61.8% retracement of 75.56 to 125.85 at 94.77. Up trend from 75.56 is expected to resume at a later stage for above 135.20/147.68 resistance zone.
GBP/USD Weekly Outlook
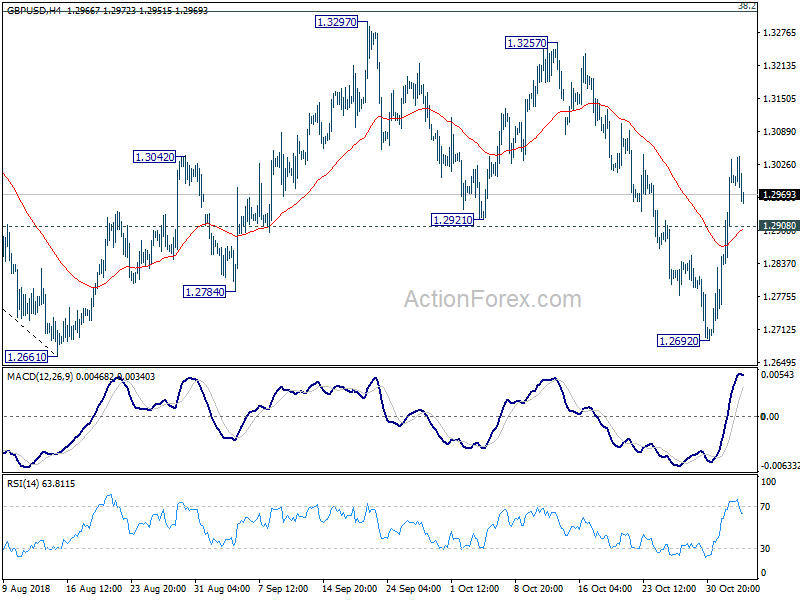
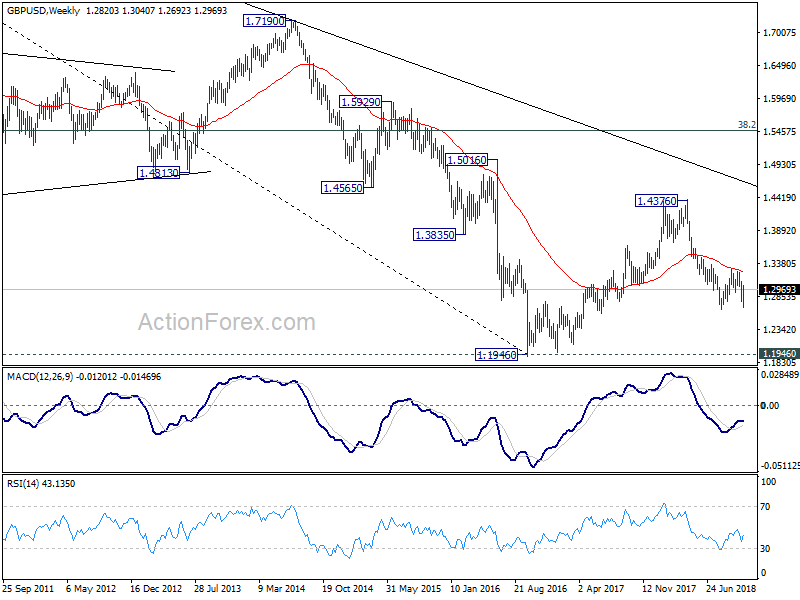
GBP/USD dipped to 1.2692 initially last week but rebounded strongly ahead of 1.2661 key support. The development suggests that fall from 1.3297 has completed and the consolidation pattern from 1.2661 is extending with another rising leg. Further rise is expected this week as long as 1.2908 minor support holds. Rise from 1.2692 should target 1.3297 resistance Nonetheless, we'd expect strong resistance from 1.3316 fibonacci level to limit upside to bring down trend resumption eventually. On the downside, below 1.2908 minor support will turn bias back to the downside for 1.2692 instead.
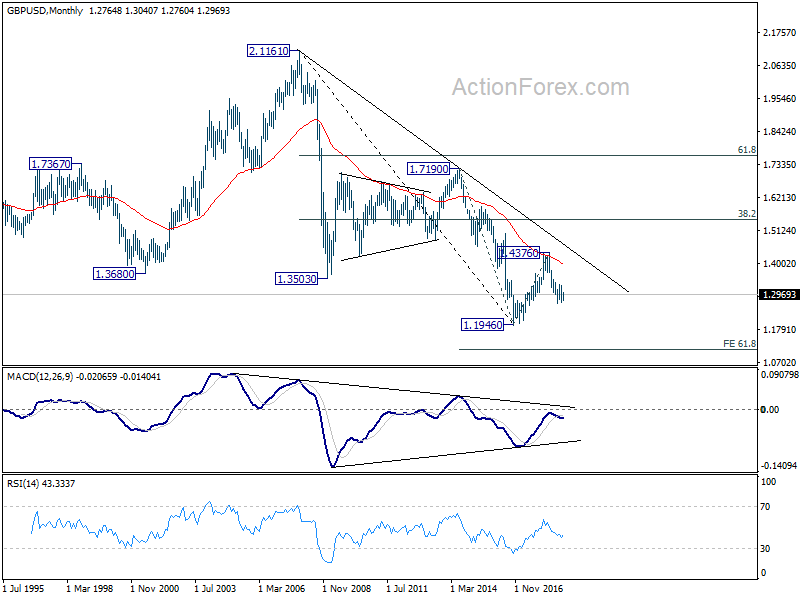
In the bigger picture, whole medium term rebound from 1.1946 (2016 low) should have completed at 1.4376 already, after rejection from 55 month EMA. The structure and momentum of the fall from 1.4376 argues that it's resuming long term down trend. And this will be the preferred case as long as 38.2% retracement of 1.4376 to 1.2661 at 1.3316 holds. However, firm break of 1.3316 would bring stronger rebound to 61.8% retracement at 1.3721. And, the eventual depth of the fall from 1.4376, and the chance of hitting 1.1946 low, will depend on the strength of the interim corrective rebound from 1.2661.
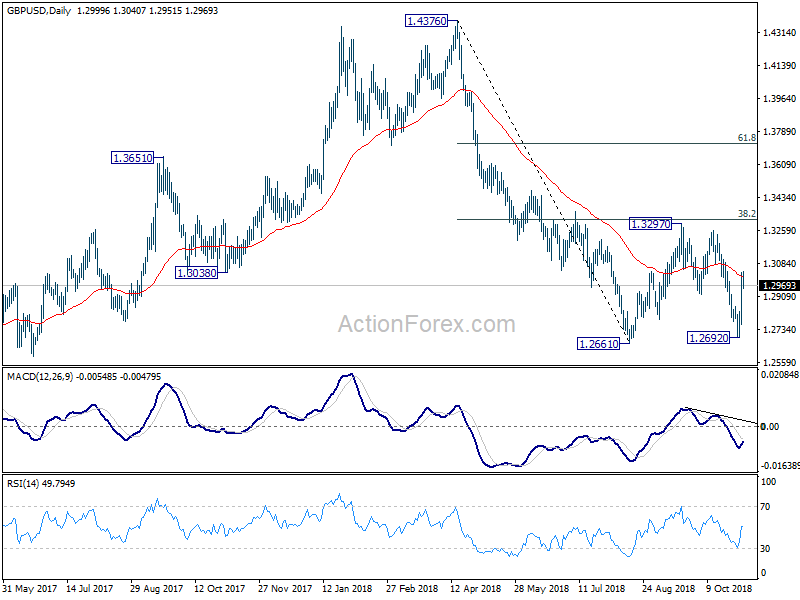
In the longer term picture, outlook in GBP/USD is held bearish. Rebound from 1.1946 was rejected solidly by falling 55 month EMA. The pair was limited well below 38.2% retracement of 2.1161 (2007 high) to 1.1946, as well as the decade long falling trend line. On break of 1.1946, next target will be 61.8% projection of 1.7190 to 1.1946 from 1.4376 at 1.1135.
USD/CHF Weekly Outlook
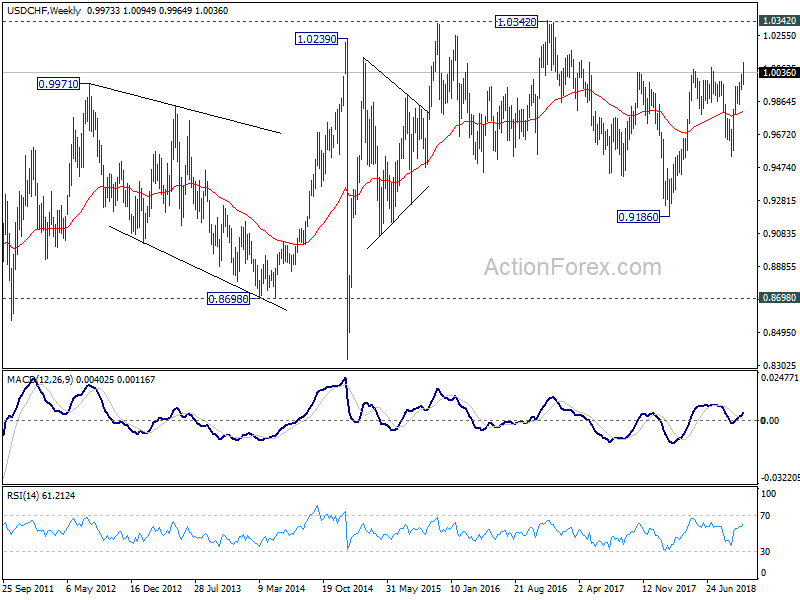
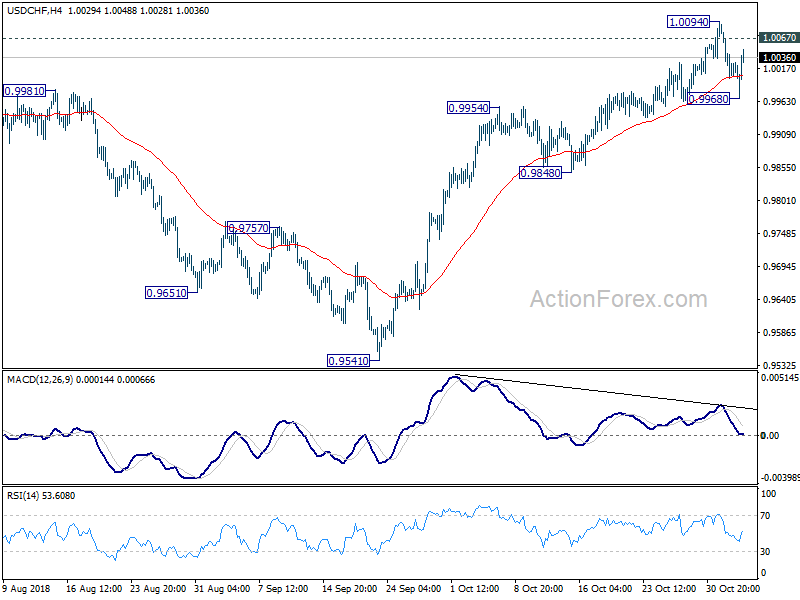
USD/CHF edged higher to 1.0094 but failed to sustain above 1.0067 key resistance and retreated. Nonetheless, with a temporary low formed at 0.9968, initial bias is neutral this week first. A short term top is possibly in place considering bearish divergence condition in 4 hour MACD. On the downside, below 0.9968 will extend the decline from 1.0094 into 0.9848/9954 support zone. On the upside, though, break of 1.0094 and sustained trading above 1.0067 will confirm resumption of larger rise from 0.9186 and should target 1.0342 key resistance next.
In the bigger picture, the pullback from 1.0067 has completed at 0.9541 already. And rise from 0.9186 is likely resuming. Firm break of 1.0067 will pave the way to retest 1.0342 key resistance. We'd be cautious on strong resistance from there to limit upside to bring another medium term fall to extend long term range trading. However, firm break of 0.9848 near term resistance will dampen this view and bring deeper decline back to 0.9541 support and possibly below.
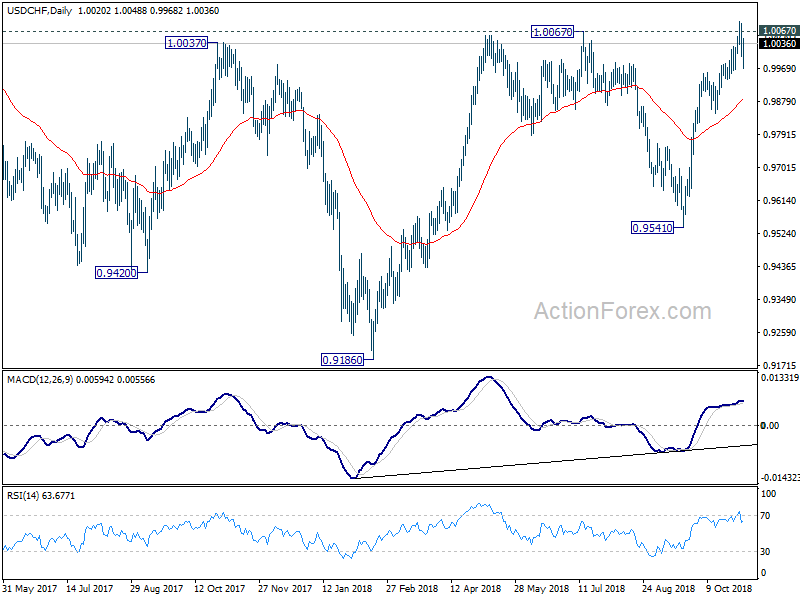
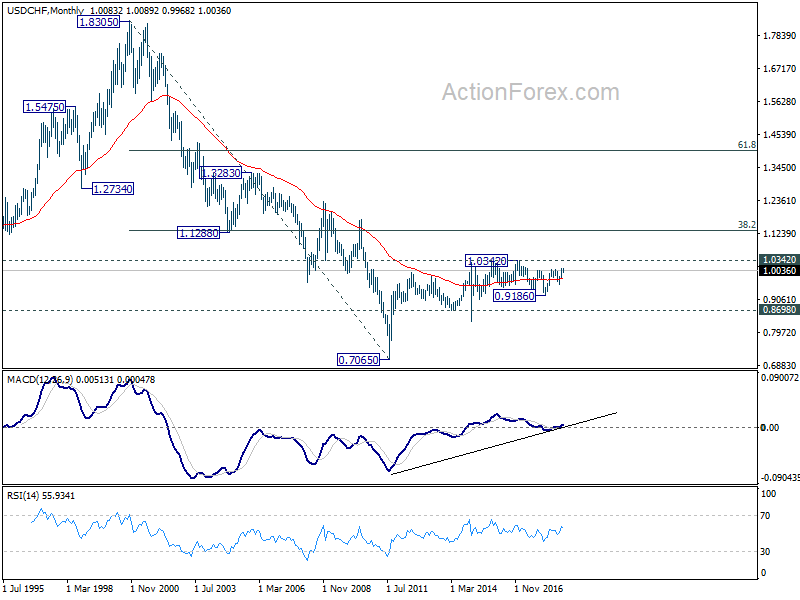
In the long term picture, price actions from 0.7065 (2011 low) are not clearly impulsive yet. Thus, we'll treat it as developing into a corrective pattern, at least, until a firm break of 1.0342 resistance.