

Sample Category Title
EURUSD Still Bearish Below 1.1431 Level
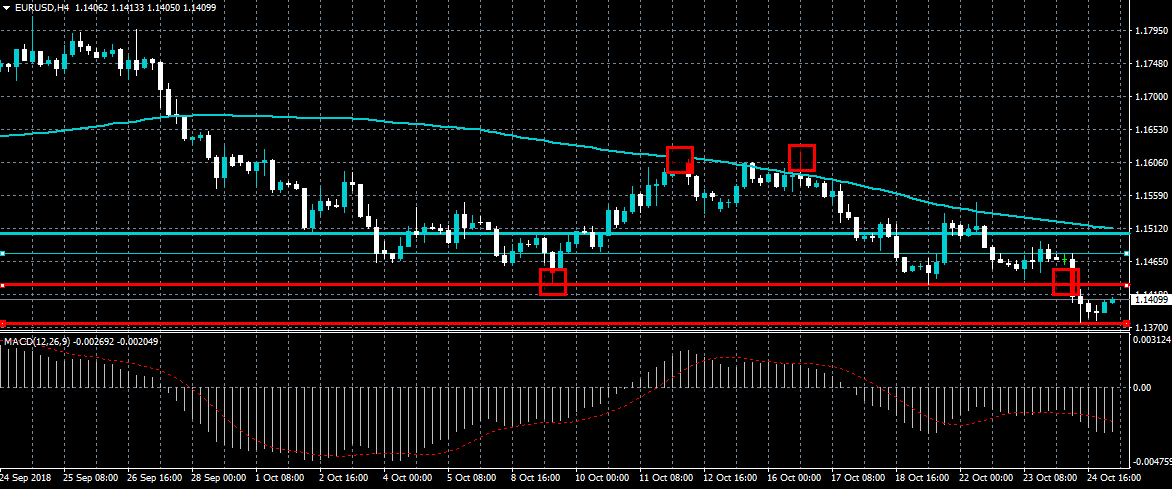
The euro is holding around the 1.1400 level against the US dollar in early Thursday trade after finding interim technical support from the 1.1380 level. The EURUSD pair retains an intraday bearish bias while trading below the 1.1431 resistance level. Price still trades below the neckline of a bearish head and shoulders pattern, ahead of the release of key IFO data from the German economy.
The EURUSD pair is strongly bearish while trading below the 1.1431 level, key technical support is found at the 1.1380 and 1.1300 levels.
If the EURUSD pair moves above the 1.1431 level, key intraday resistance is found at the 1.1465 and 1.1510 levels.
Crytocurrencies Little Moved In Low Volume Trading
This week, the volume of cryptocurrency trading has declined sharply. On CoinMarketCap, the average daily transaction amount for Bitcoin was around $3.5 billion. This is the lowest it has been in months. As a result, the price of Bitcoin and other major currencies has largely been unchanged.
Low volume trading comes despite signs that the SEC could accept the ETF proposal from VanEck based on a number of key factors. Firstly, VanEck is a credible organization and one of the biggest providers of ETFs. Secondly, the ETF will be listed at CBOE, which is a major and well-regulated exchange. Thirdly, the ETF will not directly target retail customers. At a listing price of $200,000, VanEck will target well-moneyed institutional investors. Moreover, concerns of price manipulation are being mitigated by the exchanges and authorities.
A few weeks ago, the price of XRP, the native currency of the Ripple blockchain protocol jumped after the New York Department of Financial Services (NYDFS) granted Coinbase approval to create the Coinbase Custody Trust Company LLC. This was big for Ripple because before that, Coinbase did not offer Ripple trading.
Ripple is a different cryptocurrency from Bitcoin and Ethereum. This is because Ripple is built to solve the money transfer or remittance problem. Using it, money transfer companies like MoneyGram and Western Union can simplify how they send money across the world. This is mostly important for large companies that spend a lot of money in remittances.
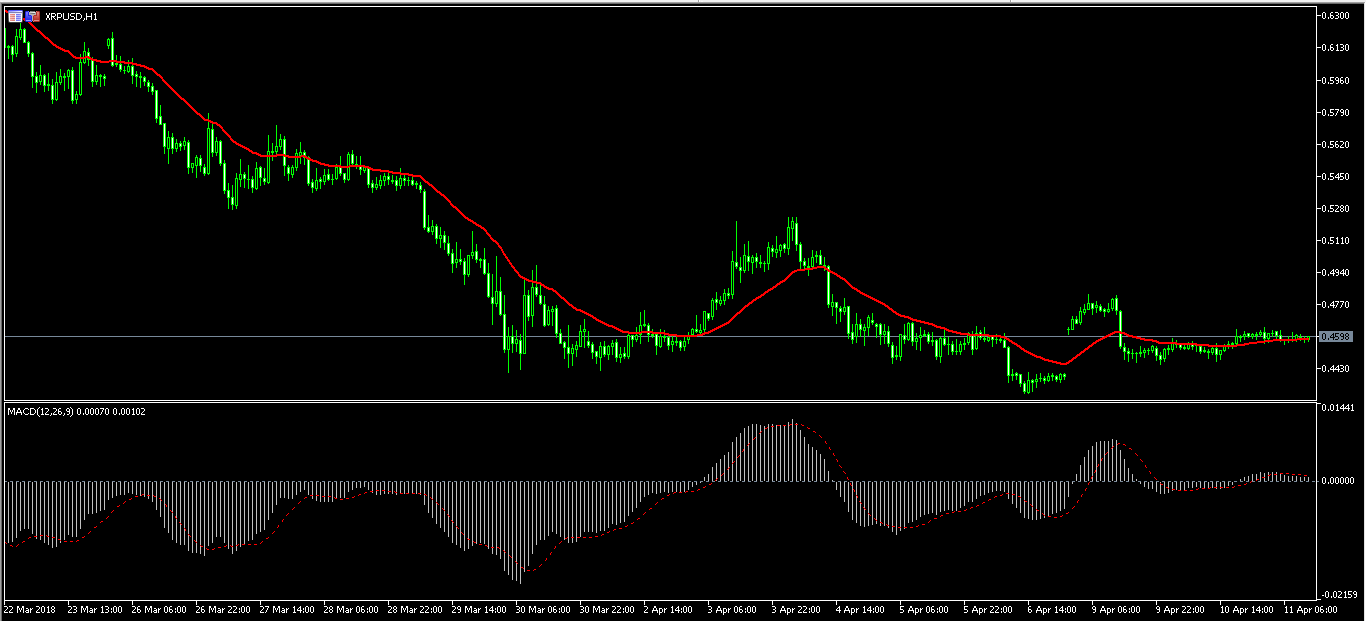
The XRP price reached a high of 0.4828 two weeks ago. Since then, it has moved sideways as traders wait for an upward or downward catalyst. At this time, the XRP/USD pair will likely continue moving sideways with a breakout expected at either direction.
EUR/AUD Daily Outlook
Daily Pivots: (S1) 1.6056; (P) 1.6131; (R1) 1.6207; More....
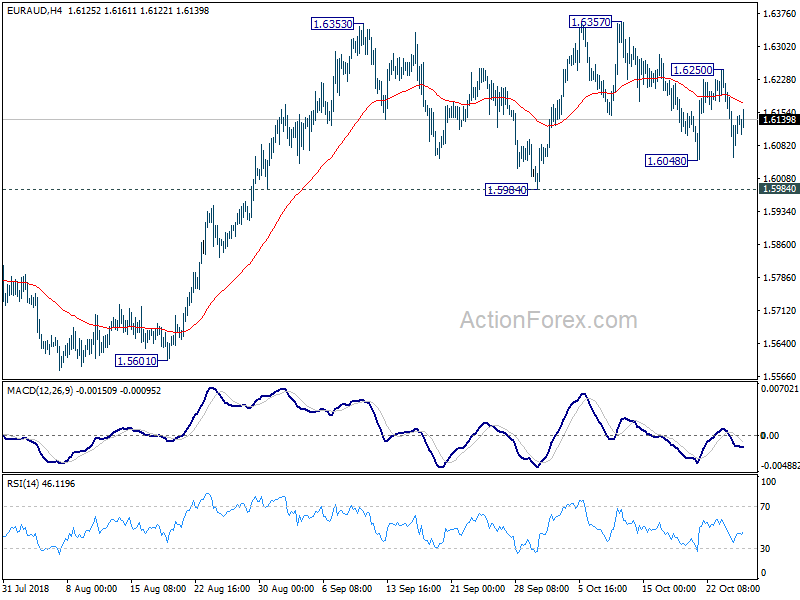
Intraday bias in EUR/AUD remains neutral for the moment. Recent sideway trading might extend further. But after all, as long as 1.5984 support holds, further rise is expected. On the upside, break of 1.6357 will resume larger up trend to 1.6587 key resistance next. However, break of 1.5984 will be an early sign of trend reversal and turn outlook bearish.
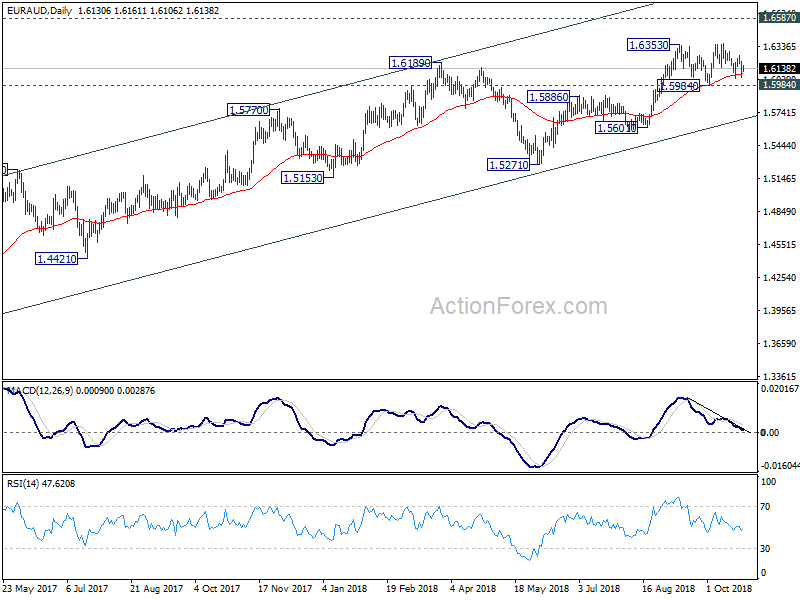
In the bigger picture, up trend from 1.3624 (2017 low) is still in progress. Further rise should be seen to retest 1.6587 (2015 high). Decisive break there will resume the long term rally and target 1.7488 fibonacci level. On the downside, break of 1.5984 support is need to be the first sign of medium term reversal. Otherwise, outlook will remain bullish in case of deep pull back. However, sustained break of 1.5984 will be an early sign of trend reversal.
Loonie Gains After BOC Points To More Rate Hikes
The Canadian dollar gained against the USD after the Bank of Canada (BOC) increased interest rates by a quarter of a percentage point. This was the fifth rate hike since last summer. The overnight rates are now at 1.75%, which is the highest level in ten years. In response to the hike, the four biggest Canadian banks raised their rates to consumers. These banks are TD, RBC, BMO, and CIBC. In the press release, the BOC said that:
CPI inflation dropped to 2.2 percent in September, in large part because the summer spike in airfares was reversed. Other temporary factors pushing up inflation, such as past increases in gasoline prices and minimum wages, should fade in early 2019. Inflation is then expected to remain close to the 2 percent target through the end of 2020. The Bank’s core measures of inflation all remain around 2 percent, consistent with an economy that is operating at capacity.
The euro rose slightly against the USD in the Asian session. This came as traders waited for the interest rates decision from the European Central Bank (ECB). The bank is expected to leave interest rates unchanged. Still, traders will be waiting for the statement, which will offer forward guidance. Most importantly, they will want to see whether the bank will give a clear guidance on its ‘through summer’ statement. In the past few statements, the bank has promised to start tightening ‘through summer’ which is vague. In recent weeks, the European economy has faced a number of challenges such as the controversial Italian budget proposal and Brexit.
The USD was slightly higher today against its peer currencies after the Fed released its Beige Book. This is a document where key Fed officials from the 12 districts talk about the economy and monetary policy. In the statement, the officials said that wages were growing at a modest rate. They also said that manufacturing was growing at a faster rate while labor shortages were reported in all the districts. Overall, the statement said that the US economy had continued to grow at a faster rate.
EURUSD
The EUR/USD was little moved in the Asian session. It is trading at 1.1410, which is slightly higher than yesterday’s low of 1.1380. On the 30-minute chart below, a bullish crossover between the 14-day EMA and the 28-day EMA is happening, an indication that the pair could see upward movements today. This is likely to happen after the ECB publishes its interest rates statement. However, the pair could also continue to move lower. If it does, it will test the important level of 1.1300.

USDCAD
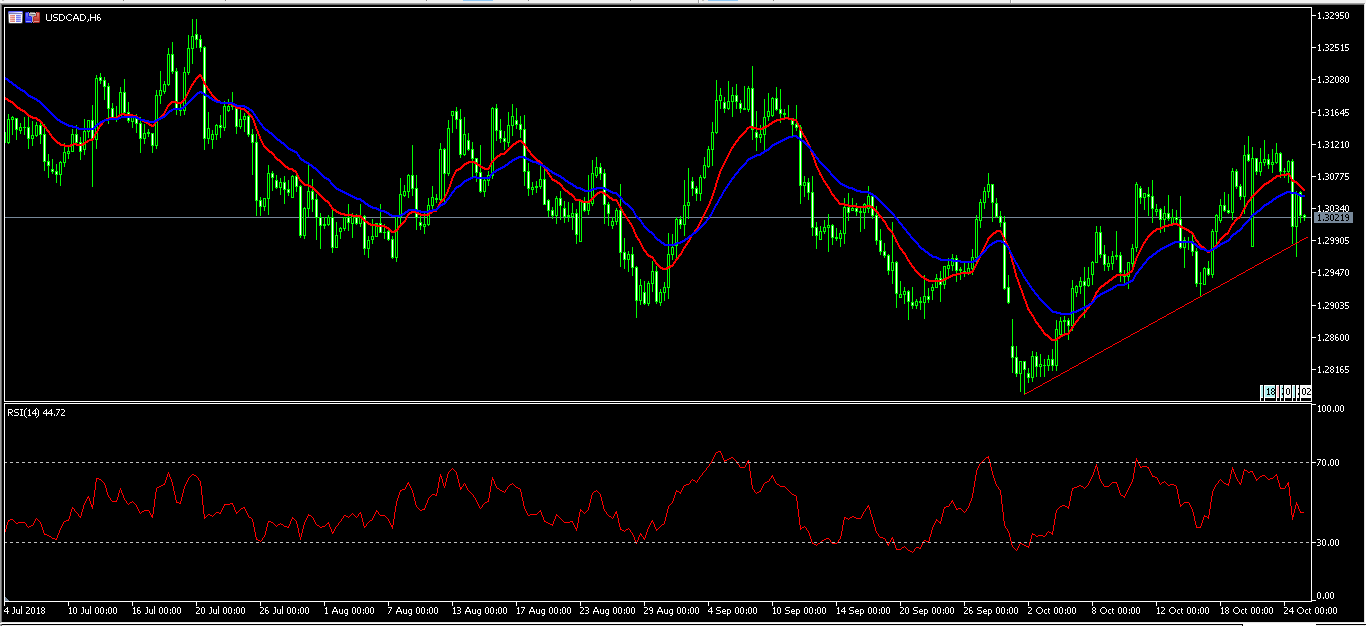
The USD/CAD fell yesterday after the statement from the BOC. The pair fell to an intraday low of 1.2963. This was the lowest level since Friday last week. In the Asian session, the pair moved slightly higher and is currently trading at 1.3020. Today, the pair is likely to consolidate within these levels as traders wait for the US GDP numbers tomorrow.
GBPUSD
The GBP/USD pair fell to an intraday low of 1.2868 in the Asian session. This is as traders continued their worries about Brexit and the slow pace of negotiations. On the six-hour chart below, the 28 and 14-day EMA show that a reversal on the pair will be unlikely. This is confirmed by the MACD and the ADX indicator. The ADX is currently at 28, an indication that the pair will likely decline further.

EUR/CHF Daily Outlook
Daily Pivots: (S1) 1.1341; (P) 1.1381; (R1) 1.1408; More...
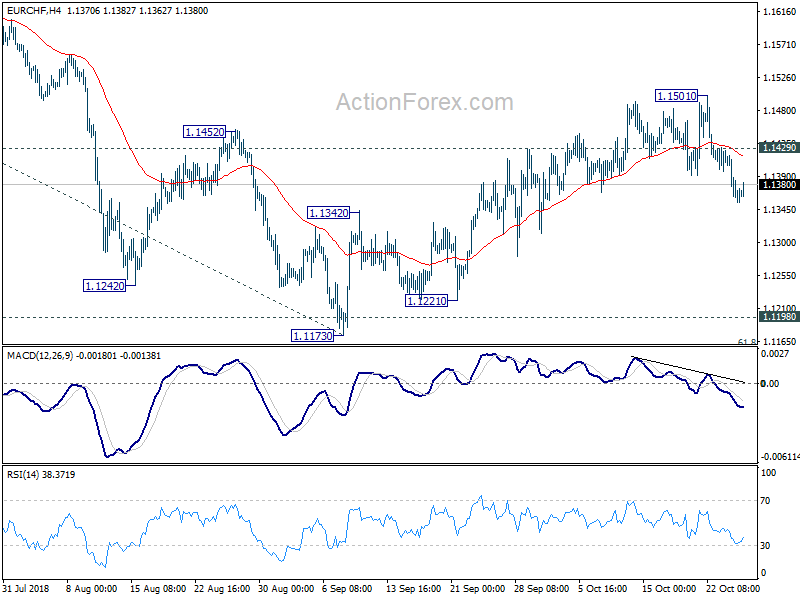
EUR/CHF's break of 1.1392 minor support argues that the corrective rise from 1.1173 has completed at 1.1501. Intraday bias is turned back to the downside. Deeper fall could be seen back to 1.1154/98 key support zone again. At this point, we'd still expect this key support zone to hold. On the upside, above 1.1429 minor resistance will turn focus back to 1.1501 first. But still, break there is needed to confirm rally resumption. Otherwise, risk will stay on the downside even in case of strong recovery.
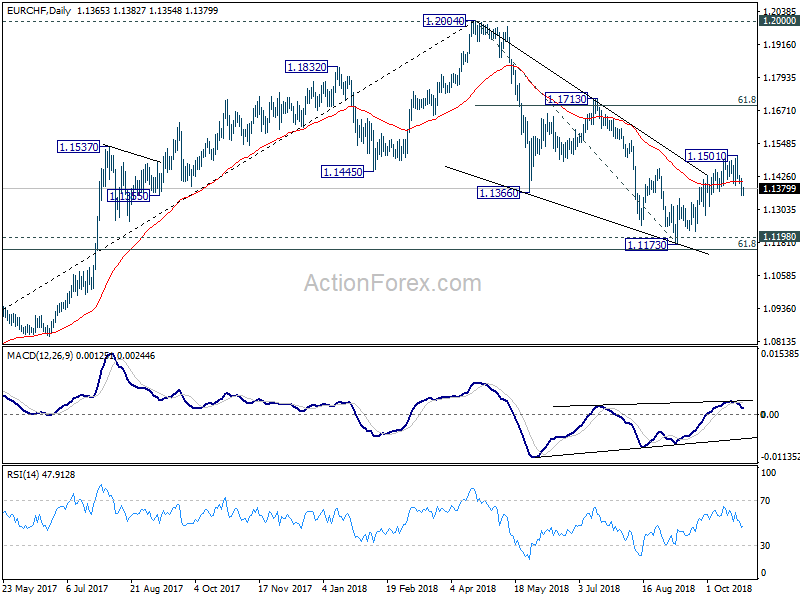
In the bigger picture, price actions from 1.2004 medium term top is seen as a correction only. Downside should be contained by support zone of 1.1198 (2016 high) and 61.8% retracement of 1.0629 to 1.2004 at 1.1154 to complete it and bring rebound. This cluster level is in proximity to long term channel support (now at 1.1234) too. A break of 1.2 key resistance is still expected in the medium term long term. However, sustained break of the mentioned support zone will mark reversal of the long term trend. In that case, 1.0629 key support will be back into focus.
USDJPY Touches Rising Trend Line, More Losses Are Expected
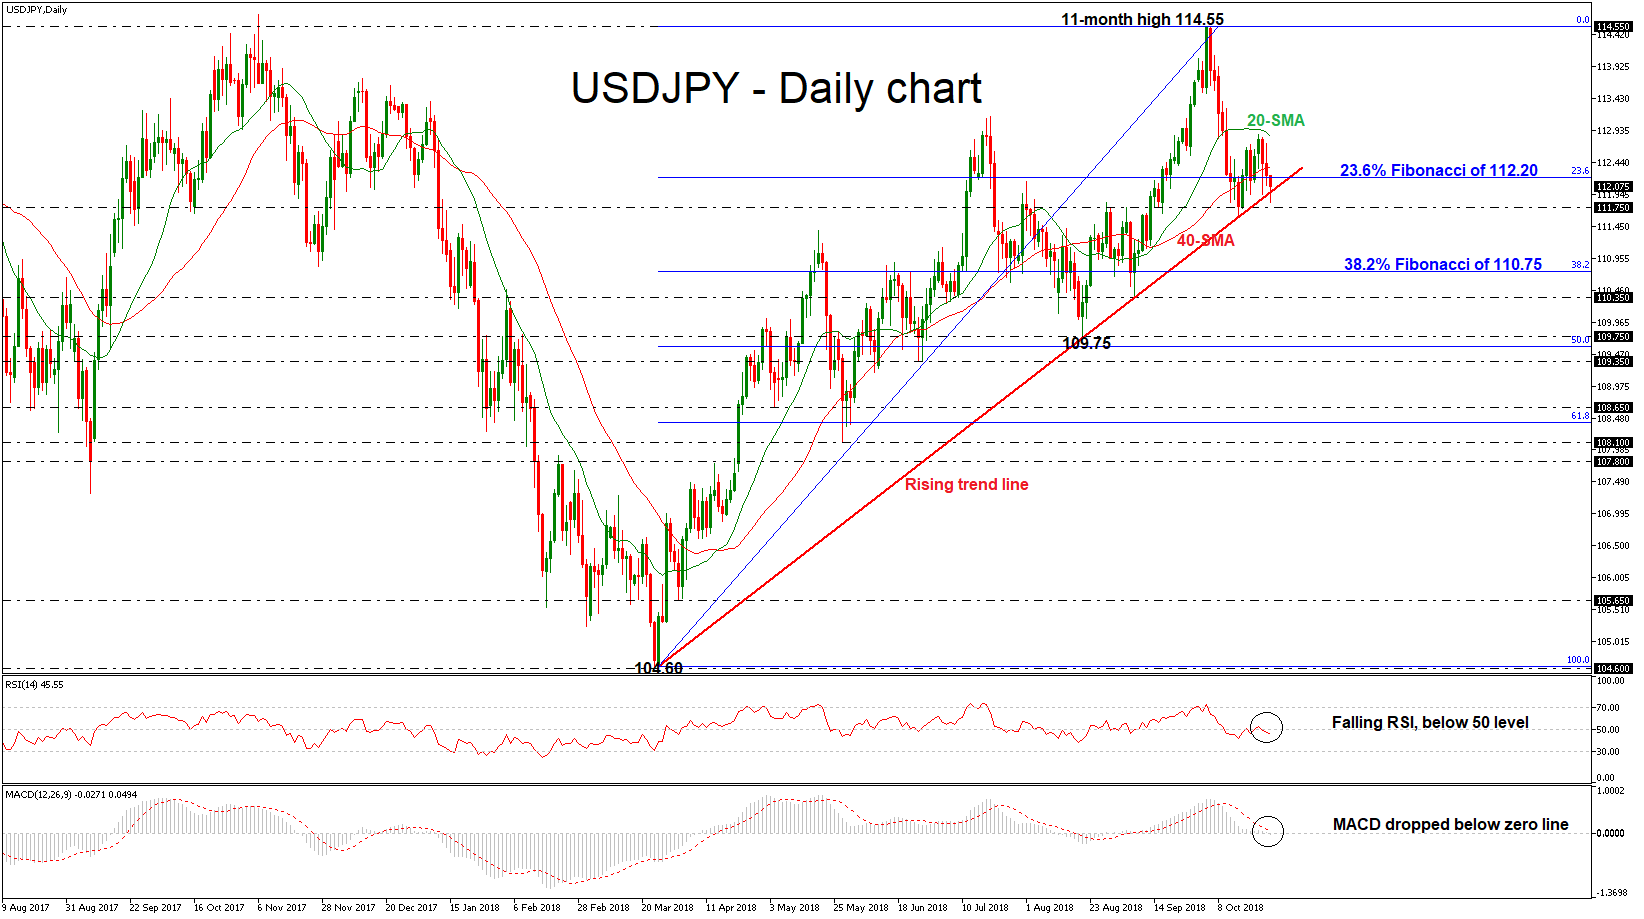
USDJPY has been edging sharply lower over the last couple of days, while today it slipped beneath the 23.6% Fibonacci retracement level of the upleg from 104.60 to 114.55, around 112.20. Additionally, the pair is trying to penetrate the medium-term ascending trend line to the downside, shifting the bullish outlook to a more neutral one.
The momentum indicators in the daily timeframe are supportive of this bearish picture. The RSI indicator is falling below the threshold of 50, while the MACD oscillator dropped slightly below the zero line as it also holds below the trigger line.
Should the price extend losses and successfully break the 111.75 barrier, this would open the way towards the 38.2% Fibonacci mark of 110.75. Even lower, immediate support is coming from the 110.35 hurdle, identified by the bottom on September 7, endorsing the neutral to bearish scenario.
On the upside, if the market manages to pick up speed and rebound on the diagonal line, the price could re-touch the 23.6% Fibonacci and the 40-day simple moving average (SMA). Above these obstacles the pair could re-challenge the 20-day SMA near 112.85 at the time of writing. Moreover, an aggressive rally higher, could extend gains and touch the 11-month high of 114.55.
In the medium-term, the outlook would change to a neutral to bearish one if there is a closing day below the uptrend line, which has been standing since March 26. Currently, in the very short-term timeframe, USDJPY posts a negative structure confirmed also by the SMAs.
EUR/USD Bearish Breakout Aims For 1.13 Bottom
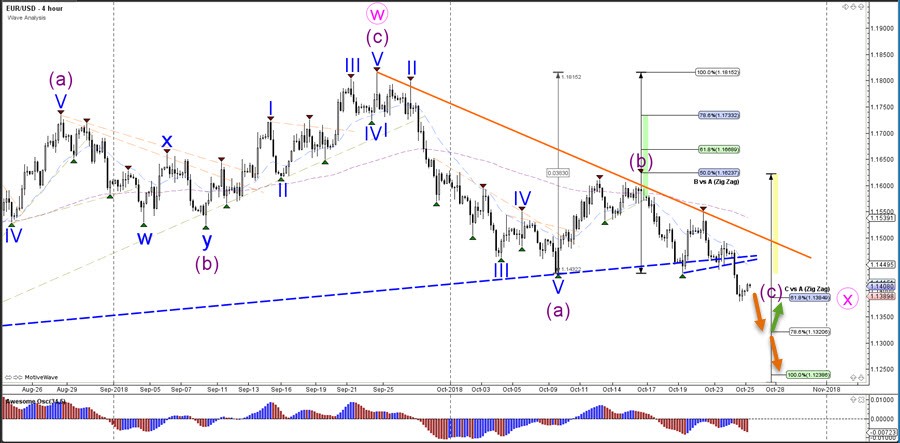
The EUR/USD broke below the key support trend lines (blue) and is building a lower low. The bearish breakout is either part of a wave C (purple) or could be an impulsive wave 3 if price manages to break below the critical bottom at 1.13.
The EUR/USD has reached the 61.8% Fibonacci level of wave C vs A. A continuation could take price to the next Fib target which is a bounce or break spot.
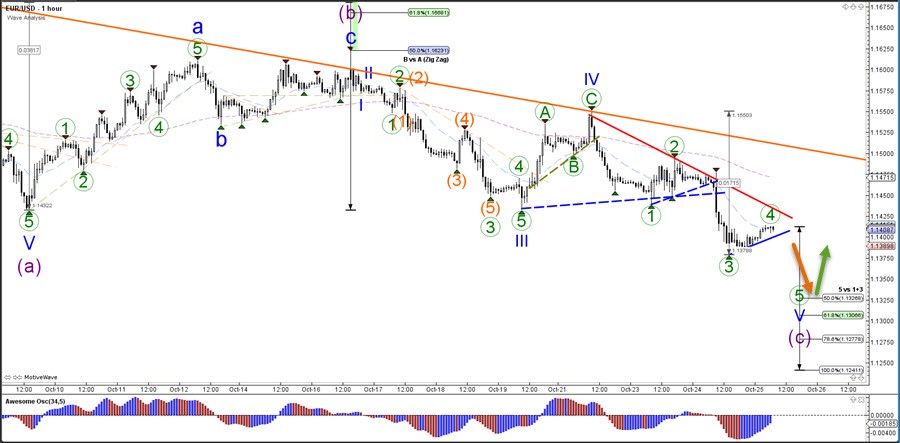
The EUR/USD bearish breakout could see price fall towards Fibonacci targets of wave 5 vs 3+1. At the moment it seems like price is building a wave 4 (green) correction, which would become invalidated if price breaks above the resistance trend line (red) and bottom of wave 1 (green).
Amazon Elliott Wave View: Favoring More Downside
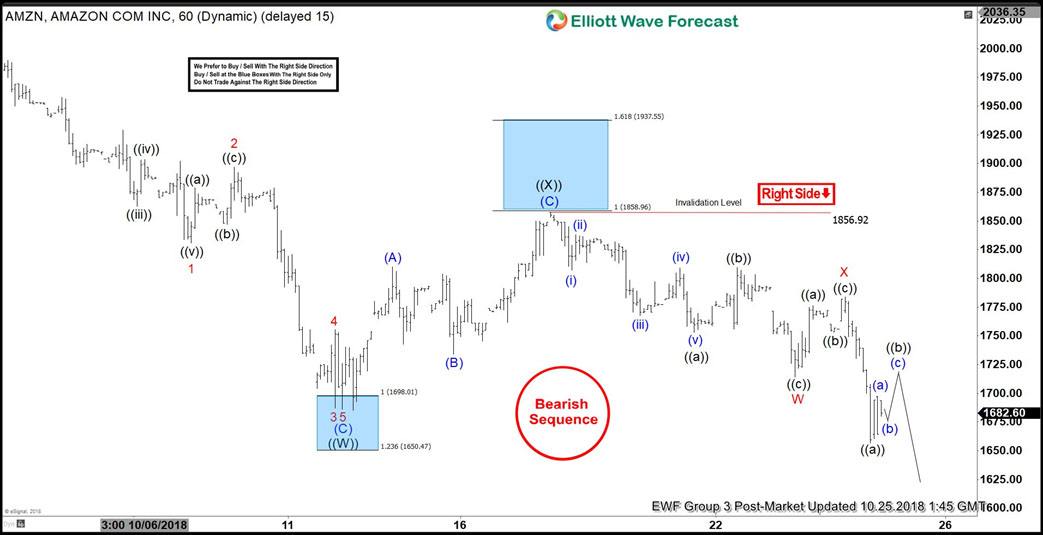
Amazon ticker symbol: $AMZN short-term Elliott wave view suggests that a decline to $1685.99 low ended primary wave ((W)). The internals of that decline unfolded as Elliott wave Flat structure. Up from there, a bounce to $1856.92 high ended primary wave ((X)) as Elliott wave zigzag correction. Where intermediate wave (A) ended in lesser degree 5 waves at $1809.88 high. A pullback to $1734.23 low in 3 swings ended intermediate wave (B). And finally, a push higher towards $1856.92 high ended intermediate wave (C) of ((X)) in another 5 waves.
Down from there, Amazon has made new lows already confirming the next extension lower in primary wave ((Y)), thus favoring more downside. The initial decline to $1714 low ended Minor wave W as a zigzag structure where Minute wave ((a)) ended in 5 waves at $1753. Minute wave ((b)) bounce ended at $1809.50 and Minute wave ((c)) of W ended at $1714 low. Then a 3 wave bounce to $1784 high ended Minor wave X. Near-term, while bounces fail below there and more importantly below $1856.92 expect stock to extend lower for more downside towards $1488.28-$1401.41 100%-123.6% Fibonacci extension area of primary wave ((W))-((X)) before upside renew or stock produces a 3 wave bounce at least. We don’t like buying it.
Amazon 1 Hour Elliott Wave Chart
Sea Of Red Across Global Equity Markets
October has been a terrible month for equity investors so far. The S&P 500 and Dow Jones Industrial Average fell into negative territory for the year after yesterday’s steep declines. The Nasdaq composite entered into a correction territory of ’more than 10% fall from the peak‘but remained 2.9% higher year-to-date. What seemed to be profit taking in the beginning of the month started looking like panic selling with the volatility index ’VIX‘ more than doubled this month.
The selloff in U.S. equities seems shocking given the robust earnings season. One-third of S&P 500 companies have announced their Q3 results, showing 25.4% Y-o-Y growth. This is more than double the historical average, but still, it’s not helping the bulls fight back.
Investors do not seem to be taking their decisions based on the present numbers, but they’re looking into the future. The forecast for next year’s earnings shows they areexpected to decelerate to half of this year’s rate, and analysts are likely to continue downgrading their expectations.
The Macro environment is not helping either. We have the Fed continuing to tighten monetary policy, Europe’s economy is clearly slowing down with yesterday’s composite flash PMI falling to a 25-month low, and lots of uncertainty in China, the U.K., and Italy. While the U.S. economy seems to be the only one firing on all cylinders, yesterday’s home sales data may indicate that we have reached the peak of the current economic cycle. New home sales in the U.S. fell to a two-year low in September as higher prices and mortgage rates began to hit demand. Last week also showed declines in new homebuilding permits while sales of existing homes fell to a near three-year low in September.
Given the current environment, it's hard to say when the drama in equity markets will be over. Investors are selling first and evaluating later. Currently, the risks remain to the downside as further selloffs will trigger margin calls leading to further drops.
In currency markets, the Yen is the best performing currency as demand for safety surged. Meanwhile, the Dollar declined slightly against the Euro and Sterling but remained at a near two-month high. The focus will shift to the European Central Bank’s monetary policy meeting scheduled for later today. The critical question ECB President Draghi needs to answer is how Italy’s political turbulence can be contained and whether the recent economic weakness in the EU will delay the tightening of monetary policy.
Will ECB Meeting Be More Eventful Than Expected?
Current environment complicates ECB normalisation plans
The ECB meeting on Thursday was meant to be quite straightforward but in the current world of populism, trade wars and Brexit, this may be too much to ask.
A few months back when the ECB took the surprising step of not only laying down plans for the end of its quantitative easing program, but also offering guidance on the timing of its first rate hike – which could be the only increase of Mario Draghi's tenure if it comes before October 2019 – it looked as though the central banks exit from unconventional stimulus was going to be relatively straight forward.
After a decade of monetary policy experimentation - which was necessary to save the block initially from the worst financial crisis of our lifetime and then its possible collapse – the ECB appeared back in control, but with a number of risks suddenly surfacing, it may be more complicated than anticipated.
Financial markets have been rather temperamental this year – to put it gently – and that has gradually spread as it has progressed from emerging markets, including China, to Europe in the summer and now the US.
The market has been ticking along while underlying threats have been building – many, self-inflicted – be they trade conflicts, rising US interest rates, emerging markets, Brexit and Italy's budget, to name but a few. While I'm by no means proclaiming we're heading into a crisis, unstable markets and slowing global growth are a concern and certainly make the job of central banks a little tricky.
I don't expect the ECB to change course on Thursday and suddenly decide to extend QE, especially not as a means of shielding Italy which has seen the yield on its debt surge over the last six months on the expectations of a budget showdown with Brussels. In fact, I believe this would encourage it to maintain its course and pressure the coalition government into falling in line with euro area rules.
But that doesn't mean it won't be aware of the risks which is why investors will be paying extremely close attention to the statements that accompany the decision and the Q&A session that follows with Draghi.
Draghi has a tendency to err on the dovish side and may do so once again tomorrow, given the increasing headwinds. But with Rome set to go head to head with Brussels, following the latter's unprecedented move to reject the former's draft budget, perhaps he'll refrain from such action on this occasion and adopt a more neutral position.