Sample Category Title
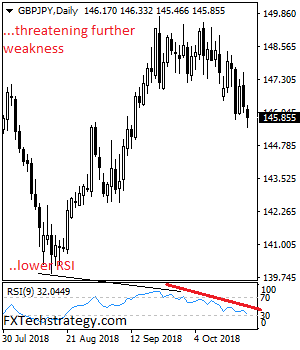
GBPJPY Bear Pressure Targets 145.01 Support Zone
GBPJPY bear pressure targets 45.01 support zone as it looks for further price extension. On the downside, support comes in at the 144.50 level where a violation will aim at the 144.00 level. A break below here will target the 143.50 level followed by the 143.00 level. Its daily RSI is bearish and pointing lower suggesting further weakness. On the upside, resistance comes in at the 146.50 level followed by the 147.00 level. A break through that level will set the stage for a move further higher towards the 147.50 level. Further out, resistance resides at the 148.00 level. All in all, GBPJPY faces further downside pressure in the short term.
The Analytical Overview Of The Main Currency Pairs
The EUR/USD currency pair
Technical indicators of the currency pair:
Prev Open: 1.15163
Open: 1.14638
% chg. over the last day: -0.40
Day's range: 1.14392 – 1.14687
52 wk range: 1.1299 – 1.2557
Yesterday, the bearish sentiment prevailed on the EUR/USD currency pair. The euro is under pressure due to uncertainty over the Italian budget. Drop in quotes exceeded 60 points. Trading instrument has updated local lows. At the moment, the euro is consolidating in the range of 1.14500-1.14750. The EUR/USD quotes have the potential for further decline.
Today, the news feed is calm.
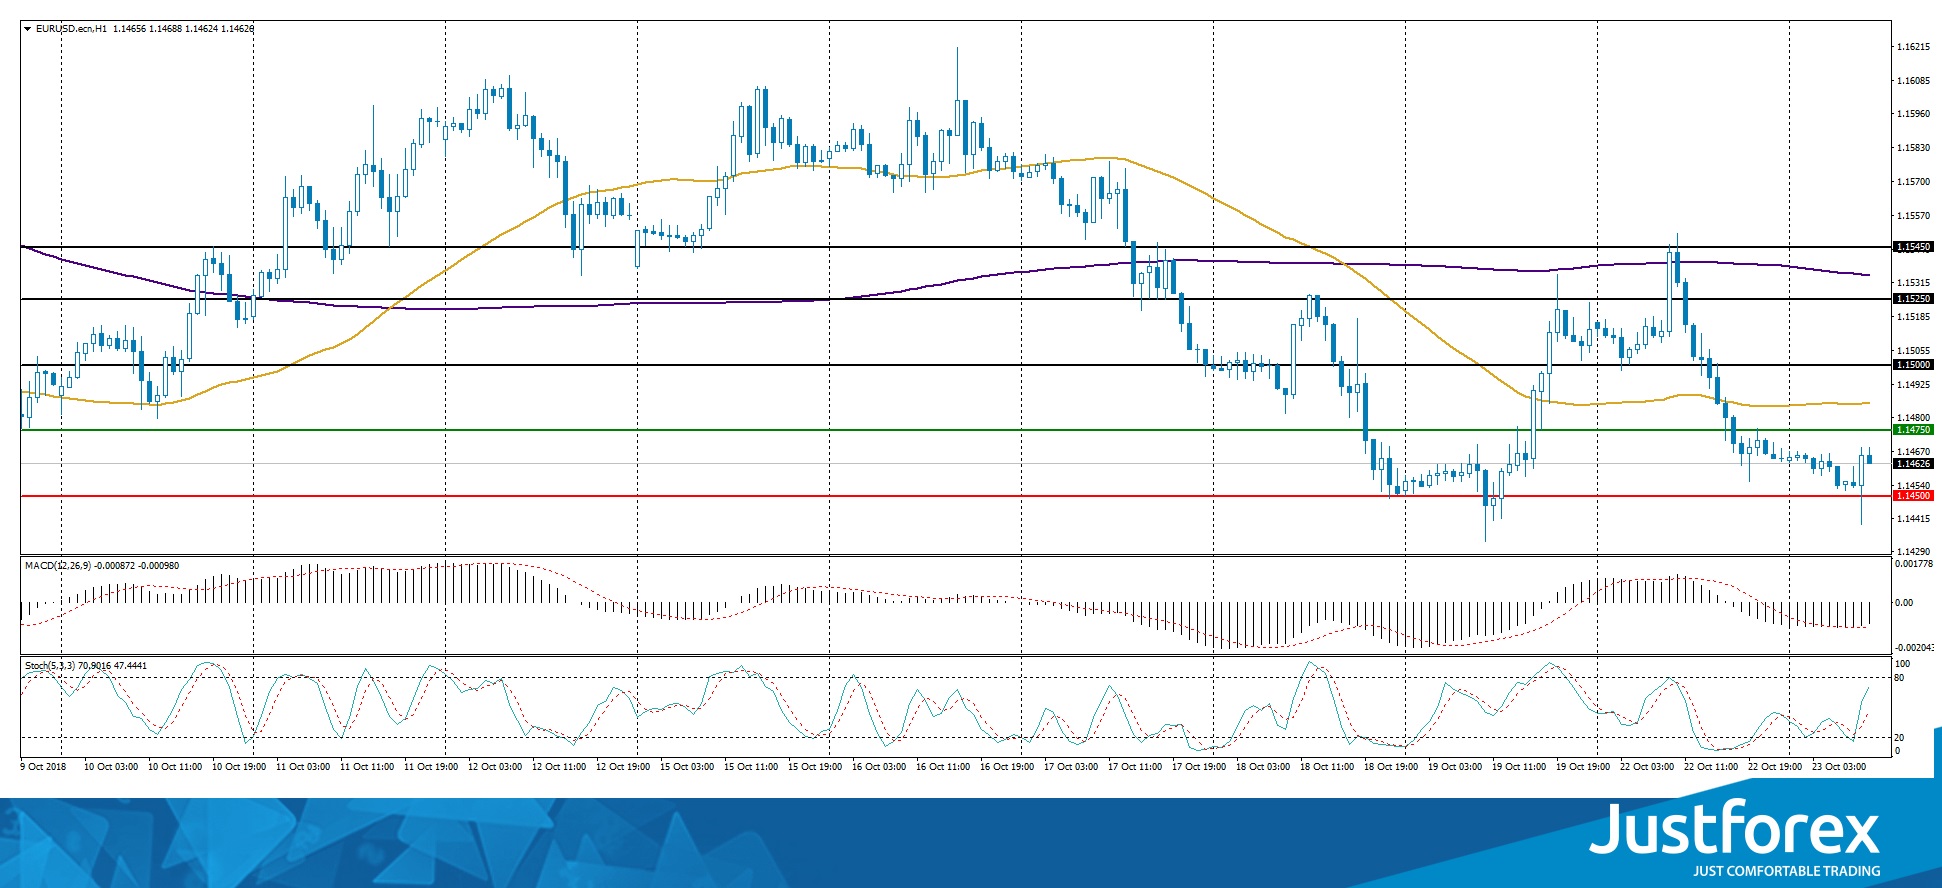
The price has fixed below 50 MA and 200 MA, which indicates the power of sellers.
The MACD histogram is in the negative zone, but above the signal line, which gives a weak signal to sell EUR/USD.
Stochastic Oscillator is in the neutral zone, the %K line is above the %D line, which indicates the EUR/USD quotes growth.
Trading recommendations
Support levels: 1.14500, 1.14000
Resistance levels: 1.14750, 1.15000, 1.15250
If the price fixes below the local support level of 1.14500, a further fall in the EUR/USD quotes is expected. The movement is tending to the round level of 1.14000.
Alternative option. If the price fixes above the 1.14750 mark, it is necessary to look for entry points to the market to open long positions. The movement is tending to 1.15000-1.15250.
The GBP/USD currency pair
Technical indicators of the currency pair:
Prev Open: 1.30660
Open: 1.29567
% chg. over the last day: -0.77
Day's range: 1.29369 – 1.29763
52 wk range: 1.2662 – 1.4378
The GBP/USD currency pair continues to show negative dynamics. During yesterday's trading session, the pound weakened against the US dollar by more than 100 points. The UK currency is under pressure due to uncertainty over the Brexit issue. At the moment, the GBP/USD quotes are in a sideways trend. The key range is 1.29500-1.29900. Trading instrument has the potential for further decline.
We recommend paying attention to the speech by the Bank of England governor Carney.
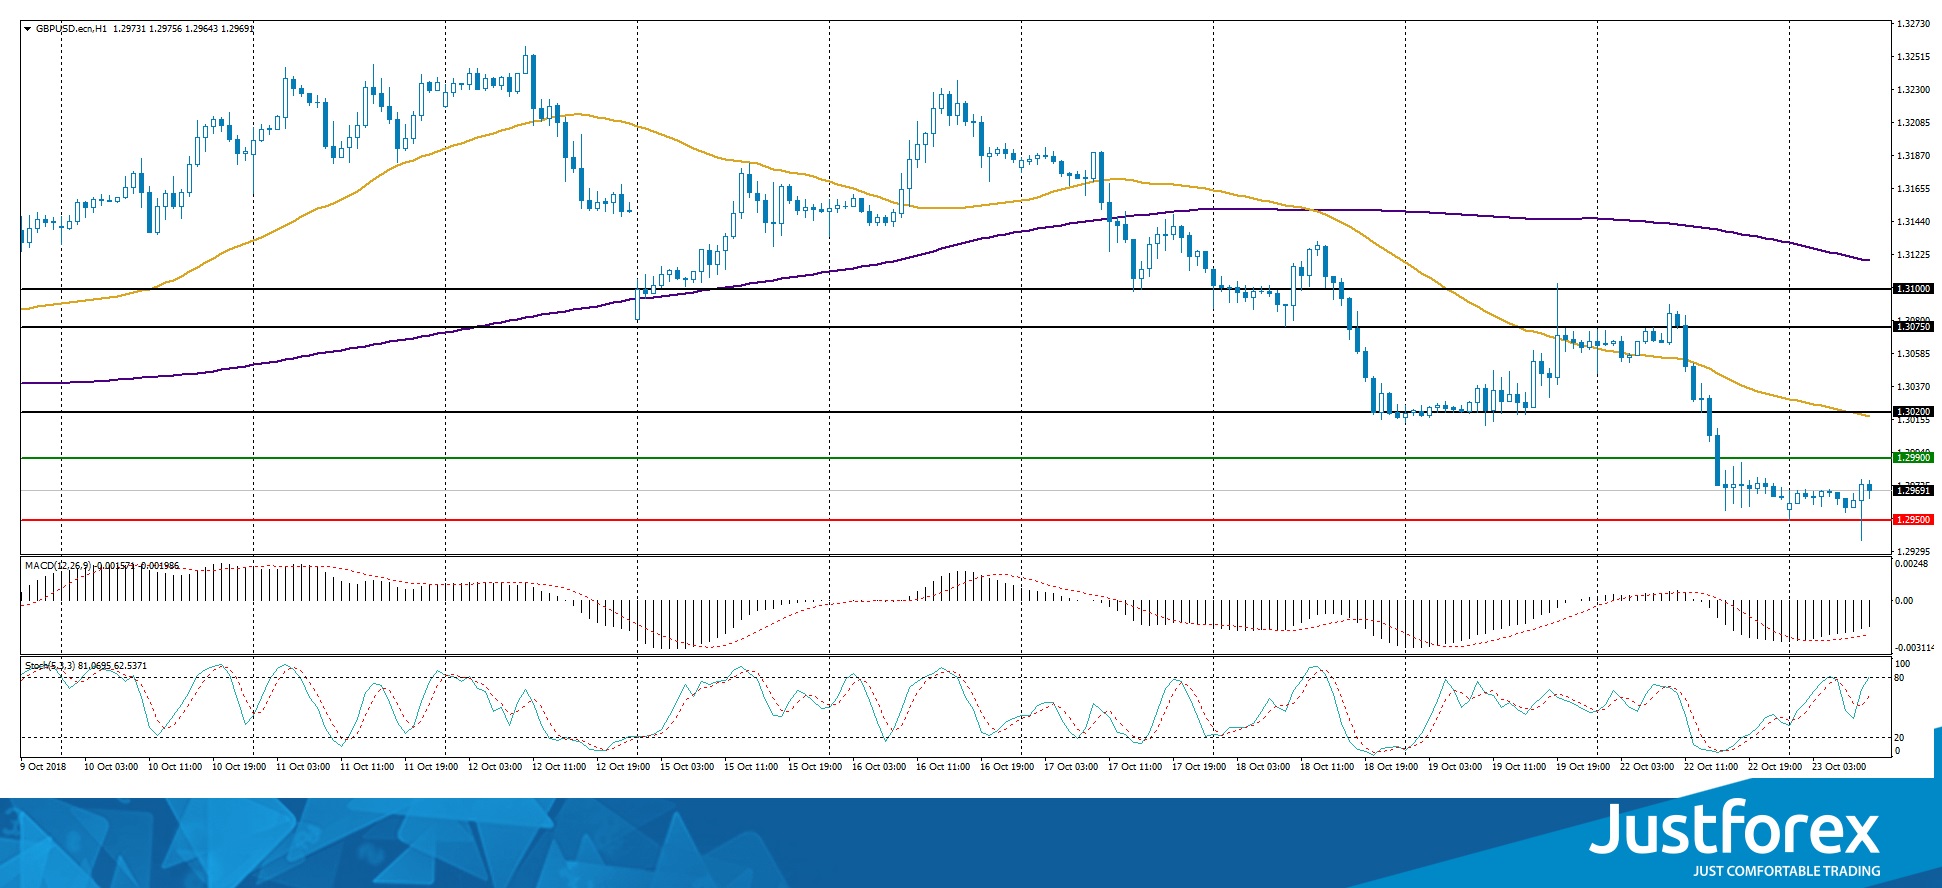
The price has fixed below 50 MA and 200 MA, which indicates the power of sellers.
The MACD histogram is in the negative zone, but above the signal line, which gives a weak signal to sell GBP/USD.
Stochastic Oscillator is in the neutral zone, the %K line is above the %D line, which indicates the GBP/USD quotes growth.
Trading recommendations
Support levels: 1.29500, 1.29000
Resistance levels: 1.29900, 1.30200, 1.30750
If the price fixes below the support level of 1.29500, a further fall in the GBP/USD currency pair is expected. The movement is tending to the round level of 1.29000.
Alternative option. If the price fixes above the level of 1.29900, it is necessary to consider purchases of GBP/USD. The movement is tending to 1.30200-1.30400.
The USD/CAD currency pair
Technical indicators of the currency pair:
Prev Open: 1.30894
Open: 1.30963
% chg. over the last day: -0.04
Day's range: 1.30877 – 1.31145
52 wk range: 1.2248 – 1.3387
Since the beginning of this week, the USD/CAD currency pair has being traded in a flat. Unidirectional trend is not observed. The USD/CAD quotes are testing local support and resistance levels: 1.30800 and 1.31200, respectively. In the near future technical correction is not excluded. Investors took a wait-and-see attitude before the Bank of Canada meeting.
Today, the news feed on the economy of Canada is calm.
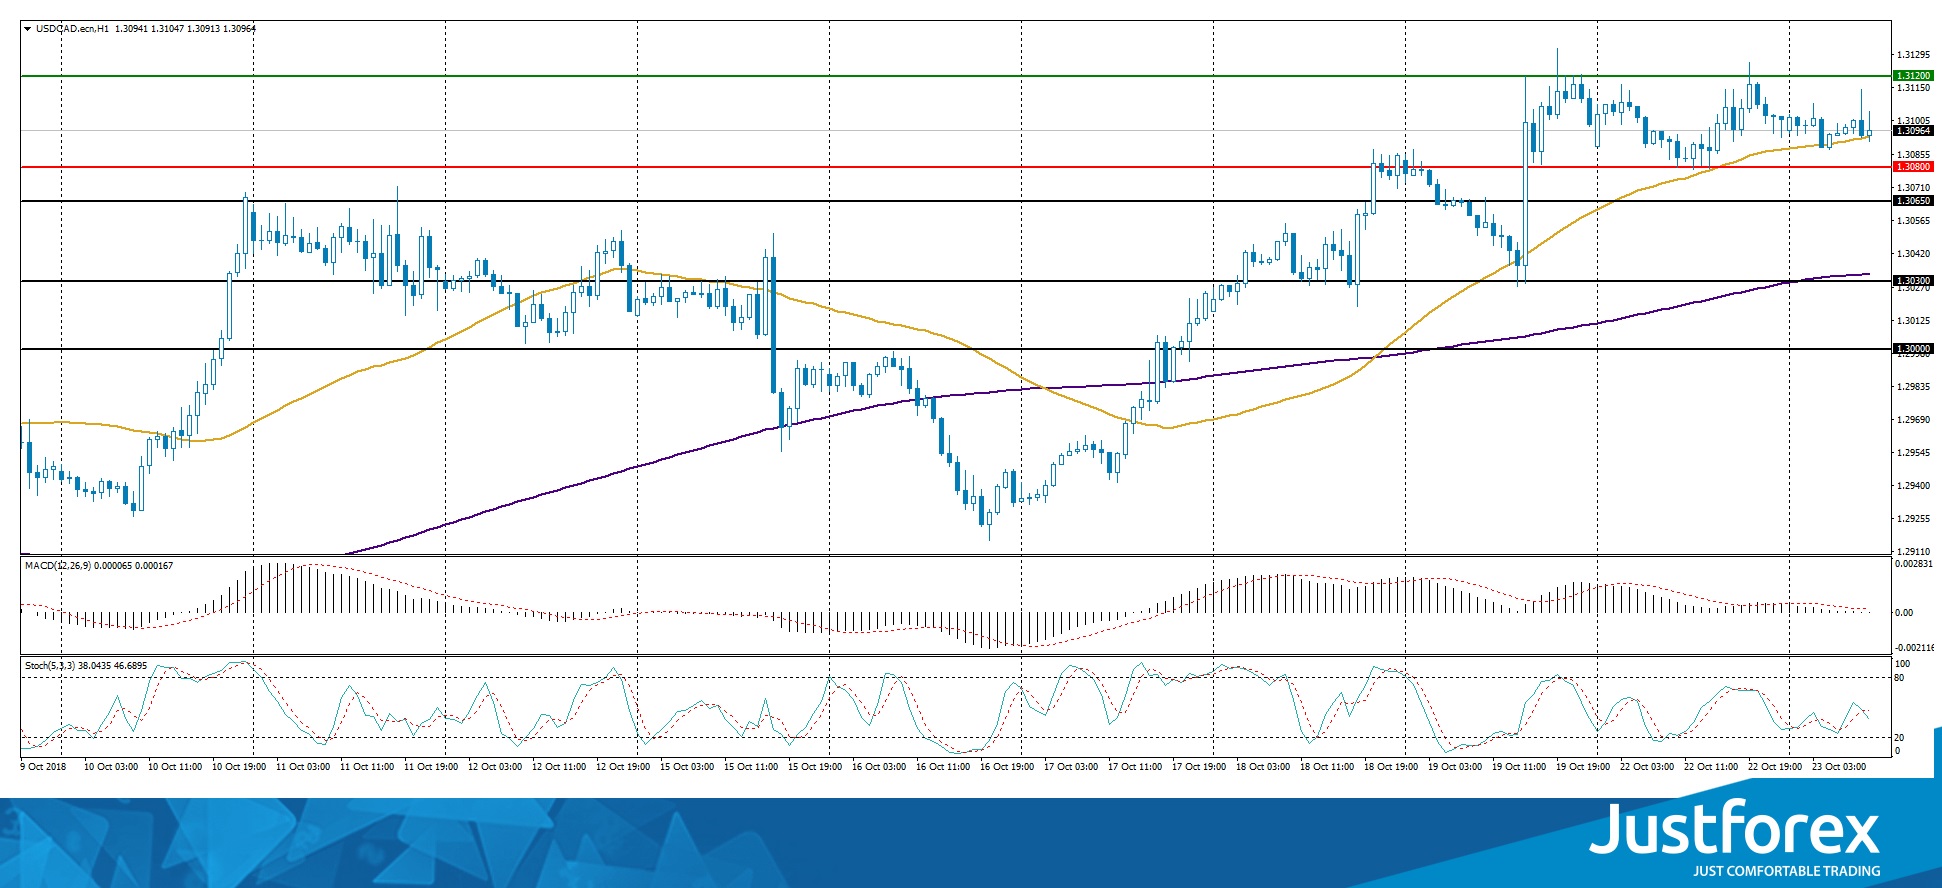
Indicators do not send accurate signals. The price is testing 50 MA, which acts as dynamic support.
The MACD histogram is near the 0 mark.
Stochastic Oscillator is in the neutral zone, the %K line has crossed the %D line. There are no signals at the moment.
Trading recommendations
Support levels: 1.30800, 1.30300, 1.30000
Resistance levels: 1.31200, 1.31500
If the price fixes above the resistance level of 1.31200, the USD/CAD currency pair growth is expected. The movement is tending to 1.31500-1.31700.
Alternative option. If the price fixes below 1.30800, a correctional movement is expected. The target level for profit taking is 1.30400-1.30200.
The USD/JPY currency pair
Technical indicators of the currency pair:
Prev Open: 112.804
Open: 112.364
% chg. over the last day: +0.26
Day's range: 112.306 – 112.840
52 wk range: 104.56 – 114.74
The USD/JPY currency pair has been declining. During the Asian trading session, the drop in prices was almost 50 points. At the moment, the “safe haven” currency is testing the mirror support level of 112.350. The local resistance is the 112.650 mark. Positions should be opened from these marks. We recommend paying attention to the US government bonds yield.
The news feed on the economy of Japan is calm.
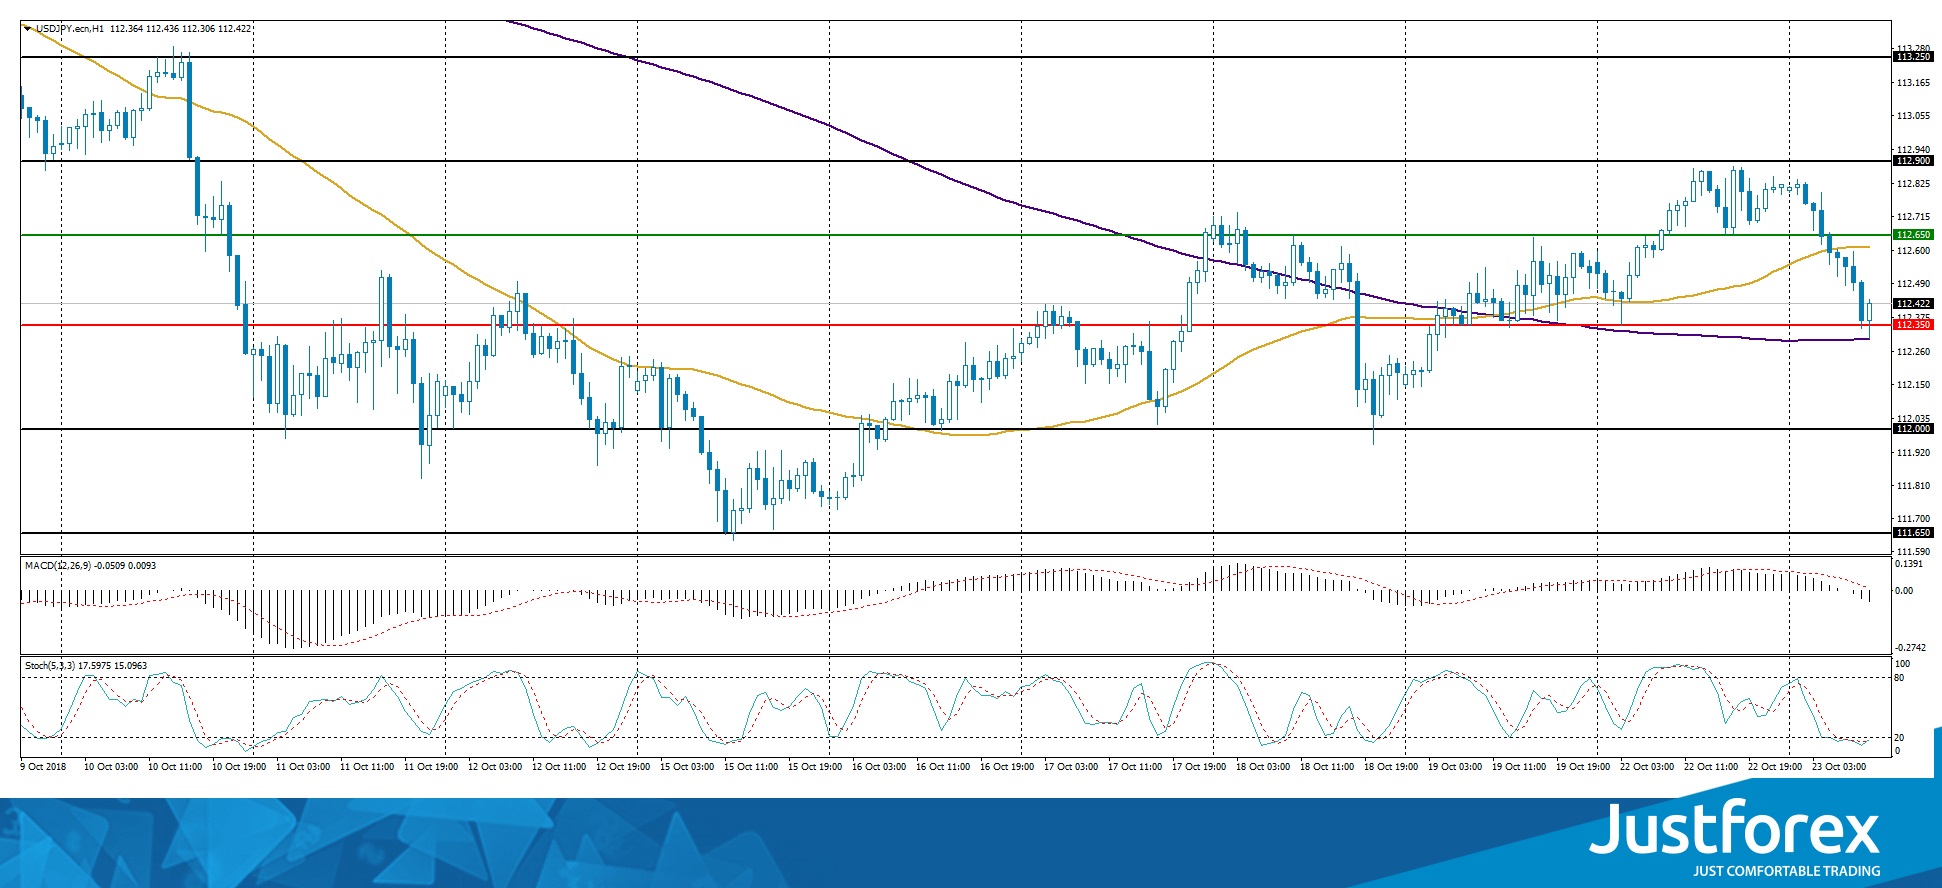
Indicators do not send accurate signals: the price has fixed between 50 MA and 200 MA.
The MACD histogram has moved to the negative zone, which indicates the power of sellers.
Stochastic Oscillator is in the oversold zone, the %K line has crossed the %D line. There are no signals at the moment.
Trading recommendations
Support levels: 112.350, 112.000, 111.650
Resistance levels: 112.650, 112.900, 113.250
If the price fixes below 112.350, a further fall in the USD/JPY quotes is expected. The movement is tending to 112.000-111.700.
An alternative may be the growth of the USD/JPY currency pair to the round level of 113.000.
The Demand For The USA Currency Is High Again
The USD strengthened against the basket of the major currencies. The USD index (#DX) updated the weekly maximums and closed in the positive zone (+0.35%). The demand for the USA currency remains high.
The EUR weakened due to the inconsistencies regarding the Italian budget. The local government still intends to approve the proposed 2019 budget project, which exceeds the limits determined by the EU. The European Commission considers these actions a rude violation of the EU financial demands.
The GBP fell against the USD. Steve Baker, a politician in Theresa May’s British Conservative Party, offered a correction in the agreement regarding the UK exit from the US, which in turn blocked the EU’s plan. The Democratic Union Party of Northern Island is ready to review this correction.
The oil quotes are consolidating. At the moment, the WTI futures are testing the 69 USD/barrel mark. A weekly report on the reserves of the crude oil from the American Petroleum Institute will be published at 23:30 (GMT+3:00).
Market Indicators
Yesterday, the major US stock indices were showing a variety of trends: #SPY (-0,45%), #DIA (-0,50%), #QQQ (+0,51%).
The 10-year US government bonds yield is lowering. At the moment, the indicator is at 3.15-3.16%.
The Economic News Feed for 23.10.2018 is calm. We recommend you to keep an eye on the statement by the governor of the Bank of England – Mark Carney – regarding the recent expense scandal.
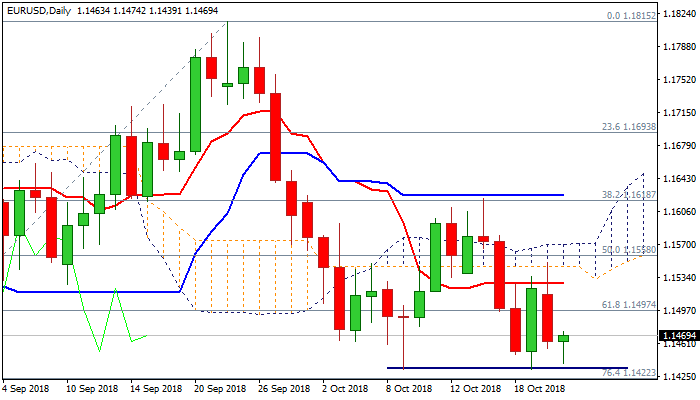
EURUSD Countertrend Move Possible At 1.1430
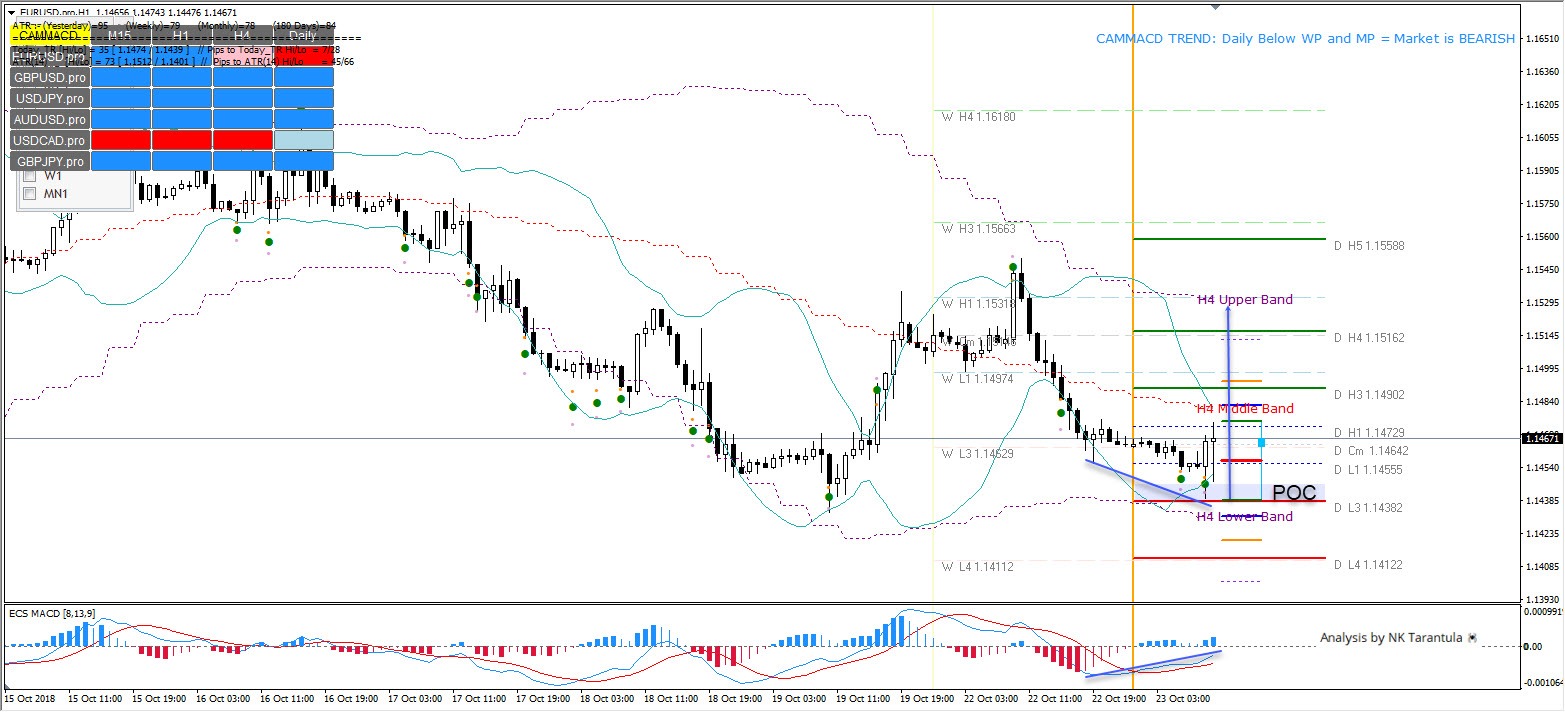
The EUR/USD has formed a regular bullish divergence straight at D L3 and H4 Lower Band. We might see a countertrend move if the zone holds tight.
A regular bullish divergence could prove successful if the price rejects from the POC zone 1.1440-50 and holds above D H1 at 1.1472. In that case, the bounce should target 1.1490 zone with a potential towards 1.1515-1.1530. This can happen only if the intraday bullish momentum is strong and steady. A loss of 1.1430 could tank the price down to 1.1410-1.1400 zone.
USDJPY Outlook: Fresh Safe Haven Demand Boosts Yen And Undermines Recovery Action
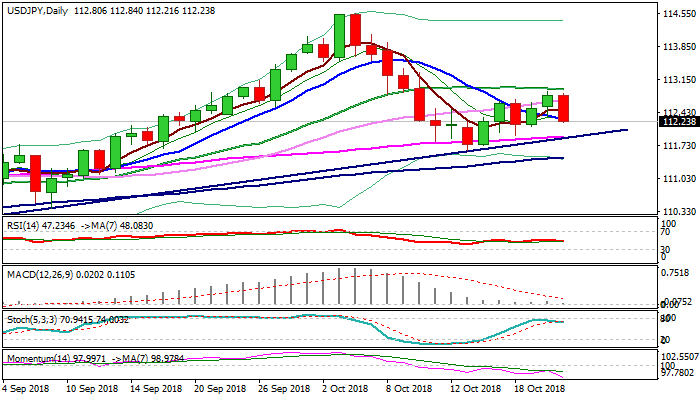
The pair was sharply down in Asia / early Europe on Tuesday, losing around 0.4% as yen benefited on renewed safe-haven demand. Fresh weakness sidelined hopes of recovery extension after Monday's action eventually closed above pivotal 112.74 (Fibo 38.2% of 114.54/111.62) and generated bullish signal. Upside attempts stalled just under 20SMA (112.92), which is turning lower and adding to bearish pressure, along with strong bearish momentum and south-turning slow stochastic which reversed on approach to overbought zone border. Pullback from recovery high at 112.88 retraced so far 50% of 111.62/112.88 recovery leg, signaling that corrective phase might be over. Extension and close below 112.10 (Fibo 61.8% / base of thick 4-hr cloud) would confirm negative scenario and expose 55SMA / trendline support (111.91) with extension towards key support at 111.62 (15 Oct low) not ruled out, as daily cloud twists on Thursday and could be magnetic.
Res: 112.47, 112.74, 112.92, 113.08
Sup: 112.10, 111.91, 111.62, 111.47
Forex Technical Analysis: EUR/USD, USD/JPY, GBP/USD
EUR/USD
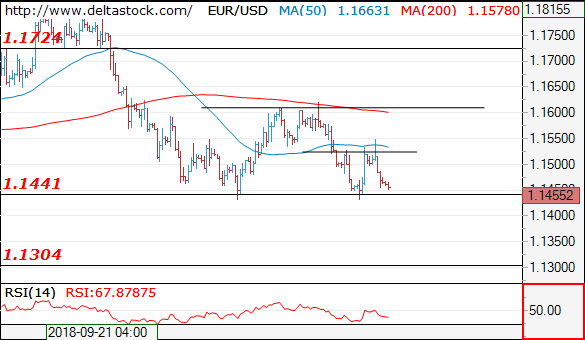
Current level - 1.1455
The reversal at 1.1550 shows, that another attempt at 1.1430 is underway and a break through the mentioned area will target 1.1300 zone. Minor intraday resistance lies at 1.1480.
| Resistance | Support | ||
| intraday | intraweek | intraday | intraweek |
| 1.1480 | 1.1835 | 1.1430 | 1.1430 |
| 1.1550 | 1.2010 | 1.1300 | 1.1300 |
USD/JPY
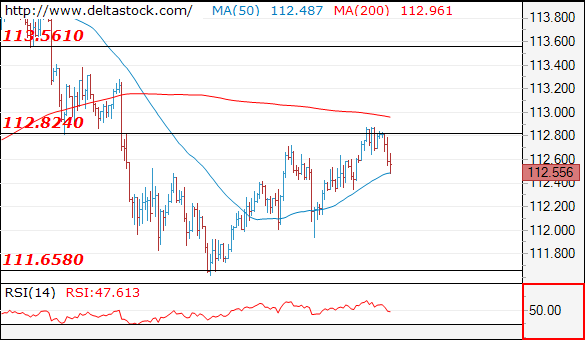
Current level - 112.55
The failure at 112.80 reveals a negative outlook, for a slide towards 111.90 and 111.60 later on.
| Resistance | Support | ||
| intraday | intraweek | intraday | intraweek |
| 112.80 | 114.40 | 111.90 | 111.65 |
| 113.50 | 114.40 | 111.65 | 110.40 |
GBP/USD
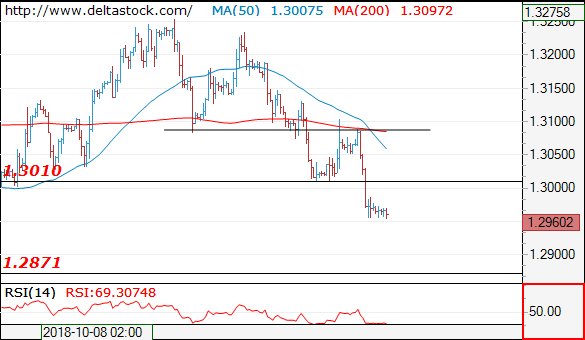
Current level - 1.2960
The outlook is bearish below 1.3010, for a slide towards 1.2870 zone. Crucial on the upside is 1.3100.
| Resistance | Support | ||
| intraday | intraweek | intraday | intraweek |
| 1.3010 | 1.3440 | 1.2950 | 1.2570 |
| 1.3100 | 1.3440 | 1.2870 | 1.2570 |
Risk Sentiment Wanes On Geopolitical Concerns
Asian stock markets tumbled this morning following a lacklustre session on Wall Street overnight that saw the Dow Jones fall more than 100 points.
The incredible rally in Chinese equities yesterday clearly failed to jumpstart risk sentiment as geopolitical tensions weighed heavily on investor confidence. Global equity bulls seem to be entangled in a gruelling battle with ongoing US-China trade disputes, global growth concerns, geopolitical tensions and prospects of higher US interest rates. With the various geopolitical risk factors bubbling violently in the cauldron, all the ingredients for a market-shaking selloff across global stocks seem to be in place. All good things must come to an end and this could be the story for the bullish global equity markets.
Dollar gains on safe-haven demand
The Dollar remains a popular destination for safe-haven flows amid the mounting geopolitical tensions across the world.
Uncertainty over Brexit negotiations, the standoff over Italy’s budget and US-Saudi tensions have sent investors rushing to the Dollar. With the Greenback also supported by optimism over the US economy and prospects of higher US interest rates, the fundamental outlook points to further upside. In regards to the technical picture, the Dollar Index is bullish on the daily charts with prices trading near a two-week high above 96.10. A solid weekly close above 96.00 has the potential to trigger a move towards 96.20 and 96.48.
Commodity spotlight – Gold
Gold bulls hit the ground running this morning as geopolitical concerns promoted risk aversion and accelerated the flight to safety.
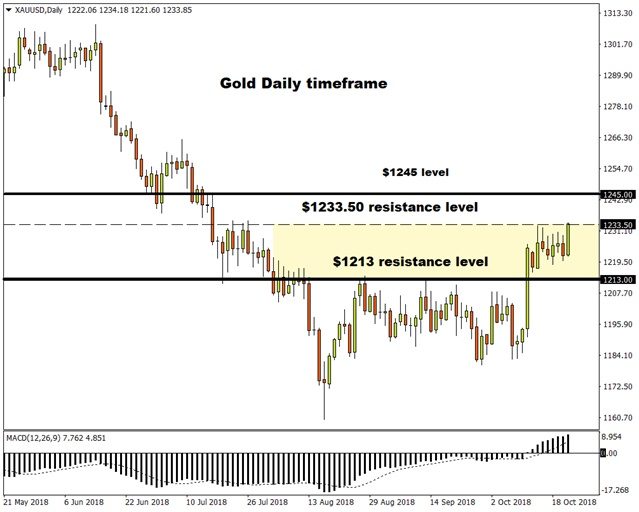
The yellow metal has scope to shine with intensity this week as the risk-off mood sends investors rushing to any form of safety. However, with the Dollar also benefiting from safe-haven flows there could be fierce competition between the two. Gold seems to be winning the battle of the safe-havens this morning with prices trading around $1,231 as of writing. A solid breakout and daily close above the $1,233.50 resistance level is likely to inject Gold bulls with enough inspiration to challenge $1,245.
Currency spotlight – GBPUSD
Brexit-related uncertainty remains the primary culprit behind Sterling’s weakness.
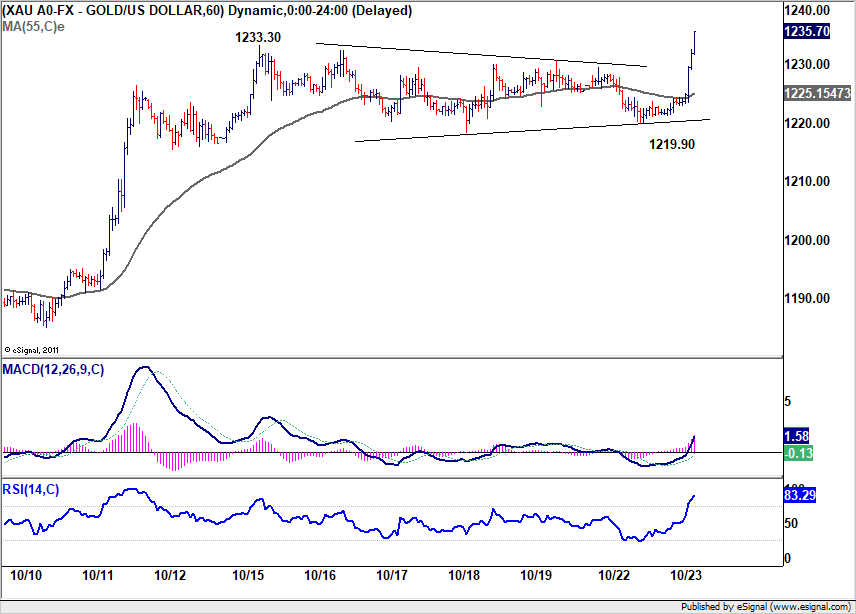
Gold extends rebound through last week’s high, to take on 1235.24/1236.99 cluster resistance
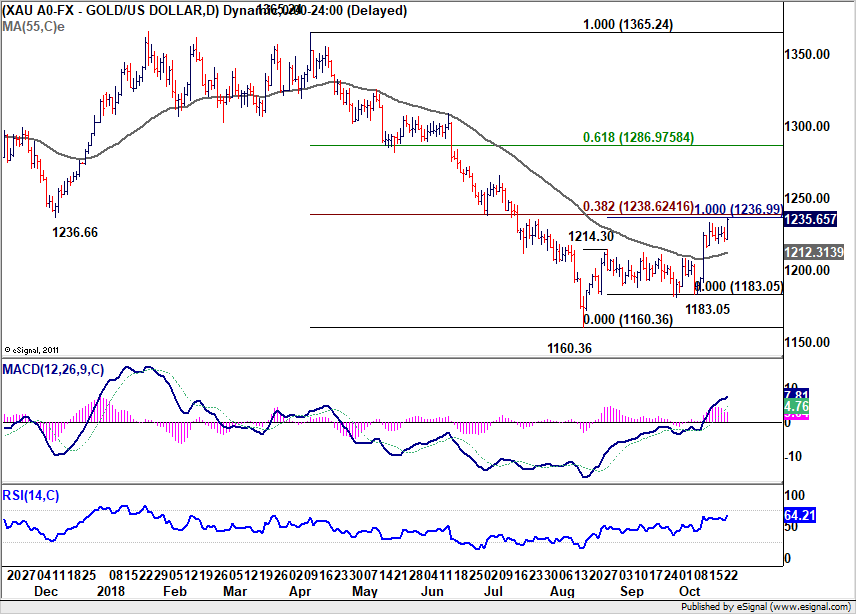
Gold jumps sharply today as Dollar loses ground to Yen on risk aversion. The break of last week's high at 1233.30 indicates resumption of whole rebound from 1160.36.
Focus is now back on 1235.24/1236.99 cluster resistance zone (38.2% retracement of 1365.24 to 1160.36 at 1238.62, 100% projection of 1160.36 to 1214.30 from 1183.05 at 1236.99). For now we'd expect this resistance to hold to bring down trend resumption. On the downside, break of 1219.90 minor support will suggest that the rebound is completed and turn near term outlook bearish.
However, decisive break of 1235.24/1236.99 will argue that the trend could have reversed and further rally might be seen back to 61.8% retracement at 1286.97 and above.
Technical Analysis: Sterling And Euro
Sterling and Euro both under the control of bears but this could be changing
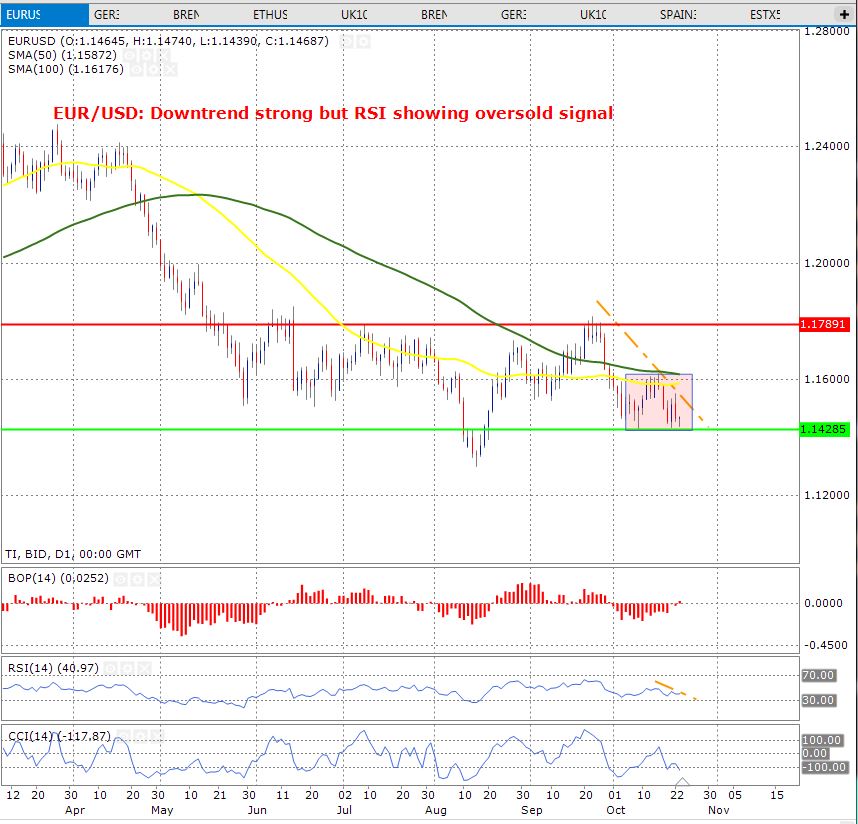
The EURUSD pair is trading in a strong downtrend on a daily time frame. The confirmation of this argument comes from the fact that the price is trading below the 50-day moving average (shown in yellow) and the moving average is trading below the 100-day moving average (shown in green). However, if you see the recent slope of the 50-day moving average, it becomes clear that it is turning positive. This gives an indication that the bears who have a strong control of the price may end up losing this control.
The support zone is shown by the green horizontal line
The resistance zone is shown by the red horizontal line.
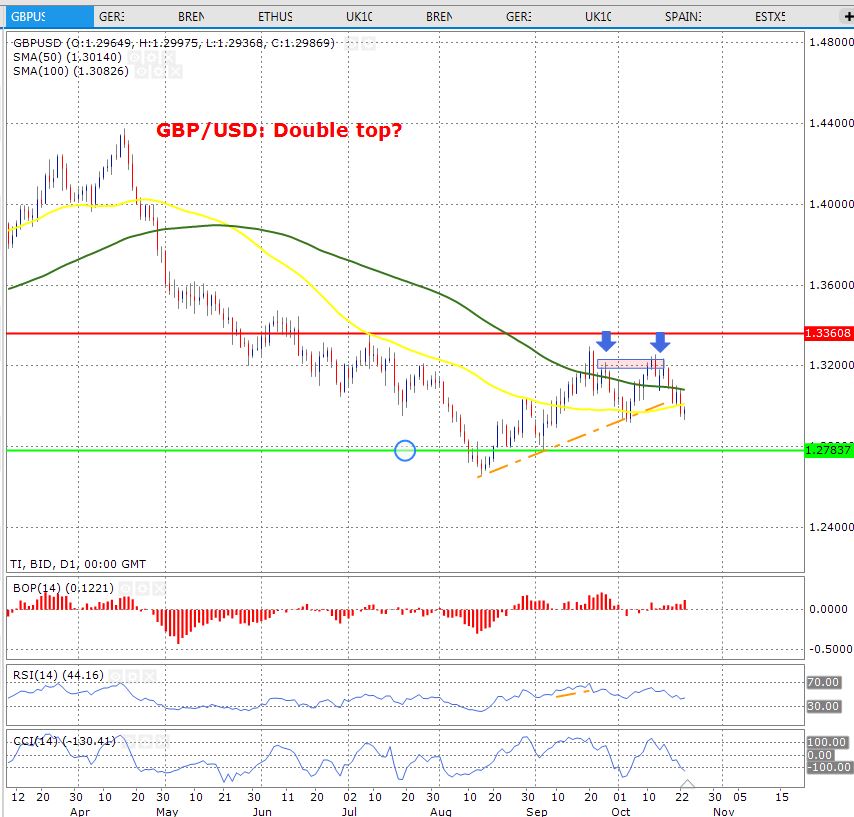
The GBP/USD pair dropped after forming a double top on a daily time frame. The double top is shown by the two blue arrows. The price has broken its upward trend line, confirming that the bears have lost control of the price. The RSI and CCI, both oscillators are sending a strong signal that the price is way oversold. When these oscillators send such signals, traders usually take this as an opportunity and they buy the price. The balance of Power indicator is in the positive territory and this is another confirmation that the price could be moving higher soon.
Once again the slope of the 50-day moving average (shown in yellow) is another positive sign here and this is a further confirmation that the price may move higher.
The support zone is shown by the green horizontal line
The resistance zone is shown by the red horizontal line.
EURUSD Outlook: Key Supports Under Strong Pressure But Bears Lack Momentum For Eventual Break
The Euro holds bearish near-term bias and pressuring key supports at 1.1432 (09 / 19 Oct lows) on Tuesday, following bearish close on Monday after recovery attempts were capped by daily cloud base (1.1545).
Near-term sentiment is weighed by political uncertainty in Europe over Italy’s budget issue, as tensions between Rome and Brussels could rise on fears that crisis could spill over through the bloc.
Bearish setup of daily MA’s adds to negative outlook, however, north-heading momentum suggests that bears could be delayed for extended congestion above 1.1432 base.
Daily cloud is thickening and marks strong barrier which is expected limit upside attempts.
Falling 5SMA marks initial resistance at 1.1481, with selling upticks scenario favored under 10SMA (1.1522) which guards upper pivots at 1.1540/45 (falling 20SMA / daily cloud base).
Res: 1.1481, 1.1497, 1.1522, 1.1545
Sup: 1.1432, 1.1422, 1.1394, 1.1366