Sample Category Title
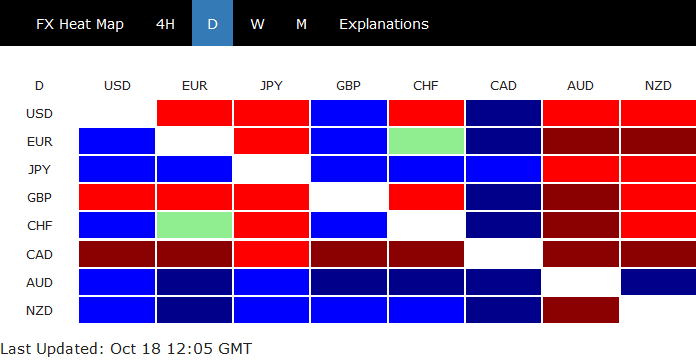
Into US session: Australian Dollar strongest on iron ore, shrugs China stocks selloff
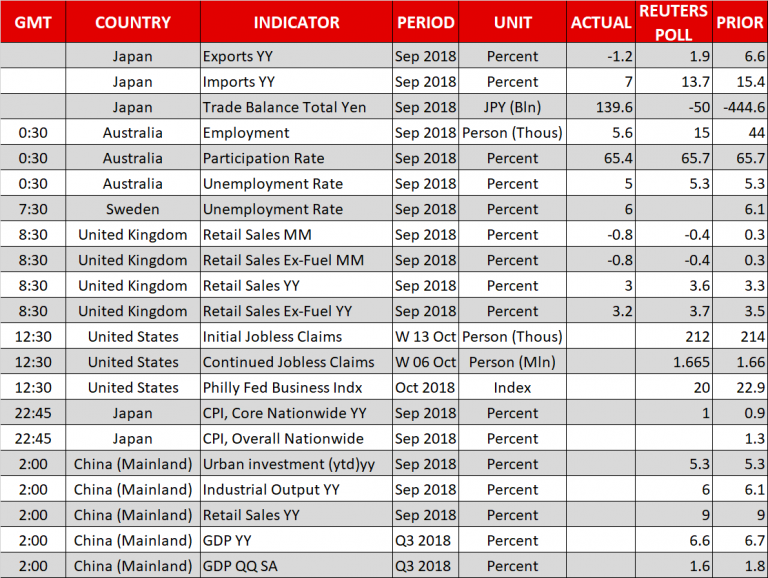
Entering into US session, Australian Dollar defy all the negative factor and it's trading as the strongest one, followed by New Zealand Dollar. Australian job data was just a mixed bag as fall in unemployment rate was mainly due to contraction in labor force as shown indicated in drop in participation rate. Meanwhile, Chinese stocks are suffering another day of steep selloff. Strength in iron ore price is the key factor in driving the Aussie higher. According to Metal Bulletin spot price for benchmark 62% iron ore hit the highest level since March at 73.36.
Canadian Dollar is trading as the worst performing one as oil prices continue deep decline. WTI crude oil is now below 69 at 68.68 and is accelerating downwards. Sterling is the second weakest one on Brexit impasse. Dollar is mixed today but is showing some sign of strength at the time of writing. Let's see if it can resume the post FOMC minutes rally in US session.
In European markets, at the time of writing:
- FTSE is down -0.18%
- DAX is down -0.18%
- CAC is up 0.19%
- German 10 year yield is up 0.0033 at 0.467
- Italy 10 year yield up even more by 0.056 at 3.600
- German-Italian spread stays above 300 alarming level
Earlier today in Asia:
- Nikkei dropped -0.80%
- Singapore Strait Times dropped -0.05%
- Hong Kong HSI dropped -0.03%
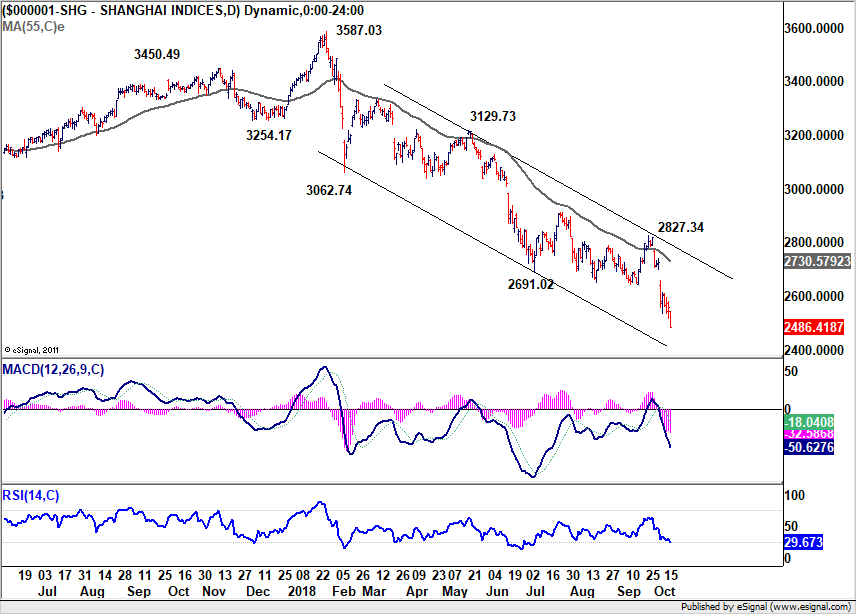
- China Shanghai SSE dropped -2.94% to 2486.42, taken out 2500 handle as down trend extended
Pound Regains Ground Despite Retail Sales Weakness; Yuan at 2-Month Lows ahead of China’s GDP Growth
Here are the latest developments in global markets:
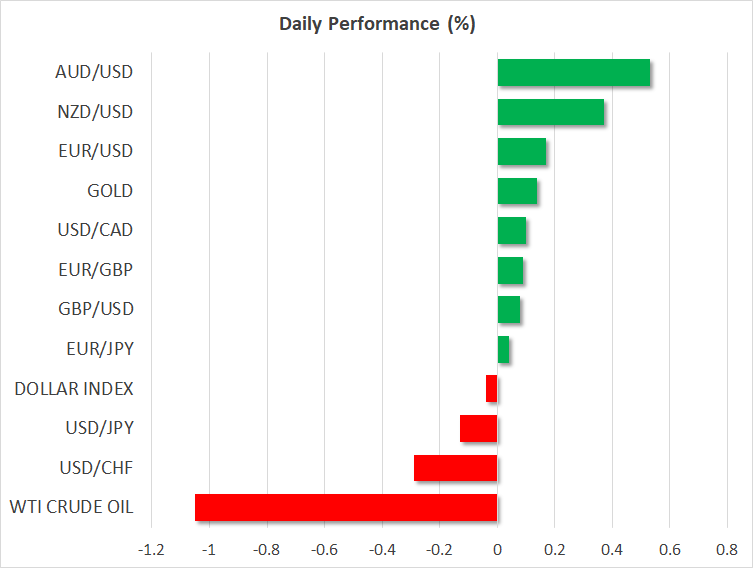
- FOREX: The US dollar ran to a new 1-week high against the Japanese yen earlier on Thursday after FOMC minutes from the September 24-25 policy meeting affirmed the prospect of additional rate hikes until the end of 2019. However, the pair eased by 0.18% soon after to trade at 112.47. The US dollar index reversed lower as well, last seen at 95.51 (-0.07%). British retail sales fell by 0.8% in September, posting a larger decline than the 0.4% drop forecasted. In August the measure increased by 0.3%. On a yearly basis, retail sales rose 3.0% from 3.3% in the preceding month, missing expectations for a 3.6% growth. The data however had little impact on the pound, with pound/dollar trading fractionally higher at 1.3125 (+0.10%) and pound/yen slighlty lower at 147.60 (-0.06%). It is worth mentioning, that sterling closed lower on Wednesday as the first day of the EU summit failed to bring a breakthrough on EU-UK divorce terms. Euro/dollar moved higher by 0.20%, jumping above 1.1500, while euro/yen gained by 0.08%. In the antipodean sphere, aussie/dollar edged higher by 0.52% as Australia’s unemployment rate unexpectedly dropped to 5% overnight, while kiwi/dollar advanced by 0.35%. Dollar/loonie climbed by 0.12% to 1.3032. The chinese offshore yuan was down by 0.20% at two-month lows ahead of the Chinese third quarter growth figures due on Friday and after the US Treasury avoided to call China a currency manipulator at its twice-yearly currency report, a move that could keep tensions from escalating further.
- STOCKS: European stock markets were mixed on Thursday at 1110 GMT. The pan-European STOXX 600 pared declines on the back of positive earnings, adding 0.18% to its performance, while the blue-chip Euro STOXX 50 was steady. The German DAX 30 was up by 0.14%, the French CAC 40 rose by 0.31%, while the Italian FTSE MIB slipped by 0.26%. The UK’s FTSE 100 pulled back by 0.20%. The worst performer today was the Spanish IBEX 35 sliding by 0.82% as financials dived (-2.89%) after the Supreme court charged Spanish banks with mortage taxes. In the US, futures tracking the S&P 500, Dow Jones, and Nasdaq 100 are pointing to a lower open today.
- COMMODITIES: Oil prices tumbled today as the EIA weekly report indicated a build up in US stockpiles for the fourth consecutive week, while a potential slowdown in the Chinese economy was also a concern. WTI crude plummeted by 1.12% to $68.98/barrel, near 1-month lows, while London-based Brent plunged by 1.26% to $79.04. In precious metals, gold traded marginally higher by 0.10% at $1,223.5/ounce.
Day Ahead: All eyes on Chinese GDP growth; Philly Fed Business Index & Japanese inflation also in focus
At 1230 GMT, Federal Reserve of Philadelphia is scheduled to publish its Business index for the month of October and the dollar could take the opportunity to make additional gains in case the numbers prove better than expected. Such a development would be another confirmation sign that the Fed will likely continue to raise rates in coming years or even adopt a stricter stance by driving rates above neutral levels as FOMC meeting minutes indicated. Looking at forecasts, the index is said to soften from 22.9 to 20.
At the same time, the US Department of Labor will be delivering initial jobless claims for the week ending October 13.
Chinese GDP growth figures, however, will be the most awaited release in coming sessions as projections suggest that the world’s second biggest economy expanded by 6.6% y/y in the third quarter, at the slowest pace since financial crisis. While this still above the government’s 6.5% growth target and marginally below the previous mark of 6.7%, investors could speculate that rising US trade protectionism against China has already started to bite at a time when the Chinese government makes efforts to put breaks to its mounting debt growth. Pessimism among manufacturers might have led industrial production lower as well, as analysts believe that factory output increased by 6.0% y/y in September compared to 6.1% in August, while in the January-September period,spending on infrastructure is said to have remained at a record low of 5.3% y/y. Retail sales delivered along the above data are also said to have stuck around multi-year lows, rising by 9.0% in September as in August. The data are due to hit markets at 0200 GMT on Friday.
Chinese stocks could rally in the wake of upbeat GDP growth figures and the Chinese yuan could recoup earlier losses against the greenback. The Australian currency is highly expected to move to the upside as well given that China is Australia’s major export partner.
Meanwhile in Japan, the Japanese core CPI is expected to inch up from 0.9% to 1.0% in September. Yet as the gauge shows no sustained moves towards the Bank of Japan’s 2.0% inflation target, the central bank is not likely to abandon its accommodative policy. The yen though could find some support if the numbers surprise to the upside.
In Europe, EU leaders will be discussing Brexit in the last day of the summit but hopes for an exit deal are very low, with the EU negotiator saying yesterday that more time is needed to deliver an orderly Brexit. The UK Prime Minister appeared positive to extend the transition period, though Barnier claimed that this would be acceptable if the British Prime Minister allowed a two-tier backstop in the Irish border. That is to maintain an open border between Northern Ireland and the Republic of Ireland, while applying alternative measures to a British-wide custom union. Besides Brexit, Italy’s budget plan is another headache for traders as recent comments from EU officials including the President of the European Commission, Jean-Claude Junker, were pointing that things could worsen before getting better.
In equity markets, the earnings season continues, with the American Express and Paypal Holdings delivering results for the third quarter after US markets close.
As for public speeches scheduled for today, ECB Executive Board Member Benoit Coeure and ECB President Mario Draghi will be participating in the Euro Summit. In the US Federal Reserve Bank of St. Louis President James Bullard will be giving a presentation on the U.S. economy and monetary policy before the Economic Club of Memphis at 1315 GMT. In New York, Fed Vice Chairman for Supervision Randal Quarles will be commenting before an Economic Club of New York luncheon at 1415 GMT.
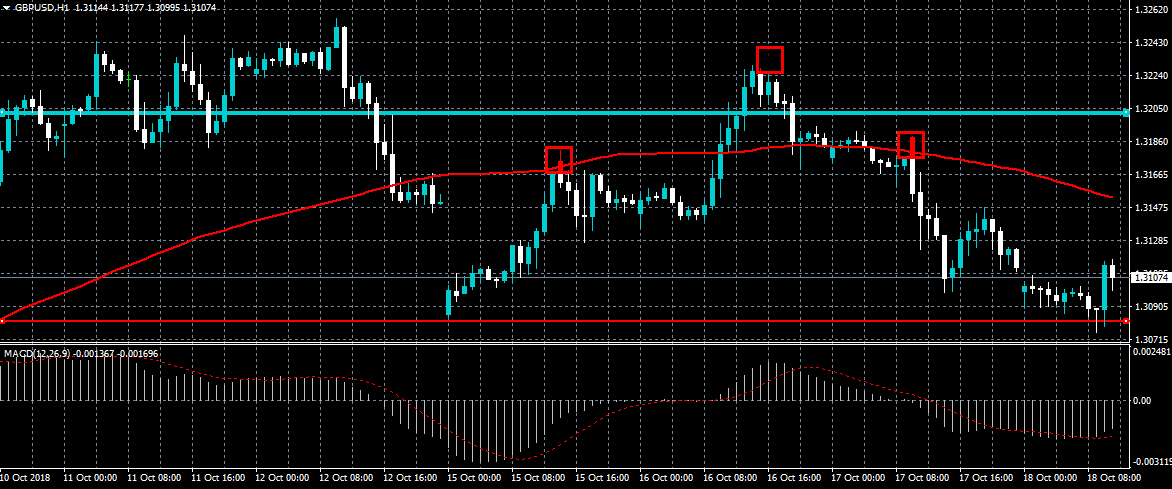
GBPUSD Watching Bearish Pattern
The British pound has started to move above the 1.3100 level against the US dollar, despite much weaker than expected Retail Sales data from the United Kingdom economy. In the medium-term, the GBPUSD pair remains intraday bearish while trading below the 1.3155 level. In the short-term, a bearish head and shoulders pattern is emerging across the lower time frames.
The GBPUSD pair is strongly bearish while trading below the 1.3080 level, key support is now found at the 1.3033 and 1.3000 levels.
If the GBPUSD pair moves above the 1.3155 level, buyers are increasingly likely to test the 1.3200 resistance level.
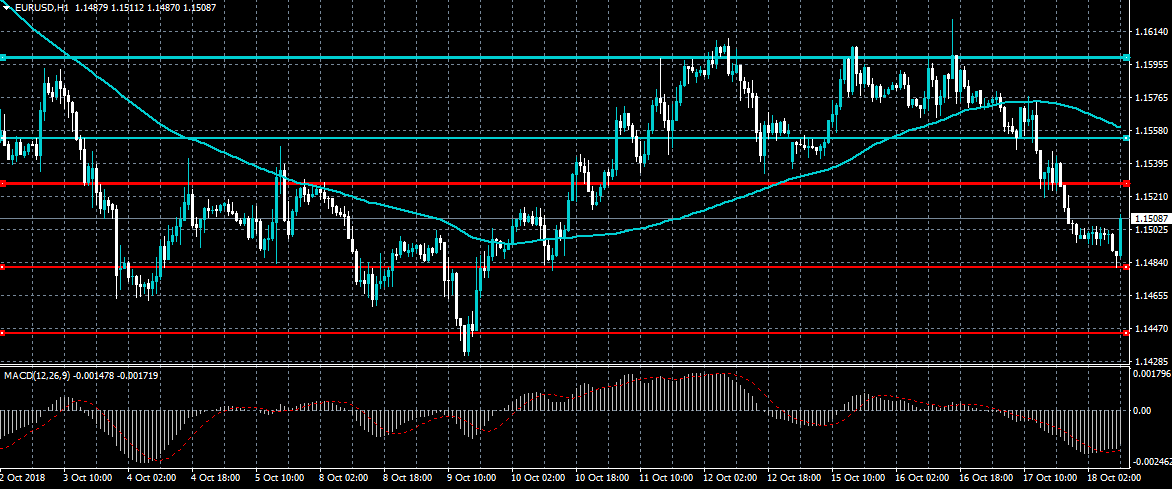
EURUSD Still Intraday Bearish Below 1.1553
The euro currency is starting to recover above the 1.1500 resistance level against the US dollar, following the earlier heavy technical sell-off. The EURUSD pair retains a bearish intraday bias while trading below the 1.1553 level and is still at risk of further losses towards the 1.1445 level. Short-term technical indicators are now attempting to correct from extremely oversold conditions.
The EURUSD pair is intraday bearish while trading below the 1.1553 level, key support is now found at the 1.1480 and 1.1445 levels.
If the EURUSD pair trades above the 1.1500 level, key intraday resistance is found at the 1.1553 and 1.1600 levels.
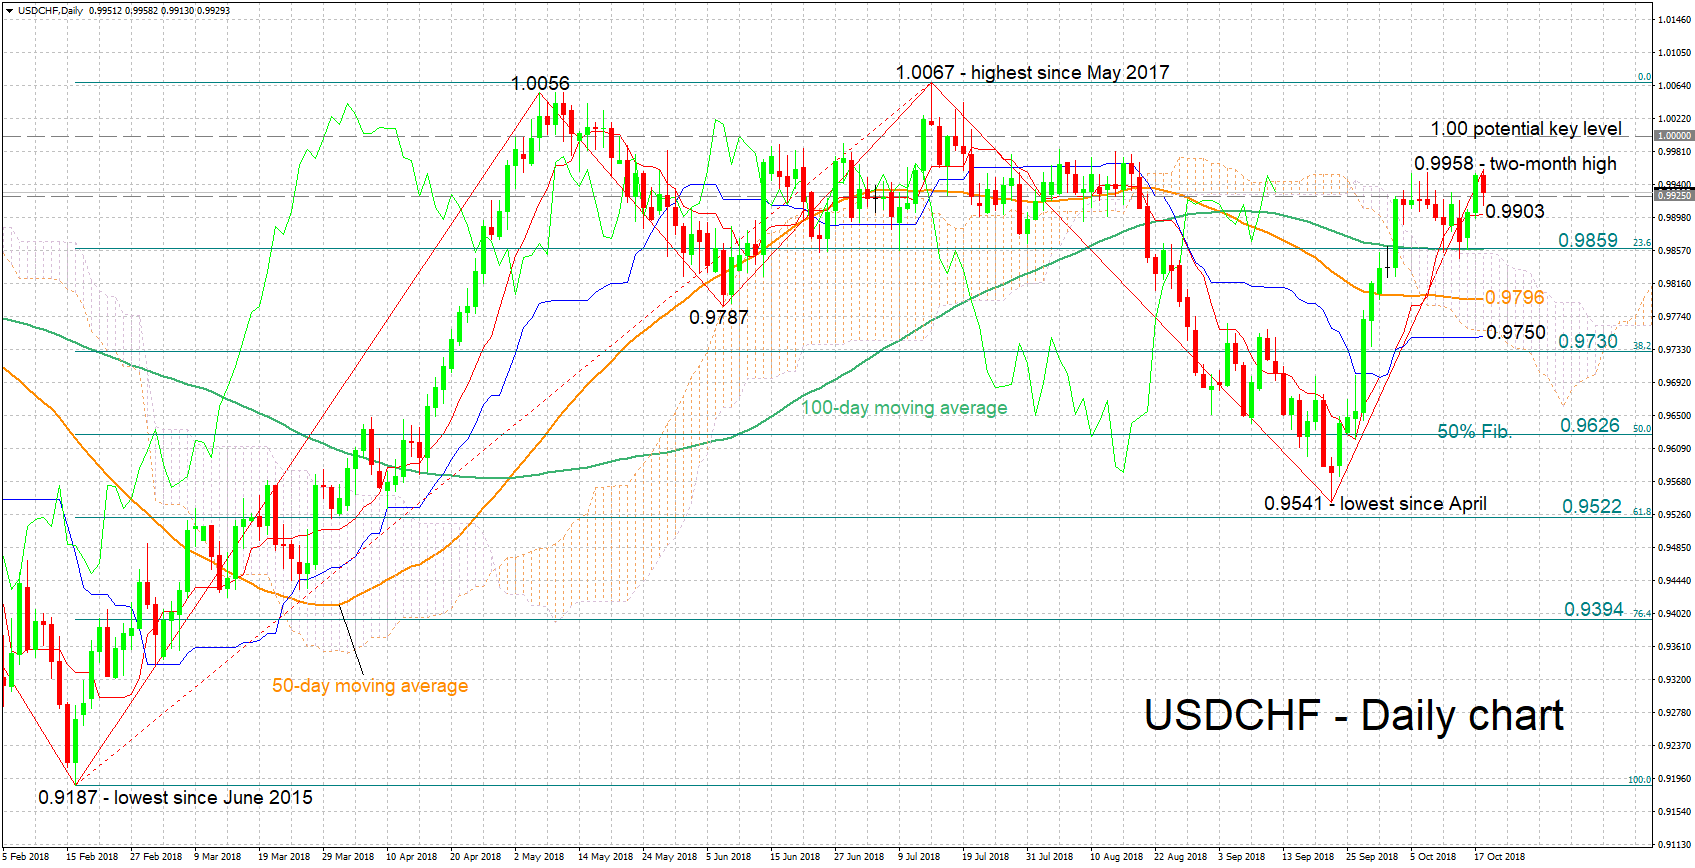
USDCHF Touches 2-Month High, Bullish Momentum May Be Easing
USDCHF's remarkable recovery after touching its lowest since April of 0.9541 on September 21 has brought the pair to a two-month high of 0.9958 earlier on Thursday. The pair has eased a bit from that peak, though it remains roughly 400 pips above late September's low.
The Tenkan and Kijun-sen lines are positively aligned in support of the short-term bullish bias that is in place. However, notice that the two lines have eased, suggesting that positive momentum may be running out of steam.
Given a move above the previously-tracked high of 0.9958, resistance may occur around the parity level (1.00) that could hold psychological significance. Higher still, 1.0067, a more than one-year peak, would increasingly come into scope.
On the way down, immediate support could be taking place around 0.9925 which was congested between mid-June to late August. Not far below lies the current level of the Tenkan-sen at 0.9903, with a downside violation turning the focus to 0.9859, which is the 23.6% Fibonacci retracement level of the upleg from 0.9187 to 1.0067. The 100-day (simple) moving average line and the Ichimoku cloud top roughly coincide with this point. Steeper losses would turn the attention to the zone around the 50-day MA at 0.9796.
In terms of the medium-term picture, trading activity taking place above both the 50- and 100-day MAs, as well as above the Ichimoku cloud, is indicative of a positive outlook. However, the two MAs being roughly flat at the moment is a sign that the bullish structure remains fragile and further rallies are needed to solidify it.
Overall, the short- and medium-term outlooks are looking mostly bullish, though they both currently appear relatively fragile.
The Analytical Overview Of The Main Currency Pairs
The EUR/USD currency pair
Technical indicators of the currency pair:
Prev Open: 1.15795
Open: 1.15000
% chg. over the last day: -0.64
Day's range: 1.14875 – 1.15062
52 wk range: 1.0571 – 1.2557
Yesterday, the EUR/USD currency pair was characterized by an aggressive sell-off. The quotes have lowered by more than 80 points. The investors warmed up towards the USD after the FOMC meeting minutes publication. At the moment the local support and resistance levels are 1.14900 and 1.15200 respectively. The positions should be opened from these levels.
The economic news feed on 18.10.2018:
Philadephia Fed manufacturing index at 15:30 (GMT+3:00)
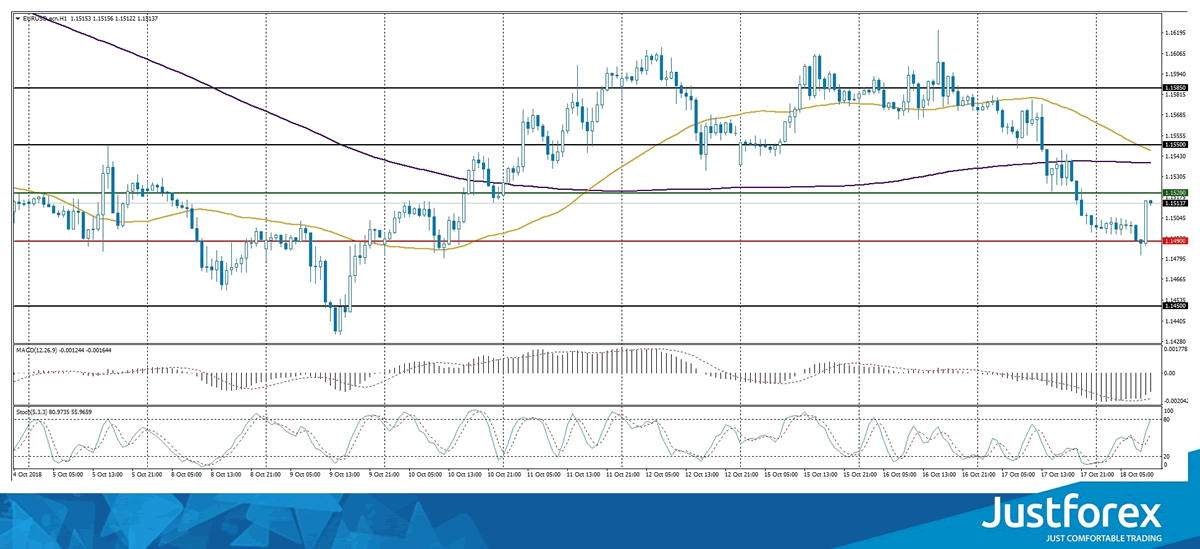
The price fixed below 50 MA and 200 MA, which shows the sellers' power.
The MACD histogram is in the negative zone, but above the signal line, which shows a weak signal towards the EUR/USD sale.
The Stochastic Oscillator is in the neutral zone, the %K line is above the %D line, which indicates the bullish sentiment.
Trading recommendations
Support levels: 1.14900, 1.14500
Resistance levels: 1.15200, 1.15500, 1.15800
If the price fixes above the resistance level 1.15200, we can expect the correction of the EUR/USD quotes. The movement tends towards 1.15500-1.15800.
Alternatively, the EUR/USD currency pair can lower towards 1.14500-1.14200.
The GBP/USD currency pair
Technical indicators of the currency pair:
Prev Open: 1.31783
Open: 1.31128
% chg. over the last day: -0.64
Day's range: 1.31127 – 1.31152
52 wk range: 1.2361 – 1.4345
Yesterday the GBP/USD currency pair has been showing bearish sentiment. The British pound is heavily weakened against the USD after the publication of the weak economical statistics from Great Britain. For example, the consumer price index lowered to 2.4%, while the experts expected 2.6%. At the moment, the local support and resistance levels are 1.30900 and 1.31250 respectively. Positions should be opened from these levels. The trading instrument has a potential for further decline.
Economic news feed on 18.10.2018:
Retail sales statistics in the UK at 11:30 (GMT+3:00).
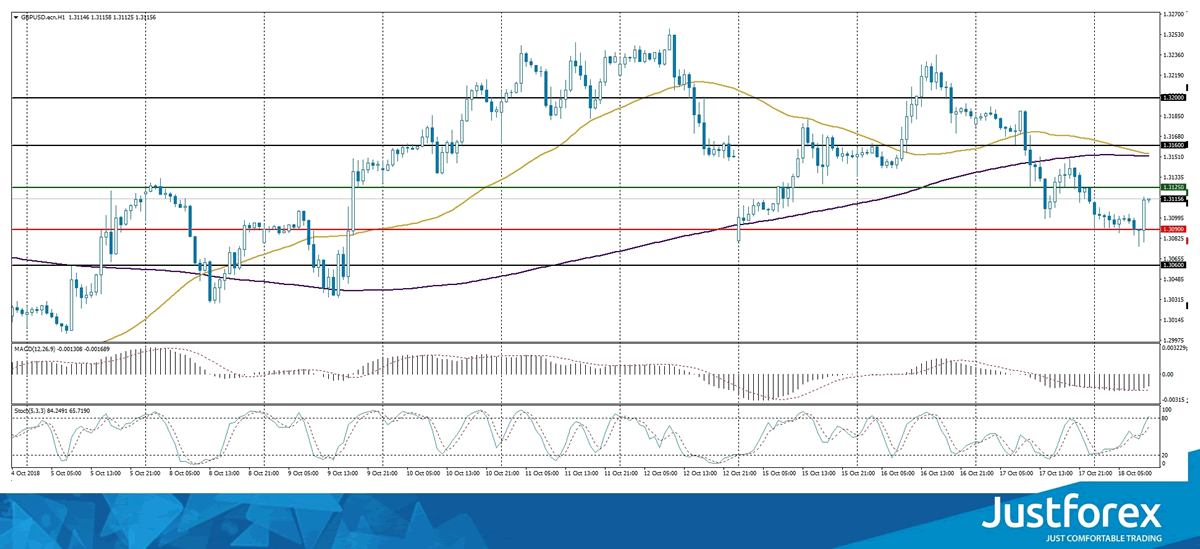
The indicators show the sellers' power: the quotes are being traded below 50 МА and 200 МА.
The MACD histogram is in the negative zone, but above the signal line, which gives a weak signal towards the GBP/USD sell-off.
The Stochastic Oscillator is in the negative zone, the %K line is above the %D line, which indicates the bullish sentiment.
Trading recommendations
Support levels: 1.30900, 1.30600
Resistance levels: 1.31250, 1.31600, 1.32000
If the price fixes above the resistance level of 1.31250, we can expect the further correction of the GBP/USD quotes. The movement tends towards 1.31600-1.31850.
Alternatively, the GBP/USD currency pair can lower towards 1.30600-1.30300.
The USD/CAD currency pair
Technical indicators of the currency pair:
Prev Open: 1.29331
Open: 1.30161
% chg. over the last day: +0.71
Day's range: 1.30324 – 1.30383
52 wk range: 1.2059 – 1.3795
The USD/CAD currency pair is showing an aggressive buy-out. During the yesterday’s and today’s trading, the quotes have grown by more than 100 points. At the moment, the local support and resistance levels are 1.30250 and 1.30550 respectively. Positions should be opened from these levels. The USD/CAD currency pair has a potential for further growth.
The economic news feed for Canada is calm today.
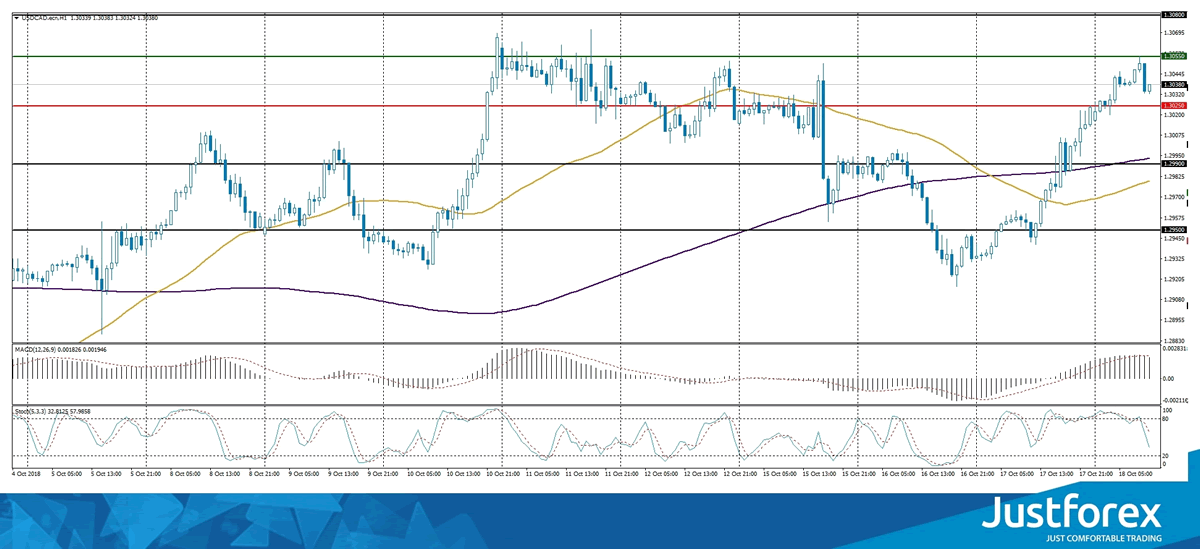
The indicators show the buyers' power: the price is being traded above 50 МА and 200 МА.
The MACD histogram is in the positive zone, but below the signal line, which gives a weak signal towards the purchase of USD/CAD.
The Stochastic Oscillator is in the negative zone, the %K line is below the %D line, which indicates the bearish sentiment.
Trading recommendations
Support levels: 1.30250, 1.29900, 1.29500
Resistance levels: 1.30550, 1.30800, 1.31000
If the price fixes above the resistance level 1.30550, we can expect further growth of the USD/CAD quotes. The movement will tend towards 1.30800-1.31000.
Alternatively, the price fixes below the support level of 1.30250, you have to look for the market entry points to open short positions. The price will tend towards 1.29900-1.29700.
The USD/JPY currency pair
Technical indicators of the currency pair:
Prev Open: 112.258
Open: 112.641
% chg. over the last day: -0.33
Day's range: 112.556 – 112.629
52 wk range: 104.56 – 114.74
Yesterday, the USD/JPY currency pair was showing the bullish sentiment. The growth of the quotes has gone over 50 points. The trading instrument has updated the local maximums. At the moment, the “safe haven” currency is consolidating. The local support and resistance levels are 112.400 and 112.700 respectively. Positions should be opened from these levels.
Today, some ambiguous data about the Japanese trading balance was published during the Asian trading session.
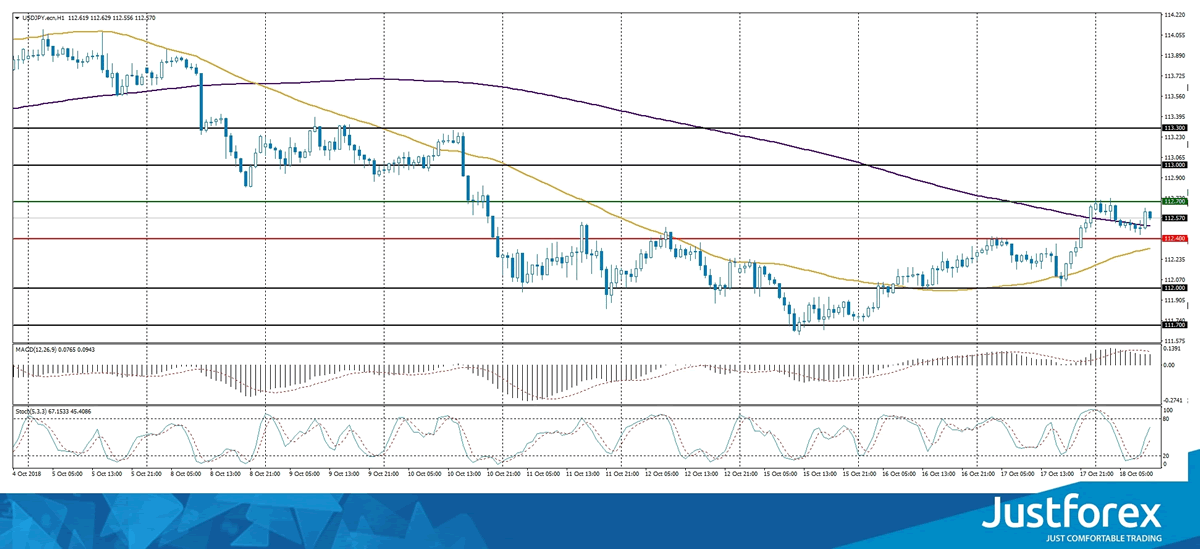
The indicators show the buyers' power: the USD/JPY quotes fixed above the 50 МА and 200 МА.
The MACD histogram is in the positive zone, but below the signal line, which indicates a small signal towards the purchase of USD/JPY.
The Stochastic Oscillator is in the negative zone, the %K line is above the %D line, which indicates the growth of the quotes.
Trading recommendations
Support levels: 112.400, 112.000, 111.700
Resistance levels: 112.700, 113.000, 113.300
If the price fixes above the resistance level 112.700, further growth of the USD/JPY quotes can be expected. The movement will tend towards 113.000-113.300.
Alternatively, if the price fixes below the mirror support of 112.400, we recommend looking for entry points to the market to open the short positions. The movement will tend towards 112.000-111.700.
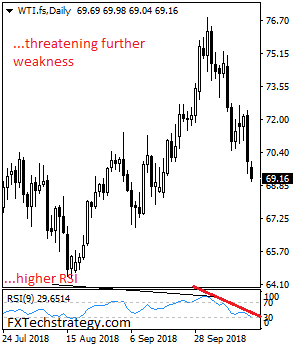
CRUDE OIL Faces Further Bear Pressure, Eyes 68.27 Area
CRUDE OIL faces bear pressure following its Wednesday price sell off. On the downside, support resides at the 68.50 level where a break will expose the 68.00 level. A cut through here will set the stage for a run at the 67.50 level. Further down, support resides at the 67.00 level. Its daily RSI is bearish and pointing lower suggesting further weakness. On the upside, resistance resides at the 69.50 level. Further out, resistance comes in at the 70.00 level. A break above here will aim at the 70.50 level and then the 71.00 level followed by the 71.50 level. All in all, CRUDE OIL remains biased to the downside.
DAX Edges Higher As German Inflation Creeps Higher
The DAX index has rebounded in the Thursday session, erasing much of the losses seen on Wednesday. Currently, the index is at 11,744, up 0.24% on the day. On the inflation front, German WPI edged up to 0.4%, matching the estimate. This was the strongest gain in three months. In Brussels, EU leaders are meeting for a second day.
Brexit is a key topic on the agenda at the EU summit, but it’s unlikely that the leaders will issue a draft statement on Brexit, due to the impasse in negotiations. The European leaders sounded pessimistic about reaching a deal, unless Theresa May brings fresh proposals to the table. With only five months until Britain departs the EU, the likelihood of a no-deal scenario is very real. France has published a draft bill that allows the government to impose custom inspections and visa requirements on British visitors, in the event that no deal is reached. There has been little progress on the thorny issue of the Irish border. The EU is insisting that it will not sign a withdrawal agreement with Britain, unless there is a backstop which allows Northern Ireland to remain in a customs union with the EU after Brexit. However, the British government is unlikely to agree to such a move, since it would require regulatory barriers within the United Kingdom. In a conciliatory move, Michel Barnier, chief Brexit negotiator for the EU, offered to extend the transition phase by 12 months, which would leave it in place until December 2021. This would give the sides more time to work on the shape of a new customs union as well as outstanding issues. On the European side, the mood over Brussels is so sour that officials are saying that they may not hold a November summit, unless substantial progress is made in the next several weeks.
The Italian budget has triggered a crisis between Italy and the EU, which has weighed on European markets in recent weeks. However, market sentiment is more positive this week, with Italian stock markets moving higher. Will these gains be short-lived? The budget proposed by Rome increases the deficit to 2.4% of GDP, which breaches EU rules that require lower deficits. The budget will be sent later this week to the Italian parliament for approval. If it is approved, Rome and Brussels appear headed for a collision which could hurt European stock markets as well as the euro.
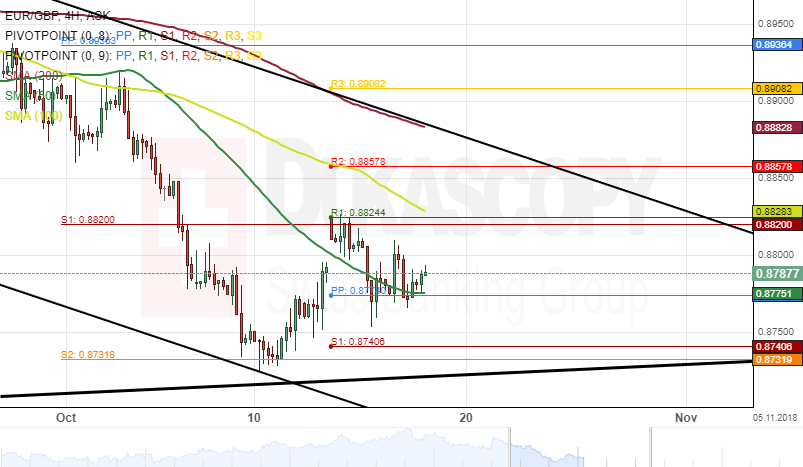
EUR/GBP 4H Chart: Targets At 0.8824
The EUR/GBP exchange rate has been trading in a descending channel since the end of August. The common European currency made a U-turn south from the upper boundary of the descending channel pattern at 0.9086 on August 28 and had since reached a five-month low level at 0.8731.
A support level formed by the 50-hour simple moving average at 0.8775 was providing support for the currency pair during the morning hours of Thursday's session.
If the support line holds, the currency exchange rate could aim at a resistance cluster formed by the combination of the weekly and the monthly PPs at 0.8820 during the following trading sessions.
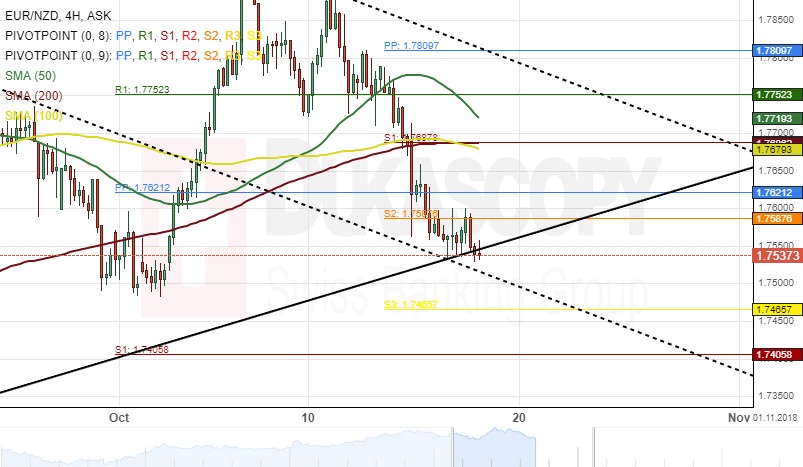
EUR/NZD 4H Chart: Likely Breakout
The single European currency began appreciating against the New Zealand Dollar mid-June when it reversed from the lower boundary of a long-term ascending channel at 1.6600.
Currently, the exchange rate is trading in a two-week descending channel. This pattern can be considered to be a brief retracement down. The pair tested the bottom border of the long-term ascending channel pattern at 1.7550 during the first part of Thursday's session.
A breakout is likely to occur within this session. If this breakout occurs, the currency exchange rate will aim at the weekly S3 at 1.7465 during the following trading sessions.