Sample Category Title
NZDUSD Surpasses Moving Averages, Indicators Signal Some Gains
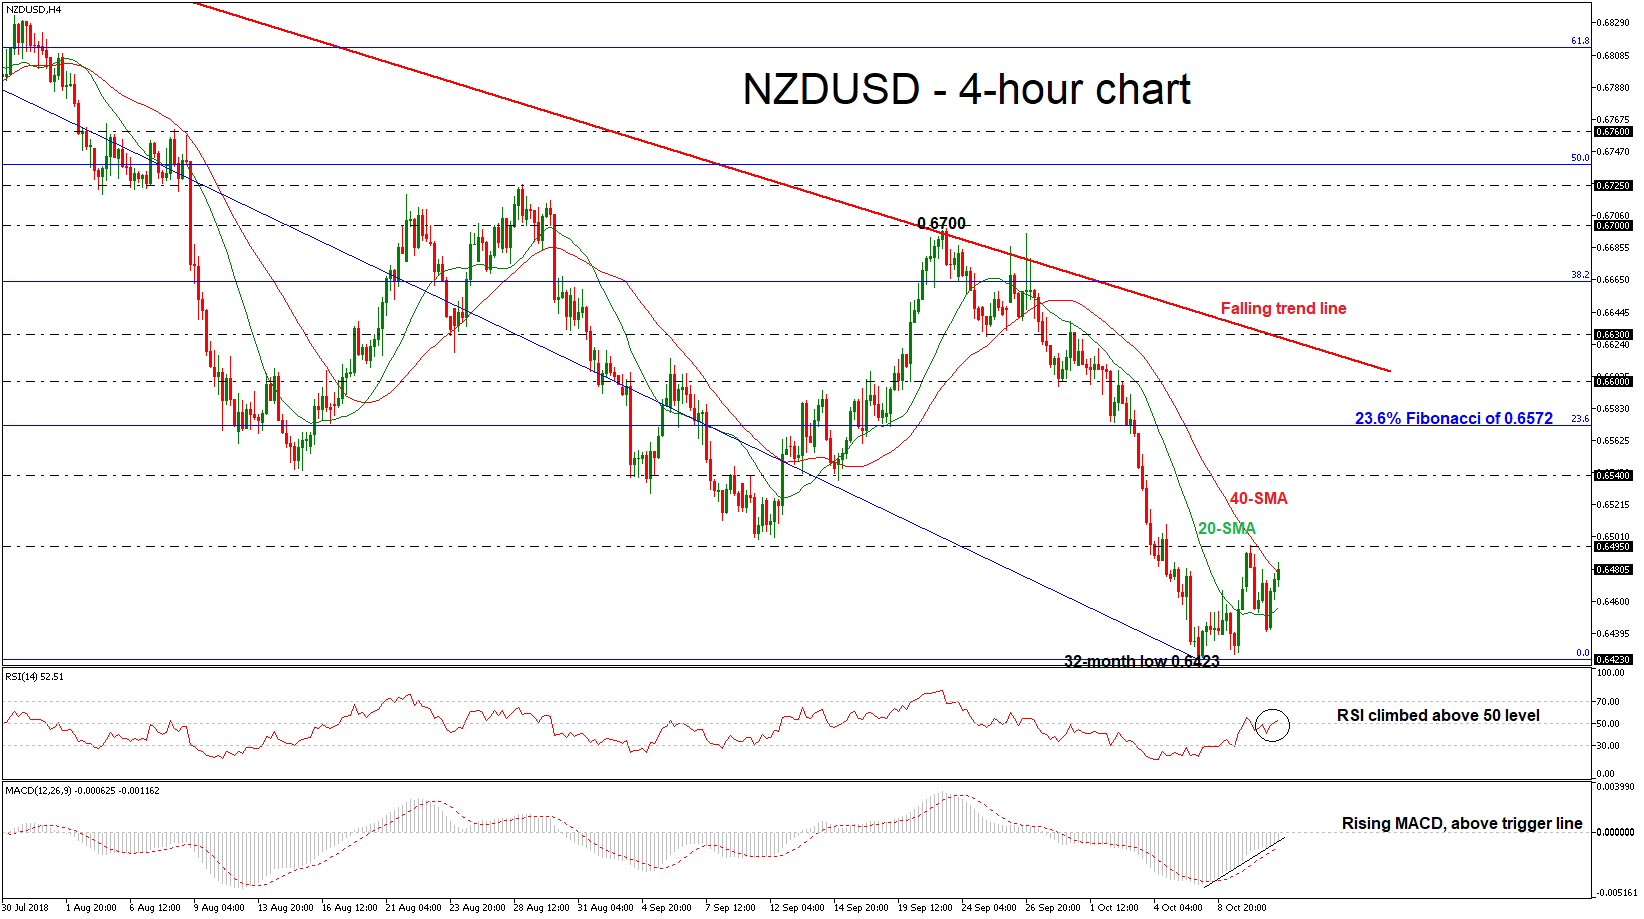
NZDUSD has been neutral over the past week, developing within the 0.6495 high and the 0.6423 low. Meanwhile, the 20-simple moving average (SMA) is sloping to the upside and may record a bullich crossover with the 40-SMA in the 4-hour chart, suggesting some gains. The RSI indicator climbed above the 50 level with strong momentum, while the MACD oscillator remains below the zero line, strengthening its positive movement.
Upside moves are likely to find resistance at the latest high of 0.6495. A run above this level would challenge the 0.6540 hurdle, taken from the low on September 17, while a steeper advance above this level would hit the 23.6% Fibonacci retracement level of the downleg from 0.7060 to 0.6423, around 0.6572.
If the price slip below the 20- and 40-simple moving averages (SMAs), it is expected to lose more ground and meet the 32-month low of 0.6423. More downside extension could post a fresh lower low until the next support coming from 0.6345, where it bottomed on January 2016.
Regarding to the longer-timeframe, NZDUSD has been trading bearish in the past six months after the pullback on the 0.7390 hurdle, but if the price jumps above the falling trend line, this could shift the outlook to a more neutral to bullish one.
USDJPY Records 3-Week Low Near 112.00, Tumbles Towards Ascending Trend Line
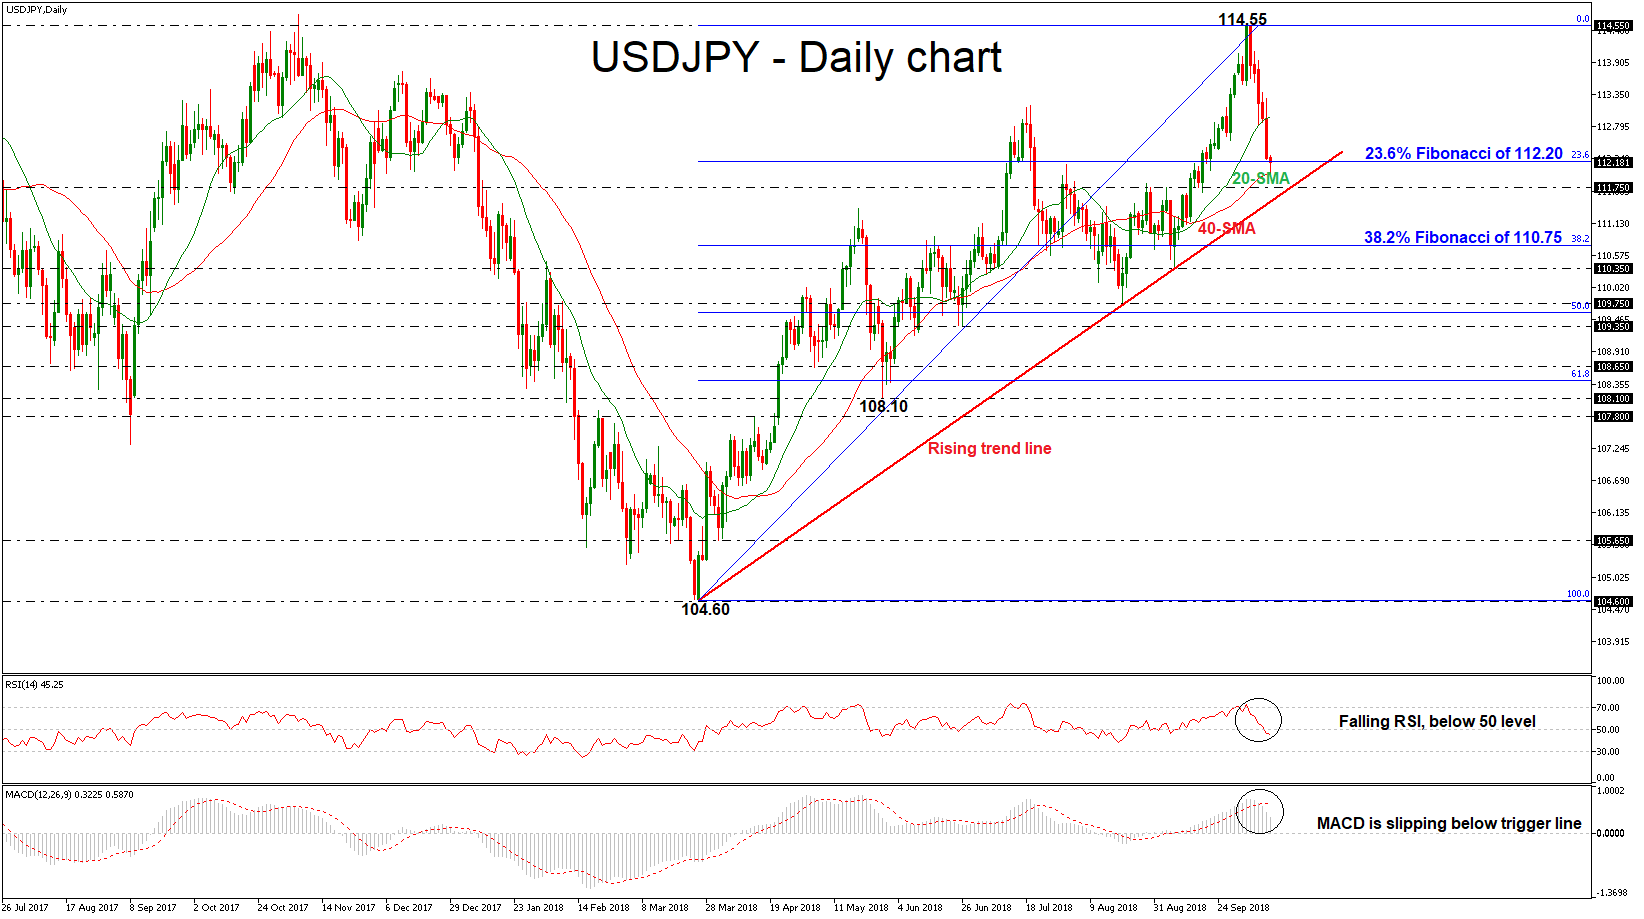
USDJPY has come under fresh selling pressure, creating five consecutive red days, following the touch on the 11-month high of 114.55. The pair tumbled below the simple moving averages in the daily timeframe, while it stands near the 23.6% Fibonacci retracement level of the upleg from 104.60 to 114.55, around 112.20. Earlier today the price recorded a three-week low near the 112.00 handle. The technical indicators continue to send bearish signals, suggesting that the softness in the market is not over yet.
In the short-term, the RSI indicator dived below the threshold of 50 after the bounce off the overbought zone, while the MACD oscillator slipped below the trigger line and is losing momentum but is still above the zero line.
Should prices decline further, the next immediate support is coming from the 111.75 key level, which holds near the medium-term ascending trend line. If there is a penetration of this level, it could open the door for a negative structure until the 38.2% Fibonacci mark near 110.75. More losses could send prices towards the 110.35 barrier, identified by the bottom on September 7.
However, if the market manages to turn up again, the 20-day SMA at 112.95 could offer nearby resistance to the bulls ahead of the 11-month high (114.45). A significant close above the latter would drive the price towards the next obstacle of 115.50, achieved on March 2017, recording a new higher high.
In the medium-term, the outlook remains positive since prices hold above the rising trend line, which has been standing since March 26. If USDJPY breaks below this trend line, it would change the outlook to a more neutral to negative one
The Risk-Off Move This Time Didn’t Support The Dollar
Markets
The fall in US Treasuries finally halted yesterday and edged substantially higher in last US trading hours. European equity markets lost substantial ground but US equities underperformed with losses up to 4% (Nasdaq). At first, US Treasuries didn't profit that much from the US equity correction. However, some kind of safe haven bid kicked in after the US 3-& 10-y auctions. The German bund paired its intraday losses and closed yesterday's session little changed. Yesterday evening, President Trump said that he thinks the Fed has 'gone crazy' as he thinks interest rates are too high. The US yield curve edged lower with the belly of the curve outperforming the wings. Changes ranged between -2.1 bps (30-yr) and -5.3 bps (5-yr). Today, global sentiment will set the tone for bond trading, but US inflation data are important, too. Strong inflation numbers would support the case for a continuation of the Fed's hiking cycle, but might further complicate global investor sentiment. So, it is not evident to see how this will turn out for US yields/bonds. We expect the Bund to catch up with US Treasuries and open substantially higher this morning. Italian BTP futures closed yesterday's session similar to the German Bund: little changed. Italy will test the bond market today as it will sell up to €6.5bn bonds, including a new three-year bond. With the EU and Italy still in deadlock, we expect continued pressure on Italian bonds. Later in the session, the US 30-year auction will also be an interesting barometer for global bond market sentiment.
Yesterday, the risk-off correction (amongst others driven by uncertainty on EM and on the Italian budget), finally reached to US. The risk-off move this time didn't support the dollar. While, the risk-off correction in USD/JPY was ‘logic', the US currency also lost ground against most other major peers. The USD losing interest rate support might have played a role. The jury is still out, but yesterday's price action maybe also suggests markets are considering a re-pricing of US assets. Late in the session, President Trump stepped up its critics on the Fed rate hike policy. The impact of the comments is difficult to measure but this interference with the Fed's independence hardly can be considered USD supportive. The risk-off correction continues in Asia with steep losses across markets (up to 6% in Taiwan). There is some fall-out on EM currencies (e.g. the KRW), but losses are mostly not excessive given the overall sell-off. The dollar remains in de defensive against the likes of the yen or even the euro. Today, global risk sentiment will be the main factor for global FX trading. Data will probably be of second tier importance. In case of a higher than expected US CPI, nervousness might even intensify. It's not sure that this would be a USD supportive. We also keep a close eye at investor interest for the 30-y US Treasury auction. Of late, we had a cautious USD positive bias, putting the risk for EUR/USD to drift further south in the 1.15/1.13 range. In the wake of the overnight movements, we amend our day-to-day EUR/USD bias to neutral. Some more erratic trading might be on the cards if US assets would join the risk-off.
News Headlines
US President Trump shed light upon the Fed and US markets again. He wondered whether the central bank has 'gone crazy' and said they are 'making a mistake' for 'being so tight'. He did not blame them for the current correction in US stocks though, saying it is a 'correction that we've been waiting for a long time'.
While hurricane Michael undoubtedly threatens oil supply, markets now fear the potential impact of weaker global economic growth following IMF downgrades on demand more. API data showing increased oil supplies further underscored a bearish sentiment. Oil prices extend yesterday's losses, falling more than 1.6%.
Starting November 10th, a new US panel can review and block a wider array of foreign investments in American companies creating technology that needs safeguarding for national security reasons. Up until now, only takeovers and controlling stakes were reviewed. The new program also targets joint ventures and smaller equity stakes.
ECB Hansson: Rather risky to be more precise in forward guidance now
ECB Governing Council member Ardo Hansson said urged not to be more specific on forward guidance yet. He said "To be any more precise than that, to lock in a date, to tie our hands would be rather risky". Instead, "when we get closer, we can have another discussion if we need to adjust the language again, but this is not a debate we are going to have just yet."
Separately, another Governing Council member Olli Rehn "core inflation is still rather weak in the euro zone at around 1 percent, as it has been for the last couple of years, so an accommodative monetary policy is still needed in Europe."
Fed Bullard: No need to do more on monetary policy normalization
St. Louis Fed President James Bullard said "with respect to the (monetary policy) normalization, we have already reached a point when policy rates are in a good position." And he suggested that Fed policymakers "don't need to do much more to normalize policy."
Separately, he also welcomed the USMCA North America trade agreement. He said "this is very good news, because it shows that despite the ups and down of negotiations, you can reach a conclusion ...on trade relations." And he hope the US "can get deals like this elsewhere and we might get the uncertainty down on this issue."
GBP/JPY Daily Outlook
Daily Pivots: (S1) 147.66; (P) 148.49; (R1) 148.91; More...
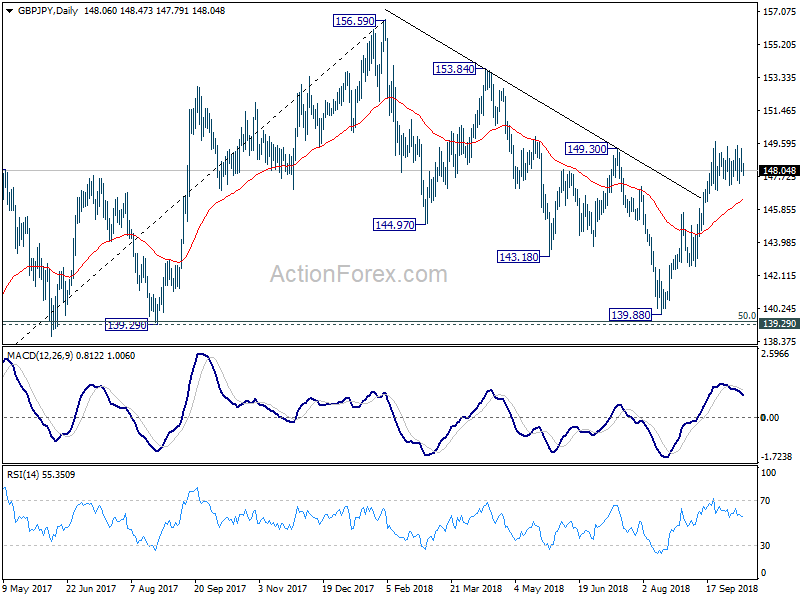
GBP/JPY is still staying in sideway consolidation from 149.70. Intraday bias remains neutral first. Deeper pull back cannot be ruled out. But outlook will stay remain bullish as long as 145.67 resistance turned support holds. On the upside, above 149.70 will target 153.84/156.69 resistance zone next. However, break of 145.67 will suggest that the rebound from 139.88 has completed and turn near term outlook bearish again.
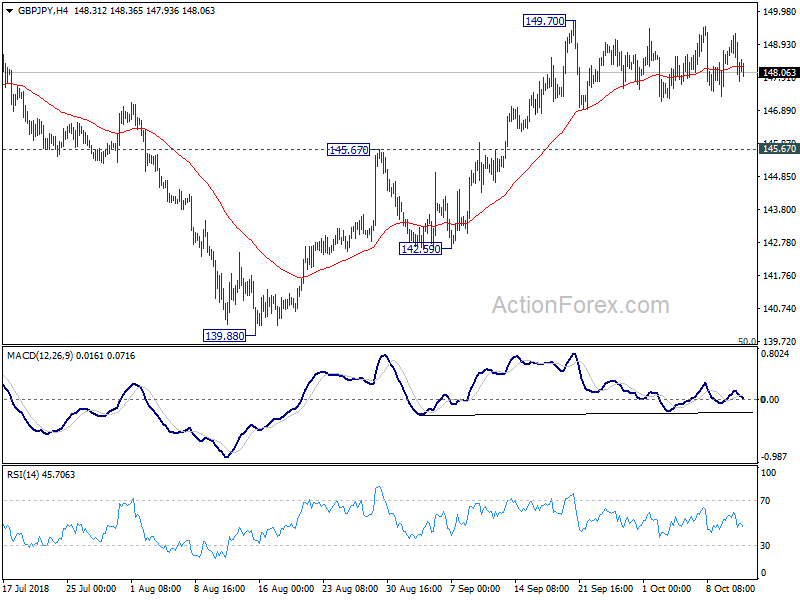
In the bigger picture, current development suggests that GBP/JPY has successfully defended 139.29 cluster support (50% retracement of 122.36 to 156.59 at 139.47). And, the rally from 122.36 (2016 low) is still intact. Such medium to long term rise would extend through 156.96 high. This will now be the preferred case as long as 145.67 near term support holds. However, break of 145.67 will turn focus back to 139.29/47 key support zone.
EUR/JPY Daily Outlook
Daily Pivots: (S1) 128.90; (P) 129.70; (R1) 130.11; More....
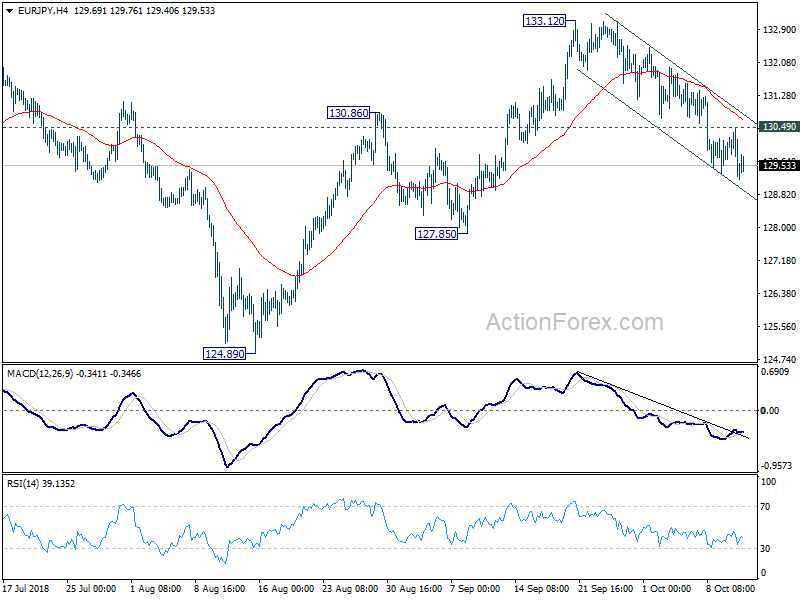
EUR/JPY continues to lose downside momentum as seen in 4 hour MACD. But with 130.49 minor resistance intact, further fall is still expected. Decline from 133.12 should target 127.85 support first. Break there will pave the way to retest 124.89. On the upside, though, above 130.49 minor resistance will turn bias back to the upside for 133.12 instead.
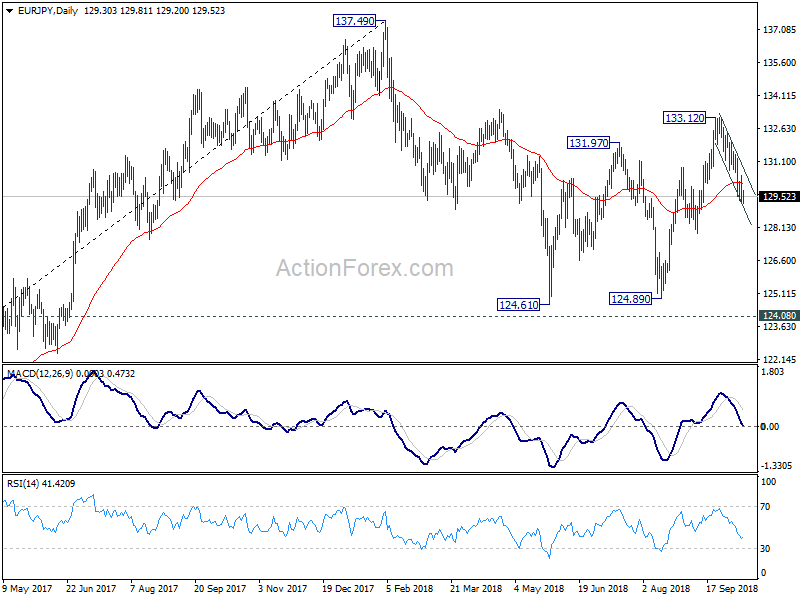
In the bigger picture, current development suggests that EUR/JPY could have defended key support level of 124.08 key resistance turned support. And, the larger up trend from 109.03 (2016 low) is still in progress. Firm break of 137.49 structural resistance will target 141.04/149.76 resistance zone next. This will now be the preferred case as long as 127.85 near term support holds.
EUR/GBP Daily Outlook
Daily Pivots: (S1) 0.8719; (P) 0.8736; (R1) 0.8748; More...
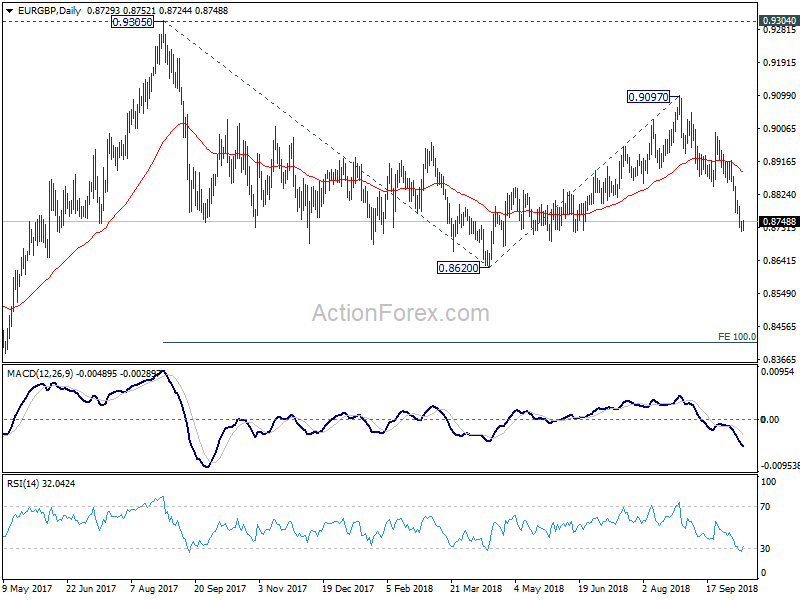
A temporary low is in place at 0.8722 in EUR/GBP with 4 hour MACD crossed above signal line. Intraday bias is turned neutral for consolidation. But outlook will stay bearish as long as 0.8847 support turned resistance holds. Below 0.8722 will extend the decline from 0.9097 for 0.8620 low first. Decisive break there will resume whole down trend from 0.9304. In that case, next target will be 100% projection of 0.9305 to 0.8620 from 0.9097 at 0.8412.
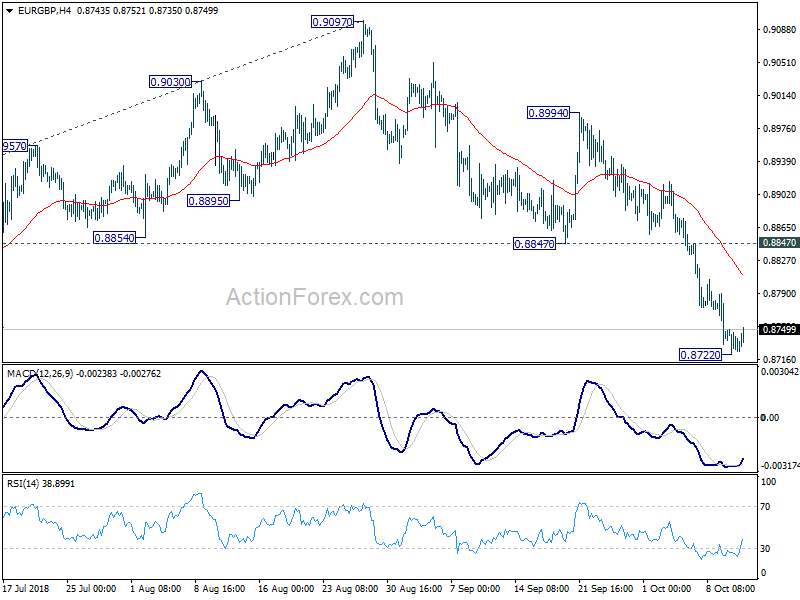
In the bigger picture, EUR/GBP is seen as staying in long term range pattern started at 0.9304 (2016 high). Current development suggests that fall from 0.9303, as a down leg in the pattern, is still in progress. But in case of deeper fall, downside should be contained by 0.8116 cluster support, 50% retracement of 0.6935 (2015 low) to 0.9304 at 0.8120, to bring rebound.
EUR/AUD Daily Outlook
Daily Pivots: (S1) 1.6205; (P) 1.6280; (R1) 1.6415; More....
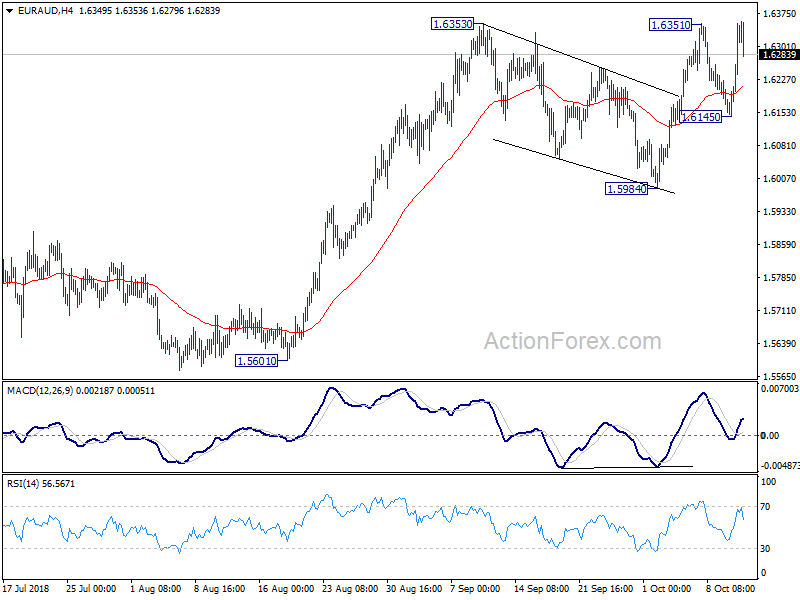
EUR/AUD's strong rebound from 1.6145 revived the bullish case and turn focus back to 1.6353 resistance. Decisive break there will resume larger up trend and target 1.6587 key resistance next. On the downside, however, break of 1.6145 support will turn near term outlook neutral again.
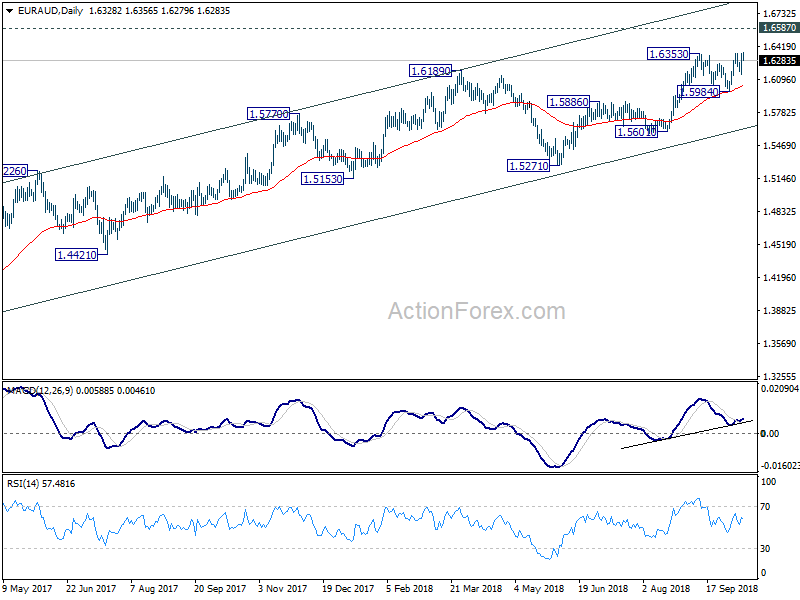
In the bigger picture, up trend from 1.3624 (2017 low) is still in progress. Further rise should be seen to retest 1.6587 (2015 high). Decisive break there will resume the long term rally and target 1.7488 fibonacci level. On the downside, break of 1.5984 support is need to be the first sign of medium term reversal. Otherwise, outlook will remain bullish in case of deep pull back.
DAX Bearish Sequence Calling For More Downside
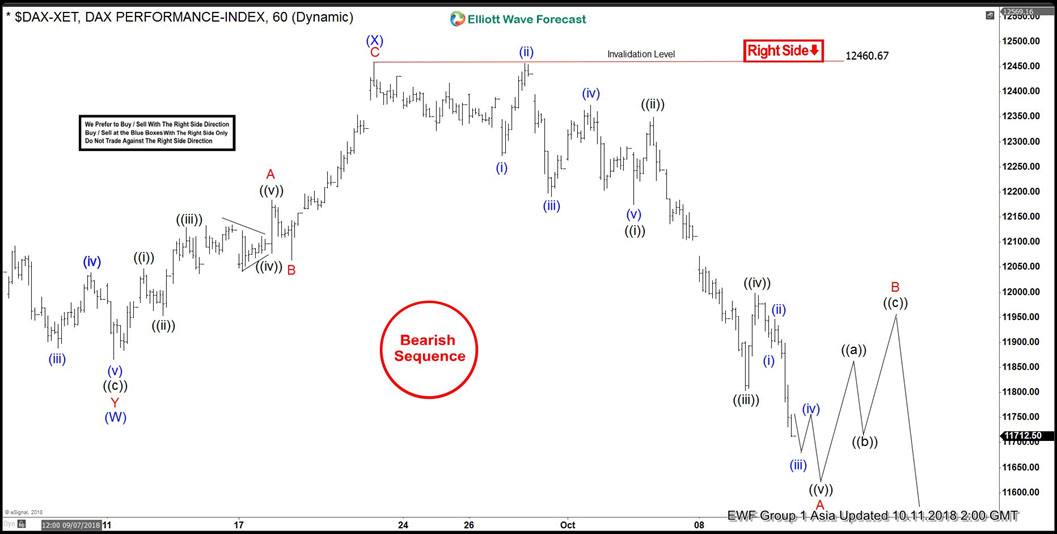
DAX short-term Elliott wave view suggests that the decline to 11865.47 low ended intermediate wave (W). Up from there, the bounce to 12460.67 high ended intermediate wave (X). The internals of that bounce unfolded as a zigzag structure where Minor wave A ended at 12184.41 high in lesser degree 5 waves. A pullback to 12064.41 low ended Minor wave B in 3 swings. While a rally to 12460.67 ended Minor wave C in another 5 waves in lesser degree cycle & also completed intermediate wave (X) bounce.
Down from there, the index has made a new low below 9/11 low (11865.47) confirming the next extension lower taking place. The initial decline from 12460.67 high is unfolding in 5 waves impulse structure where Minute wave ((i)) ended at 12174.69 low. A bounce to 12348.86 high ended Minute wave ((ii)). Then a decline to 11803.19 low ended Minute wave ((iii)). Minute wave ((iv)) bounce ended at 11998.64 high.
Currently, Minute wave ((v)) remain in progress looking to extend lower 1 more time towards 11594.07-11498.45 0.618-0.764% Fibonacci extension area of a Minute wave ((i)) + ((iii)) to complete Minor wave A of a possible zigzag structure. Afterwards, the index is expected to do a Minor wave B bounce in 3, 7 or 11 swings before further downside is seen. We expect sellers to appear in 3, 7 or 11 swings against 12460.67 high.
DAX 1 Hour Elliott Wave Chart