

Sample Category Title
USDJPY Head And Shoulders Triggered
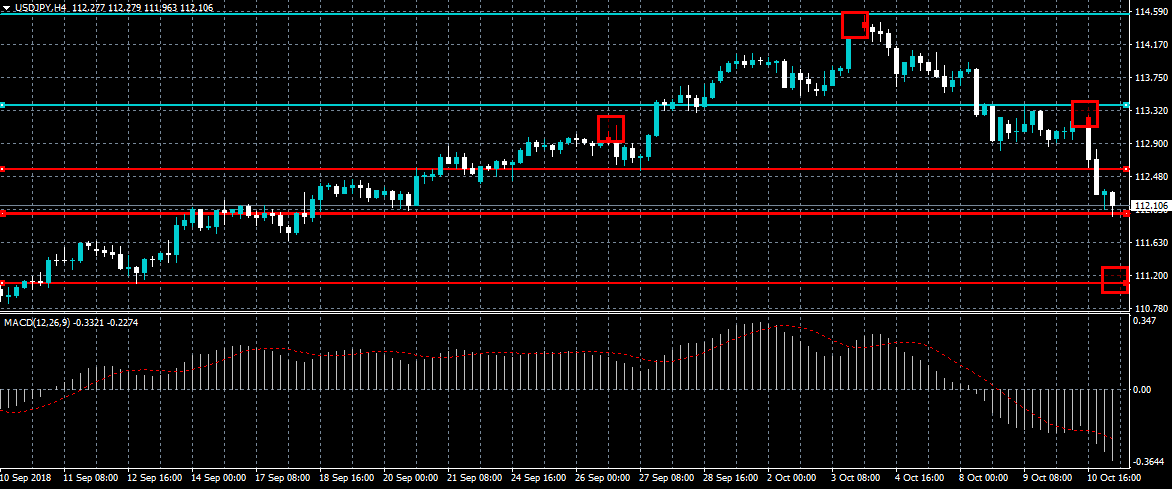
The US dollar continues to tumble lower against the Japanese yen currency, as risk-off trading sentiment and the sell-off in global equity markets worsens. The previously mentioned bearish head and shoulders pattern has been triggered, with the USDJPY pair now strongly bearish below the 112.55 level. Sellers will likely attempt to break the 112.00 support level, while intraday buyers need to stabilize price above the 112.55 level.
The USDJPY pair is strongly bearish while trading below the 112.55 level, key support found at the 112.00 and 111.10 levels.
If the USDJPY pair holds above the 112.00 level, buyers will likely test towards 112.55 and 112.90 resistance levels.
EUR/CHF Daily Outlook
Daily Pivots: (S1) 1.1382; (P) 1.1413; (R1) 1.1438; More...
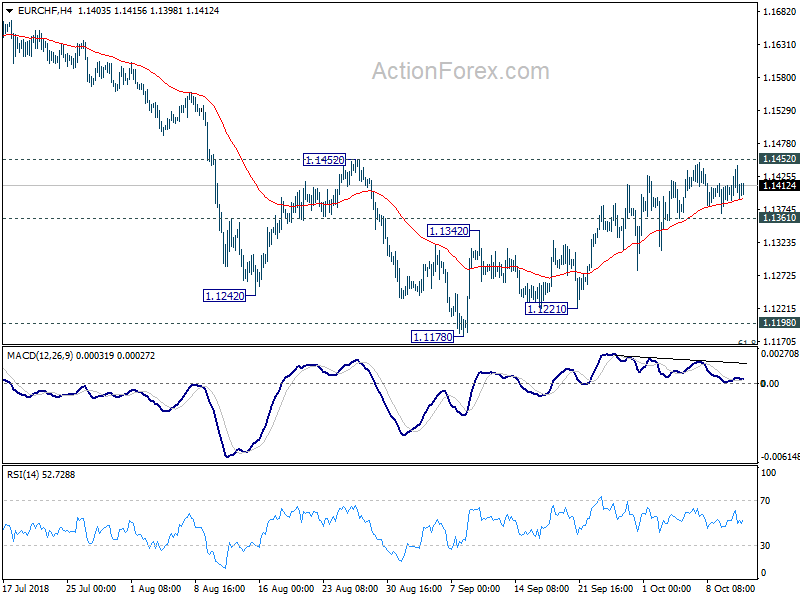
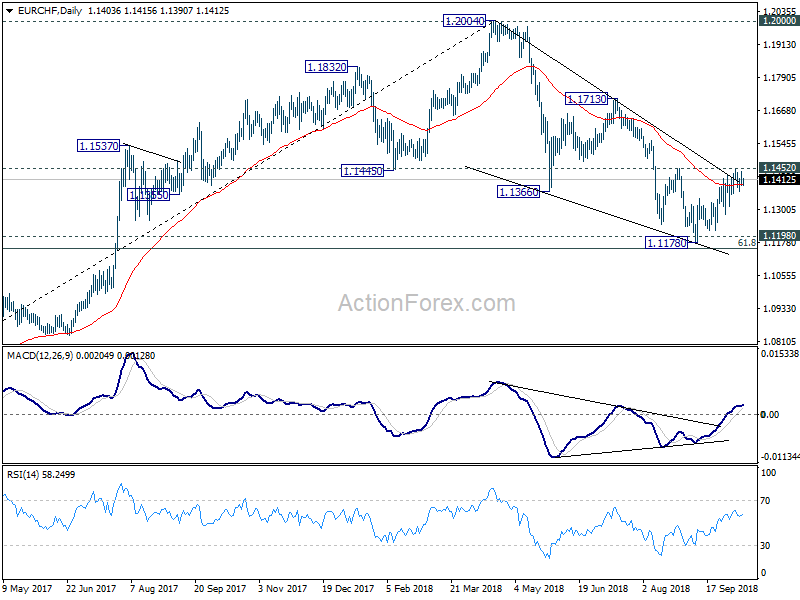
Intraday bias in EUR/CHF remains neutral for the moment. On the downside, break of 1.1361 minor support will suggest rejection by 1.1452 resistance. Intraday bias will then be turned back to the downsides for retesting 1.1154/98. On the upside, decisive break of 1.1452 resistance should confirm bullish reversal, after drawing strong support from 1.1154/98 zone. In that case, outlook will be turned bullish for 1.1713 resistance next.
In the bigger picture, price actions from 1.2004 medium term top is seen as a correction only. Downside should be contained by support zone of 1.1198 (2016 high) and 61.8% retracement of 1.0629 to 1.2004 at 1.1154 to complete it and bring rebound. This cluster level is in proximity to long term channel support (now at 1.1234) too. A break of 1.2 key resistance is still expected in the medium term long term. However, sustained break of the mentioned support zone will mark reversal of the long term trend. In that case, 1.0629 key support will be back into focus.
EURUSD Strongly Bullish Above 1.1553 Level
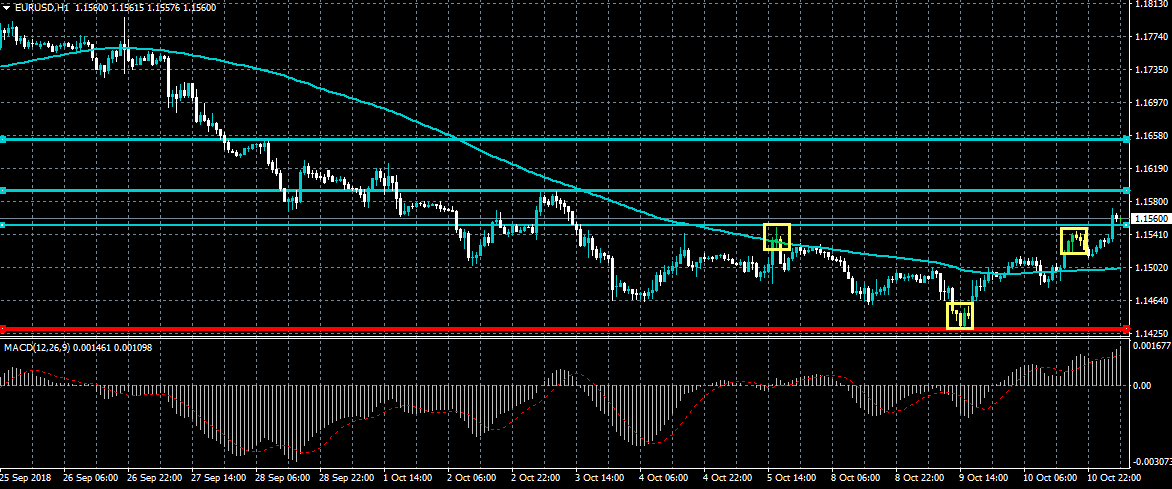
The euro currency has moved well above 1.1553 level against the greenback after the US dollar index was sold sharply lower on Wednesday. The EURUSD pair is likely to advance higher while trading above the 1.1553 level, a bullish inverted head and shoulders pattern is now clearly visible with a large upside projection. Buyers will look for further gains towards the 1.1650 resistance level, while sellers need to force price below the 1.1500 level.
The EURUSD pair is intraday bullish while trading above the 1.1490 level, key technical resistance is now found at the 1.1600 and 1.1650 levels.
If the EURUSD pair declines below the 1.1553 level, sellers may target the 1.1530 and 1.1500 levels.
A Sea Of Red As Cryptocurrencies Slide
The price of cryptocurrencies declined sharply overnight. Bitcoin, Ethereum, Ripple, and Litecoin declined by more than 5% each. Bitcoin fell by 400 points while ETH declined by more than 22 points. The market capitalization of cryptocurrencies tracked by CoinMarketCap declined to $185 billion. This was the biggest sell-off in recent months.
Tensions in the market started last week when ADP released jobs numbers for the USA. The numbers showed that the private sector had accelerated gains. This was confirmed on Friday when official government data showed that the unemployment rate had declined to 3.7%. As a result, the US treasuries started a sell off as traders started to worry about rising interest rates. This was coupled with the fiscal problems in Italy. Yesterday, the New York Times wrote that if the trade war continues, China could be forced to stop buying US treasuries.
The decline of the crypto market somewhat erased the thinking that digital currencies could be used as a safe haven in times of increased risks. In the past, crypto enthusiasts have called Bitcoin a digital gold which traders rush to when risks increase.
Yesterday, Hurun published its list of the richest people in China. For the first time, it showed that eight people in the list were involved in the cryptocurrencies industry. Some of them were the founders of Bitmain, Binance, and OkCoin.
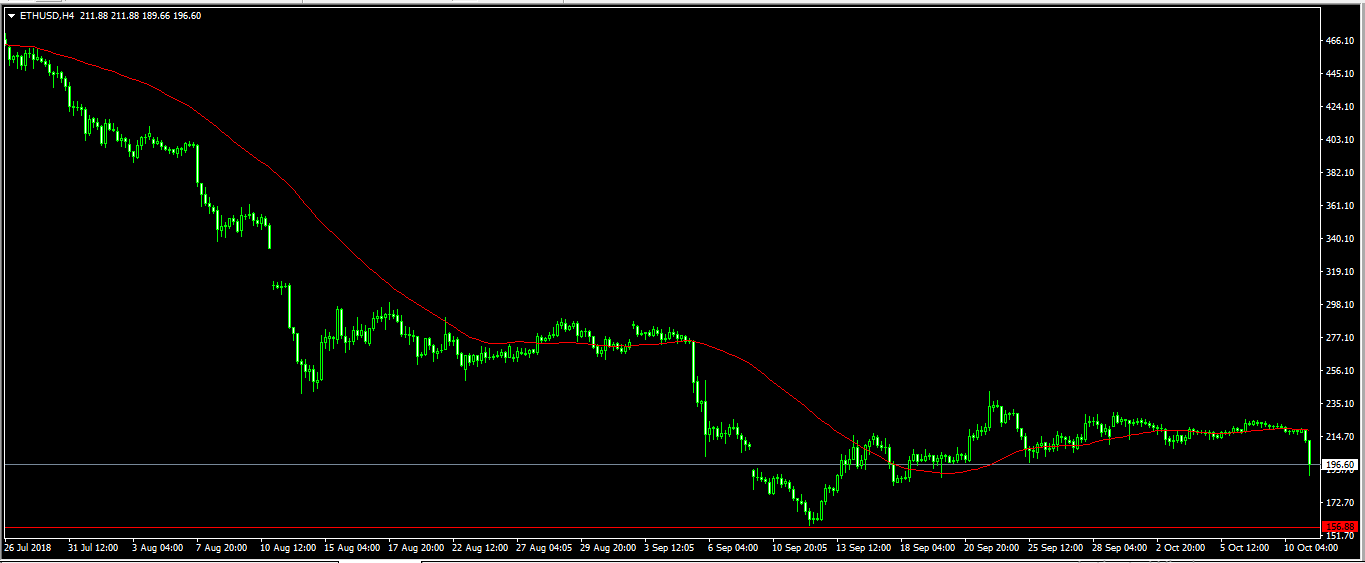
The ETH/USD pair declined to a low of 109.5. This was the lowest level since September 20. It was also a major drope because the pair declined below the important level of 200. As shown on the four-hour chart below, the pair is trading within a narrow range. Therefore, if the new downward momentum continues, the pair will likely test the previous low of 156.
World Markets Fall As Traders Show Concern About Slowed Global Growth
Yesterday, US stocks declined sharply with the Dow Jones Industrial Average and Nasdaq declining by more than 800 and 200 points respectively. Overnight, the futures market continued the downward momentum with the Dow and Nasdaq falling by 350 and 320 points respectively. These were the sharpest declines since early this year and were associated with the recent prospects of slowed growth and worries about treasury yields. The decline in US stocks contributed to the futures drop with the DAX and Stoxx set to open 60 and 70 points lower. Asian stocks had big declines with the Hang Seng, Nikkei, and Shanghai Composite declining by 900, 1000, and 100 points respectively.
The US dollar index declined sharply overnight dropping by more than 30 points. This week, the gains by the US dollar have been hampered by the rise of the euro and sterling. The gains by the latter two are mostly because of traders’ hopes that a Brexit deal will be near. On Tuesday, it was reported that the EU and the UK were close to a compromise. A deal is expected to be made as early as on Monday next week. Such a deal will be positive for the market, which seems to favor a soft Brexit instead of a hard one.
The Japanese yen strengthened against the US dollar in overnight trading. The gains by the yen were mostly because of its role as a safe haven when risks increase and because of positive data from Japan. In September, bank lending rose at an annualized rate of 2.3%, which was better than the 2.1% traders were expecting and the August growth of 2.2%. An increase in bank lending is a positive sign for the market because it helps to stimulate inflation. In addition, the PPI rose by 3.0% which was higher than the 2.9% that traders were expecting. The PPI shows the change in price of goods bought by companies.
EUR/USD
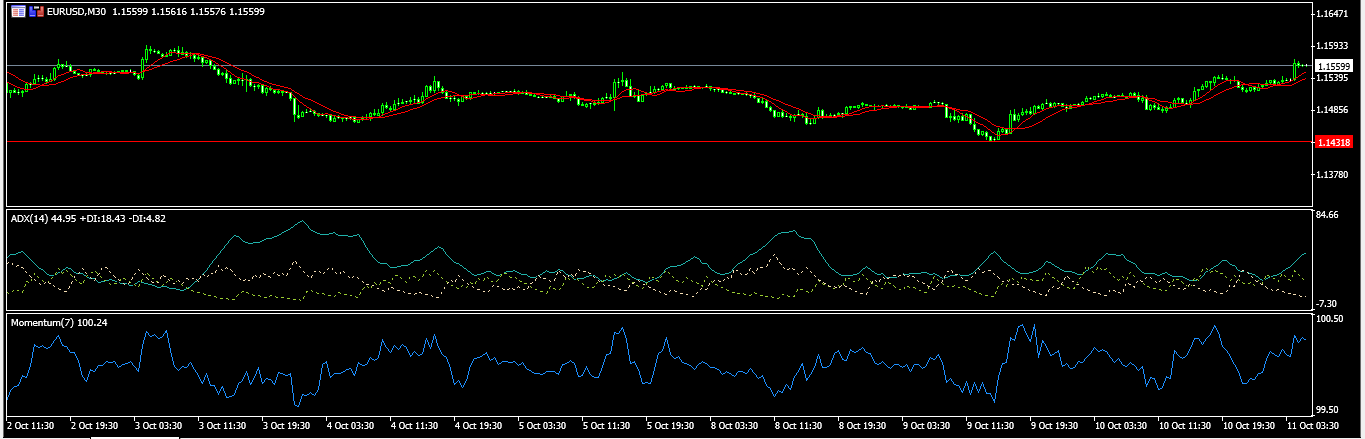
On Tuesday, the EUR/USD pair declined to a low of 1.1430. It then started an upward rally that continued overnight when it reached an intraday high of 1.1570. This upward trend will continue. This is confirmed by the Average Directional Index which is currently at 44. The ADX is an indicator traders use to measure the strength of the trend. It is also confirmed by the crossover of the 7-day and 14-day SMA and the momentum indicator as shown in the four-hour chart below.
GBP/USD
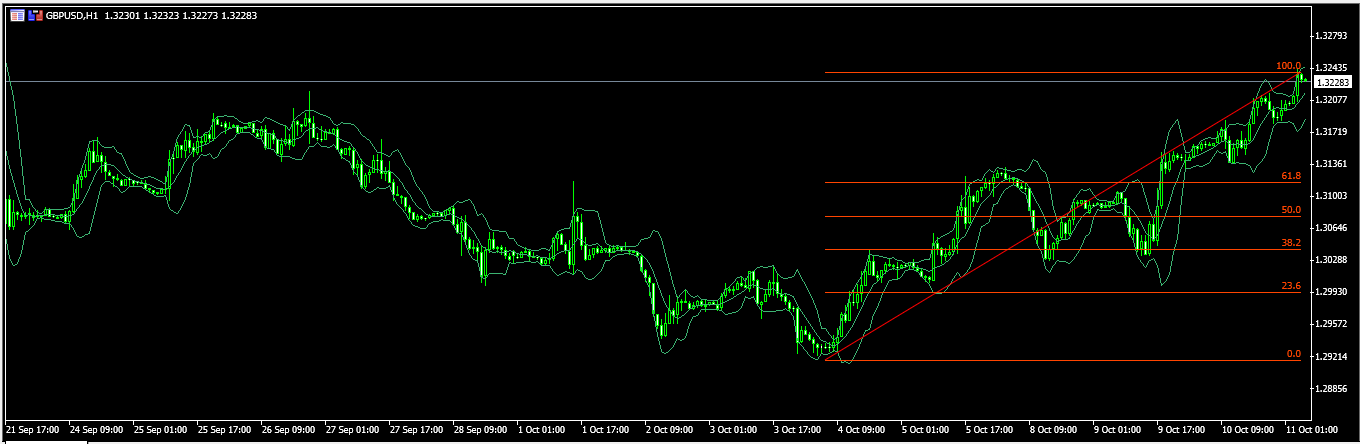
The GBP/USD pair continued the upward trend as the dollar weakened and as traders continued to hope for a Brexit compromise. It reached a high of 1.3245 in the Asian session. In the hourly chart shown below, the pair is trading in a cup and handle pattern and overnight, it completed the first part. This is an indication that the pair could see a minor decline to the 1.3100 level which is an important support level and the 50% Fibonacci Retracement level.
USD/JPY
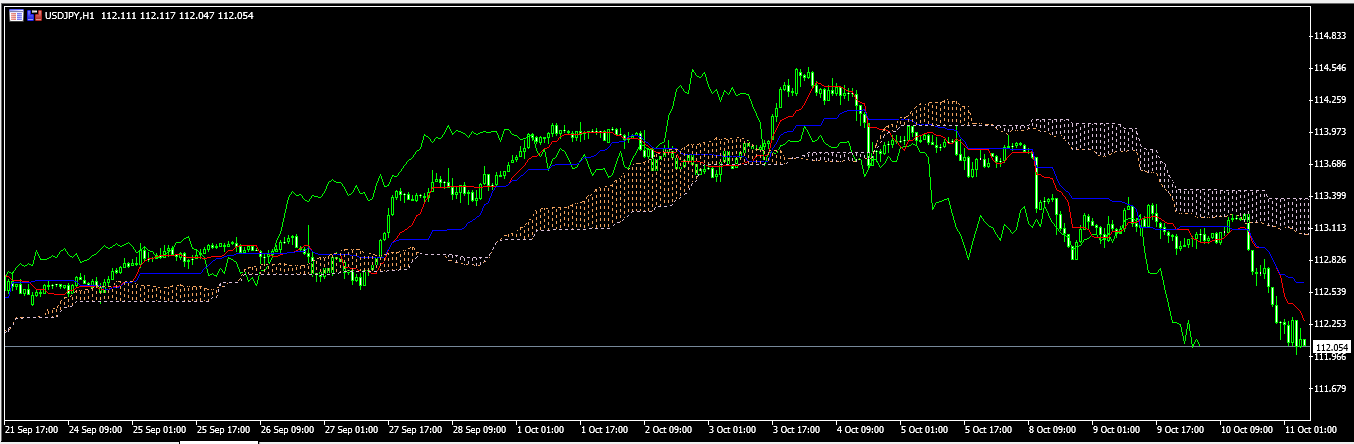
The USD/JPY pair continued the declines started last week when it reached 114.53. Today, the pair reached a low of 112.00, which us the lowest level since September 20. The pair is forming an inverted cup and handle pattern. The Ichimoku Kinko Hyo indicator points to a continued decline of the pair. The pair will continue to decline ahead of important US inflation numbers.
EUR/GBP Direct Drop Aiming For S2 Pivot
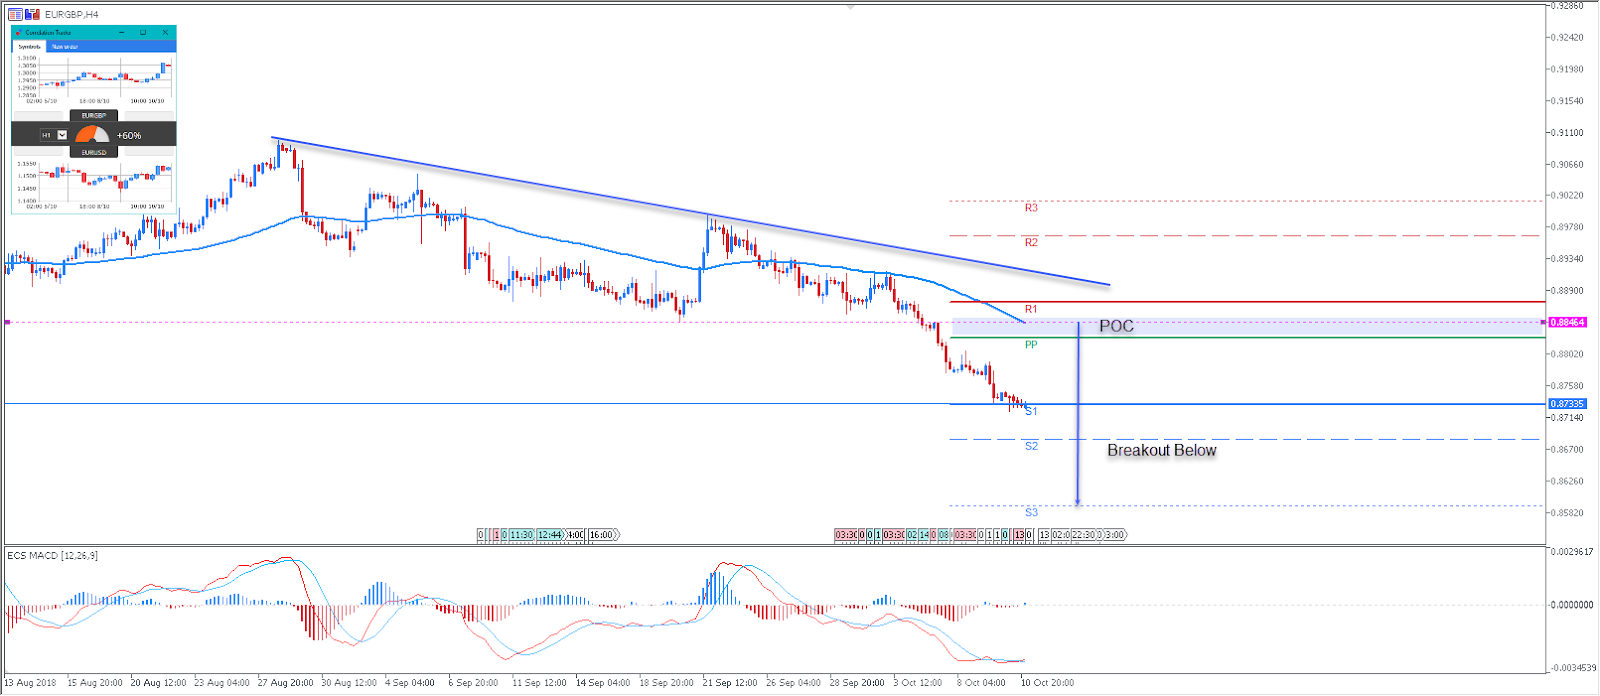
The EURGBP currency pair is having a retracement after successfully rejecting from the trend line, making a bearish zigzag pattern. Currently the price is hanging around the S1 Support. The BOE is expected to provide the BOE Credit Conditions Survey soon. The report includes detailed data on secured and unsecured lending to households, small businesses, non-financial corporations, and non-bank financial firms, and It's correlated with spending and confidence. The EUR/GBP currency pair should move with a a higher volatility after the release. Don't forget to follow our Forex calendar for all regular updates on the news,economic announcements, forecasts and much more.
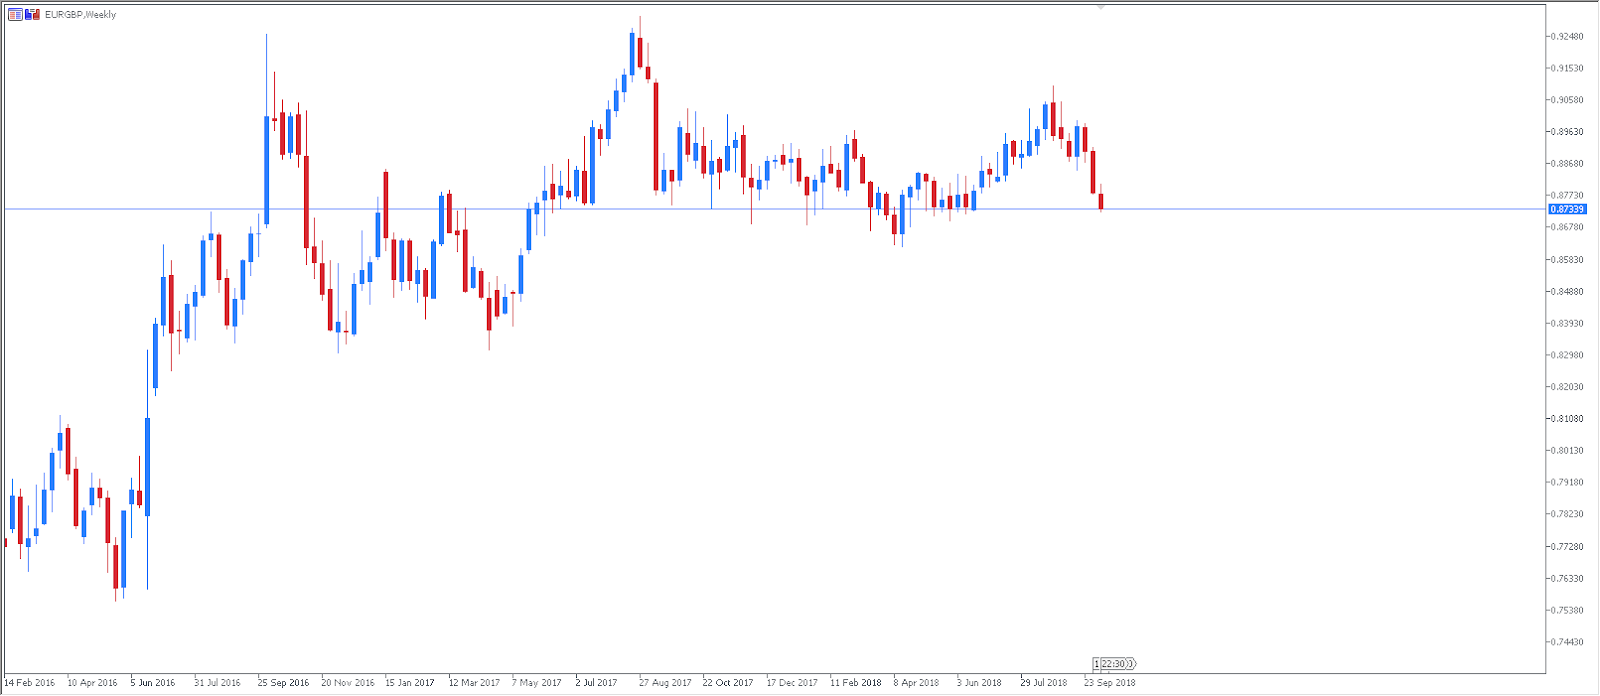
Technically, the EUR/GBP currency pair should drop further. In the case of any retracement towards the POC, the price could reject from the 0.8825-45 zone. Targets are 0.8735 and 0.8684. Break below 0.8680 should target 0.8590. Only above R1 and the blue trend line the the price might move into a bullish mode. Watch for any retracement or rejection, and always pay attention to price action before you start making new entries. Never chase the price, and be patient.
Pivot Lines - Weekly Support and Resistance
POC - POC - Point Of Confluence (The zone where we expect the price to react - aka the entry zone)
USD/JPY Triangle Pattern Waiting For A Decisive Breakout
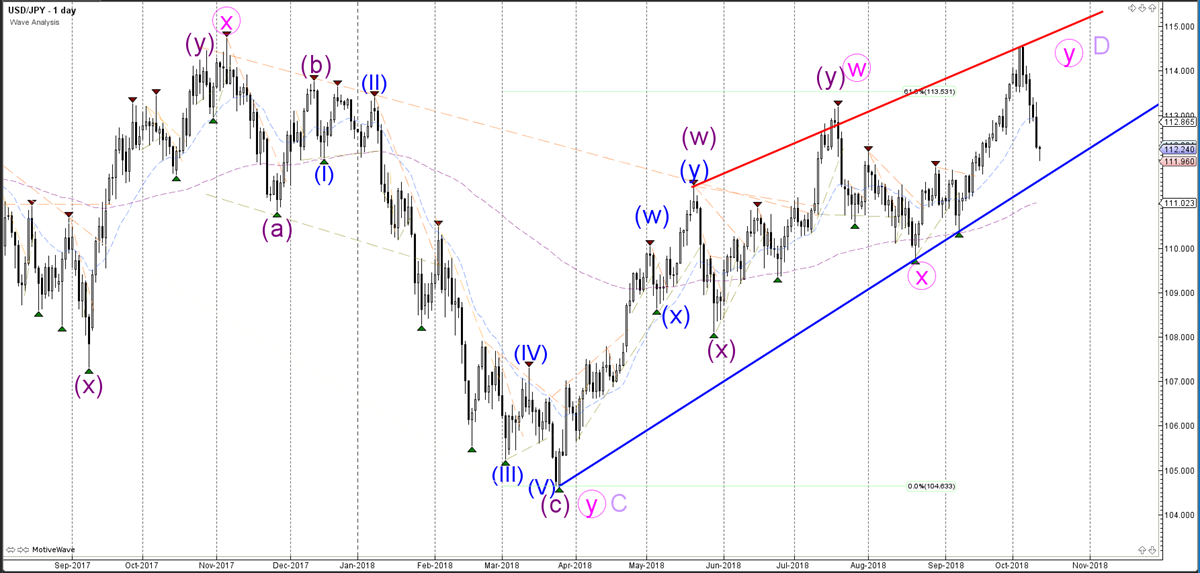
The USDJPY currency pair is testing the 61.8% Fibonacci retracement level, which is the very last support level that could fit within a potential wave 4 (blue) pattern. A bearish break indicates a bearish swing and a new wave pattern, whereas a bullish bounce could still lead to a bullish continuation within wave 5 (blue), if the price manages to break above the resistance trend line (red).
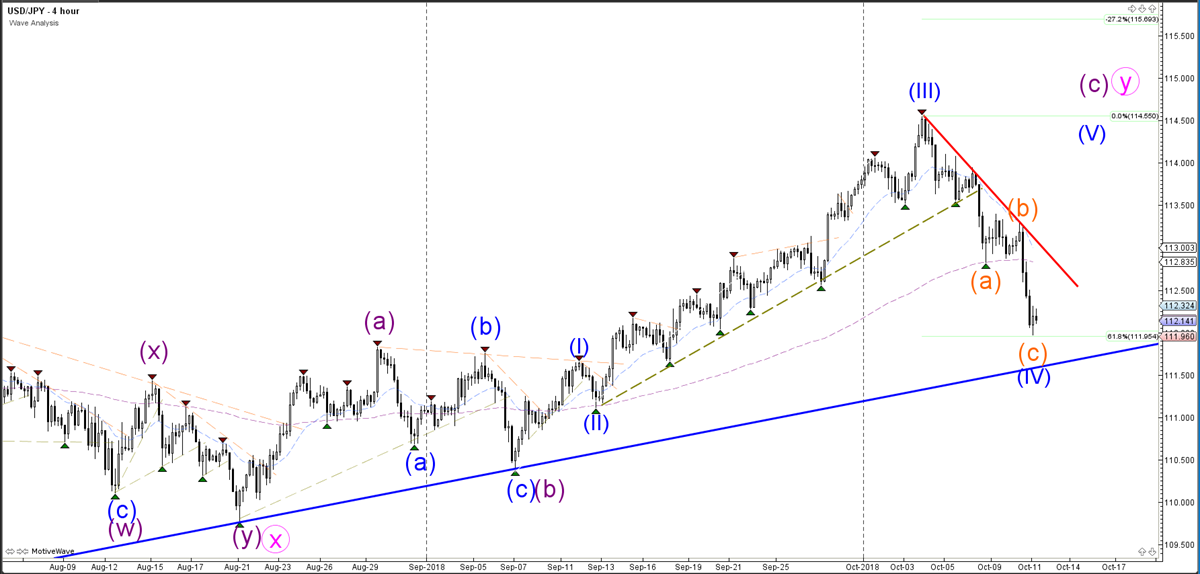
The USD/JPY is showing indecisive candlestick patterns at the 61.8% Fibonacci level. Corrective price action could however indicate a change in wave patterns, and could be a wave 4 (red), whereas bullish price action will need to break above the resistance trend line (red) to confirm a potential wave 4-5 (blue).
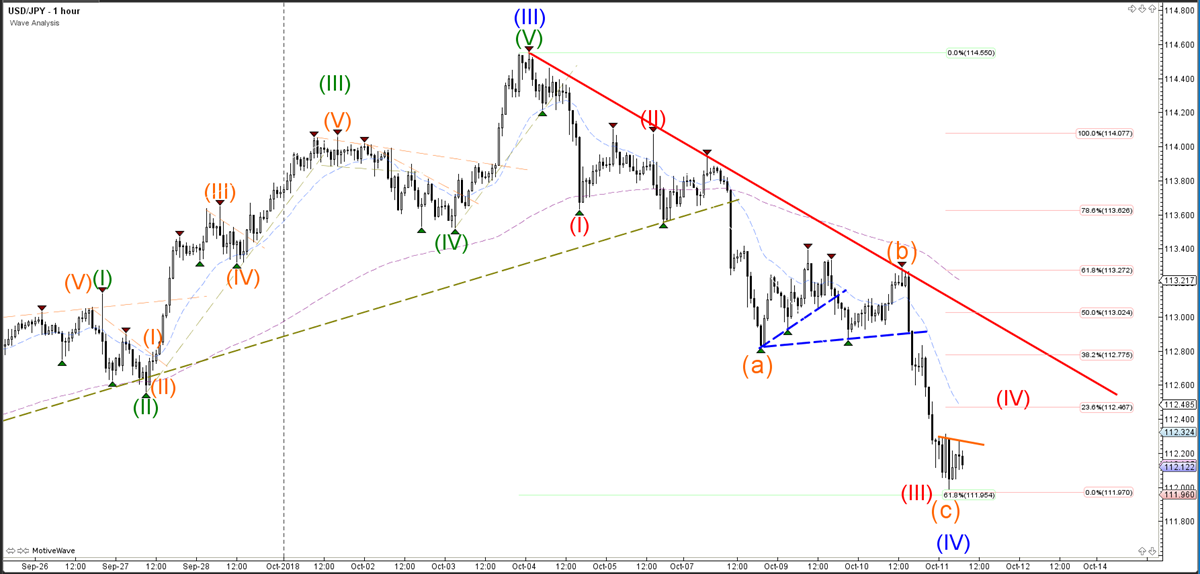
The USD/JPY currency pair is falling quickly which makes a wave 4 pattern less likely. The recent high is probably the end of the wave Y (pink) of the wave D (purple), but a break below the support trend line (blue) would confirm that.
GBP/USD Bullish Momentum Remains In Key Resistance Zone
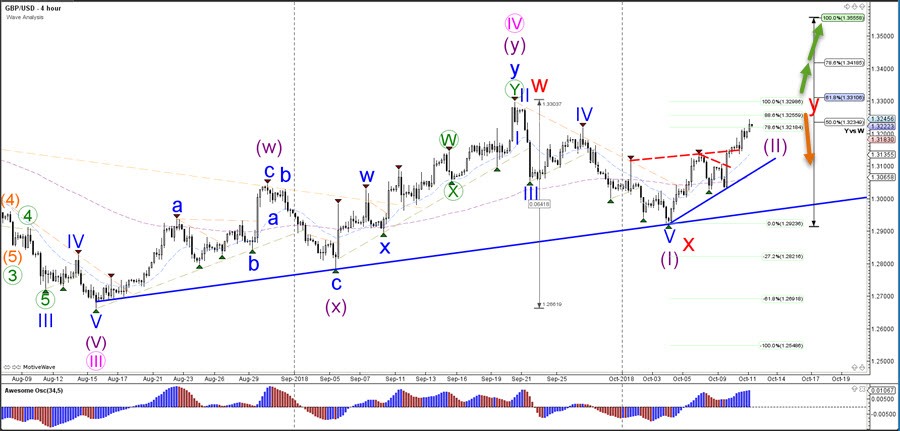
The GBP/USD has reached the deeper Fibonacci retracement levels that could act as potential resistance.The Fibs are a key decision zone for a break or bounce.
The GBP/USD invalidates the wave 1-2 (purple) pattern if price manages to break above the previous top and 100% Fibonacci level. In that case a WXY (red) could be valid. A bearish bounce and breakout below the support trend lines (blue) could confirm the potential reversal and wave 1-2-3 (purple) pattern.
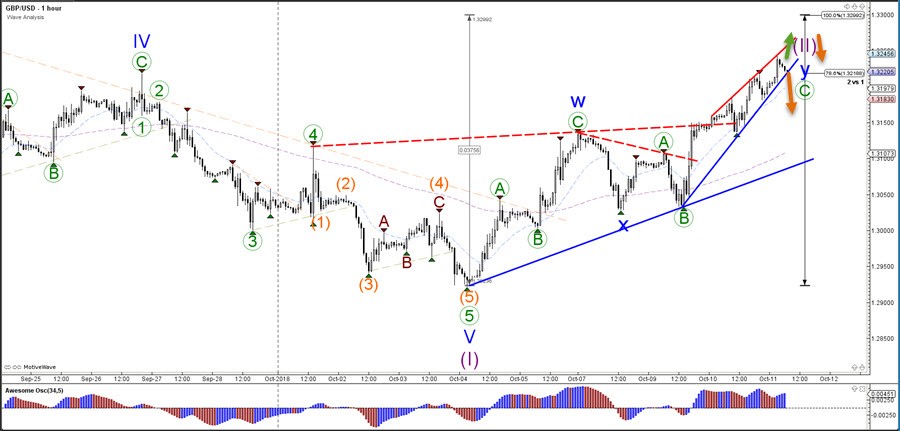
The GBP/USD could be completing a wave C (green) of a larger ABC (green) pattern within wave 2 (purple). The Fibonacci retracement levels of wave 2 (purple) remaincritical levels for a bullish breakout or bearish bounce / reversal.
Is It The Beginning Of The End?
On Wednesday, U.S. equity markets suffered their worst selloff since last February. Volatility spiked 44%, trading at levels last seen in March. Treasury yields retreated slightly with 10-year bond yields sliding 10 basis points from a 7-year high. Growth stocks were hit hardest with a selloff in Tech companies dragging the Nasdaq Composite down 4.1%. The Dow Jones Industrial Average and S&P 500 were not far behind falling 3.15% and 3.29% respectively.
Has the Great Bull Market reached its end?
So many voices may begin suggesting that the longest bull market in history has come to an end. However, we experienced a worse selloff last February when the S&P 500 fell more than 10% in -“correction territory” during seven trading days. Back then the blame fell on strong economic data after wage growth grew 2.9%, suggesting that inflationary pressures were building, and the Fed would need to tighten monetary policy faster.
This time around it doesn’t seem a lot different. The only difference is that the reaction to higher interest rates was a little delayed. Bond yields have spiked 40 basis points on the 10-year Treasuries since the beginning of September.This has called into question the valuation of many growth stocks, particularly Tech. It shouldn’t be very surprising to see this kind of reaction when the required return of equity, akey component in equity valuations, soars in a short time frame.
So far, we may describe the selloff as profit taking with many investors reconsidering their asset allocation weightings in their portfolios. Some investors will also be watching key technical levels, given that the S&P 500 is testing the 200 days moving average. This key support level has been tested three times in 2018 and managed to bounce again higher. However, a close below for two or three days may intensify the selloff for a couple of more days.
"The problem in my opinion is Treasury and the Fed. The Fed is going loco and there's no reason for them to do it. I'm not happy about it", said U.S. President Donald Trump.
While I agree with President Trump that Wednesday’s selloff is the fault of the Fed, he should be reminded that the trade war he started with China and re-imposing sanctions on Iran is also to blame. His actions helped building inflationary pressures and the Fed cannot stand still when it sees the economy overheating. A steeper selloff in equity markets will probably lead to a pause in hiking rates, but the Fed will be more concerned about the overall economy performance than just equity prices.
Now it’s up to the earnings season which kicks off on Friday to convince investors that earnings are still robust and the outlook is rosy. If corporate America paints a gloomy picture due to trade disputes, higher import prices, a stronger dollar, and other variables, this will confirm that stocks have topped out for 2018.
Asia Market Update :Worst Case Scenarios Abound
Oil Update
Brent crude continues moving sharply lower on today triggered by the deeper sell-off on global equities on concerns rising interest rates could severely derail global economic growth. But more specifically DOE monthly Short-Term Energy Outlook revised non-OPEC supply higher for 2019, which is leading more support to the supply side of the equations.
So with prospects of lower demand and additional supply in 2019, there has been no place to go but lower as bullish bets are heading for the exits with nary a substantial bid in sight.
Now if we get a bearish surprise in tomorrows DOE weekly status report, selling will intensify two folds. With tail risk mounting, bullish sentiment has evaporated quickly.
Equity update
Equity markets were pulverised today as investors remain in full out retreat and even the most pessimistic of equity bears are still in shock by the sheer magnitude of the move. This meltdown isn't just a mild case of the sniffles suggesting the latest sneeze from the US equity market could morph into a global markets pandemic.
Fedgonecrazy
Presidents Trump's scathing and ramped up attack on the Fed has the dollar bulls retreating as even the hint of policial interference on monetary policy is unsettling also if it doesn't lead to the Feds to taking their foot off the gas. But if these higher US rates are trigger more than risk aversion and this move turns into the next significant correction, it could give the FOMC some pause of a cause.
Yuan
Speaking of worse case scenarios
USDCNY fixed at 6.9098 today, +26 pips from last fixing and -96 pips from the previous closing at 6.9194 on 16:30 Beijing time as the counter-cyclical mechanism takes effect, but higher than everyone expected. So, another dubious fixing. Traders aren't reading much ambiguity in today setting which is little more than a call to action for Yuan bear. The Pboc appears to be in little rush to steam the weakening tide. Despite the apparent risk from capital outflows and more equity liquidations.
The Yuan has such a far-reaching influence on regional markets but even more so as the markets are becoming very suspicious of Pboc currency policy that in the face of being declared a currency manipulator, they could discard the YCC and let the currency go (weaker)
It's potentially destabilising for global markets as it could trigger colossal liquidation in China equities and will trigger capital outflows.
The tail risk if they did for shock value, even as a temporary retaliation to the US Treasury accusations. Eventually, they would need to intervene.
However, instead of using reserves they could sell US treasuries to raise dollars to sell back to the currency markets(USDCNH) creating a nasty feedback look that will trigger broader-based US bond markets sell-off and more equity collapse