

Sample Category Title
EUR/JPY Could Extend Slides Below 129.50
Key Highlights
- The Euro declined recently and broke the 130.80 support against the Japanese Yen.
- There is a major bearish trend line in place with resistance at 130.60 on the 4-hours chart of EUR/JPY.
- Recently in Japan, the Machinery New Orders posted a growth of 6.8% in August 2018 (MoM).
- Today, the US Consumer Price Index for Sep 2018 will be released, which is forecasted to increase 0.2% (MoM).
EURJPY Technical Analysis
The Euro made many attempts to break the 133.00 resistance area against the Japanese Yen, but failed. The EUR/JPY pair started a downside move and broke the 132.00 and 131.20 support levels.
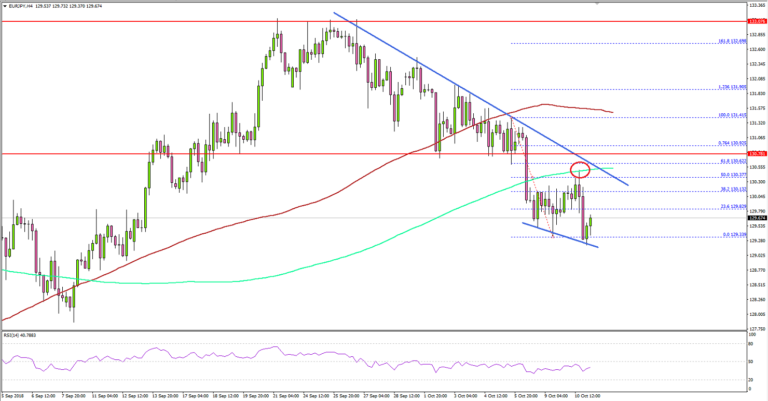
Looking at the 4-hours chart, the pair came under bearish pressure after it broke the 130.80 support and the 100 simple moving average (red, 4-hours). The pair even declined below the 130.00 support and traded towards the 129.25 support.
A low was formed at 129.33 and later the pair started an upside correction. The pair traded higher and cleared the 38.2% Fib retracement level of the last drop from the 131.45 high to 129.33 low.
However, there are many hurdles for buyers near the 130.60 and 130.80 resistance levels. There is also a major bearish trend line in place with resistance at 130.60 on the same chart.
Moreover, the 61.8% Fib retracement level of the last drop from the 131.45 high to 129.33 low is near the 130.62 level, which is likely to act as a strong resistance.
Therefore, as long as the pair is below the 130.60 and 130.80 resistance levels, it remains at a risk of more losses in the near term.
On the downside, an initial support is near the 129.50 level, followed by 129.25. Below these two, the EUR/JPY pair is likely to accelerate losses towards the 128.40 level.
Economic Releases to Watch Today
- US Initial Jobless Claims – Forecast 206K, versus 207K previous.
- US Consumer Price Index Sep 2018 (MoM) – Forecast +0.2%, versus +0.2% previous.
- US Consumer Price Index Sep 2018 (YoY) – Forecast +2.4%, versus +2.7% previous.
- US Consumer Price Index Ex Food & Energy Sep 2018 (YoY) – Forecast +2.3%, versus +2.2% previous.
Asia in crisis mode after US stock crash, a look at HSI
Following the stock market crash in the US, Asia is also in crisis mode. At the time of writing, Nikkei is down -3.89%, Singapore Strait Times is down -2.7%, and China Shanghai SSE is down -4.52%. SSE has now broken 2016 low at 2638, which is a key support level, not for trade war, but for the crash in the US.
Hong Kong HSI gapped down at open and is now down over -1000 pts, or -3.84%.
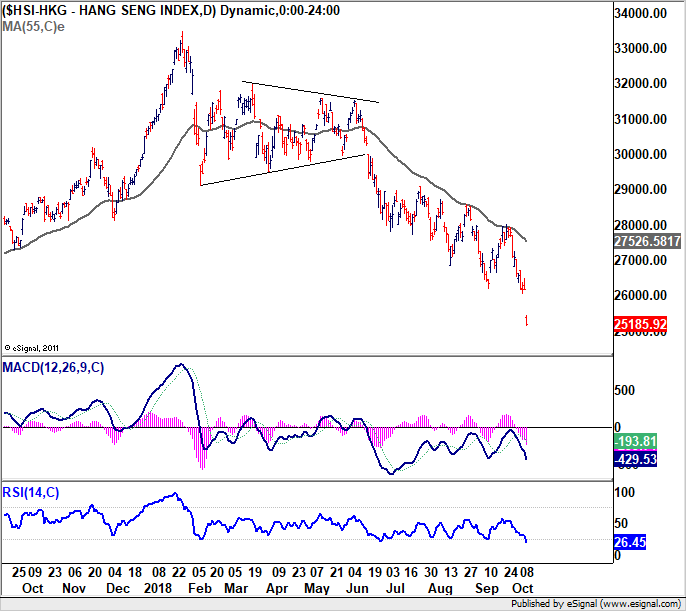
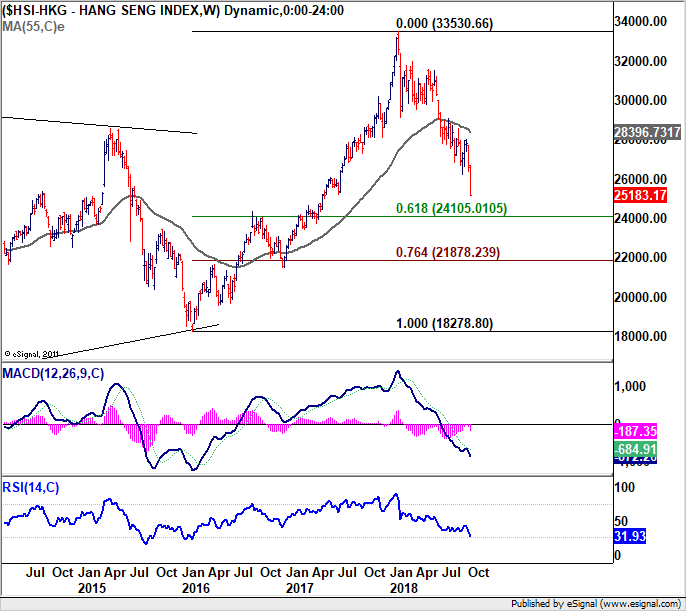
The down trend started earlier this year as dragged down by China's SSE. Now DOW also joined the party. Based on current momentum, HSI heading to 61.8% retracement of 18278.8 to 33530.6 at 24105.0 for sure. Realistic chance of some support could be found at 76.4% retracement at 21878.23. But let's see. It could be worse if China SSE accelerates further downward after breaking 2600 handle.
Market Morning Briefing: Dow Has Broken Below 26000 But Could Test Crucial Support At 25500
STOCKS
Stock indices are trading in the red globally.
Dow (25598.74, -3.15%) has broken below 26000 but could test crucial support at 25500. Note that 25500 could produce a good bounce triggering a decent rally for the near term. Only if the index fails to bounce back from 25500, we would consider a possible fall towards 25000 or lower. For now, the index looks bullish while above 25500.
Dax (11712.50, -2.21%) is down to 11700 as expected. The weekly resistance near 11600 now comes into the picture. Dax could see a fall towards 11600 before bouncing back from there in the medium term.
Nikkei (22591.29, -3.89%) came off sharply to test important support levels just above 22400. While the support holds, Nikkei could bounce back towards 23500-24000 levels once again. Near term looks bullish and the index seems ready for a decent rise in the near term.
Shanghai (2644.18, -3%) has broken below 2700 and is likely to re-test 2600 on the downside. Unless a bounce from 2600 is seen, the current fall looks strongly bearish and could well open up downside chances of 2550-2500 in the medium term.
Nifty (10460.10, +1.54%) recovered a bit yesterday as 10200 support seem to be holding well for now. The current rise could take it towards 10600 but the scope of another fall cannot be negated. The index could again come off towards 10200-10000 from 10600 in the near term. Currently Nifty could be in a corrective up move which could be followed by another fall towards 10200-10000.
COMMODITIES
Commodities are trading weak and look bearish in the near term. While Crude prices fall, Copper could also trade low or at least remain stable.
Brent (81.68) has tested resistance near 86-87 on the 3-day candle chart and while that holds, the price could fall a bit towards 78-77 in the near term before attempting a rise later on. Near term looks bearish.
WTI (72.06) could test support near 70-71 region on the downside.
It is very likely that Gold (1197.10) is trying to base out while trading within the 1220-1190 region. A break out preferably on the upside could soon be on its way. While above 1170/90, Gold looks bullish after completion of the current consolidation phase.
Copper (2.74) could not sustain a rise seen yesterday and fell back to levels near 2.75. While resistance near 2.85 holds strong, there could be an eventual fall towards 2.65 again in the medium term.
FOREX
Watch resistances @ 1.162 (Euro) and 1.325 (Pound). Dollar Rupee has crucial support near 74.
Euro (1.1560): The break above 1.155 has reduced chances of a dip towards 1.14 in the next 1-2 weeks. On the upside now there are 2 crucial Resistances which could be targeted - first at 1.162 (21 days MA) and above that, at 1.17 (trendline resistance).
Dollar Index (95.23) : As the Euro rises to 1.162, Dollar Index should drop to support near 94.98 (21 days MA). A further rise to 1.17 on Euro would correspond with levels near 94.5 (trendline support) on Dollar Index.
Dollar Yen (112.11) has seen a sharp fall and now has crucial trendline support in the 112.0-111.5 zone. If this support is also broken, it could confirm that Dollar Yen has topped out near 114.5.
Euro-Yen (129.60) : A week close below the 21 weeks MA near 129.13 could accelerate a drop towards 127 (support on weekly candles) in the next couple of weeks.
Pound (1.3227) looks like it could break above resistance near 1.325 on daily candles and target levels near 1.342 (55 weeks MA) in the next 1-2 weeks. The possibility of a fall to 1.28 in the near term now looks significantly reduced.
Aussie (0.7070) again fell yesterday after having broken above 0.71. On the downside it has support on daily candles near 0.70 and on the upside, there are resistances at 0.710-0.715-0.720. A downmove to 0.70 (if it happens), could be very bearish since long term support on weekly line chart would clearly have broken then.
Dollar Rupee (74.205): Watch if it comes down towards 74 today (following Euro strength) or moves up to 74.60-80 (following the Dow decline). Watch Supports at 74.00 on Dollar-Rupee and 8.00% on the 10Yr GOI today. If they break, a dip to 73.75-60 and 7.90% may be seen respectively. Else a fresh upmove could still take place.
INTEREST RATES
India 10 year yield (8.03%) : Watch Support @ 8%. If it breaks, then lower support near 7.90% could be approached.
The US 10 Year (3.16%) and 30 year (3.34%) have come off sharply and could now move even lower towards 3.10% and 3.30% respectively.
The 10 Year German-US spread (-2.61%) has moved up to test resistance near -2.60% on medium term chart. If it comes off from here again, our earlier forecast of a downmove to -2.80% over the next few weeks would remain intact.
German 10 year yield (0.55%) is likely to see a dip from resistance on medium term chart towards 0.40%.
Japan 30-5 year yield spread (0.98%) has broken above long term resistance near 0.95%. If this break persists, it could imply that the 30-10 (0.78%) could also break above resistance near 0.82%. If that happens, it could be very bullish for bond yields globally.
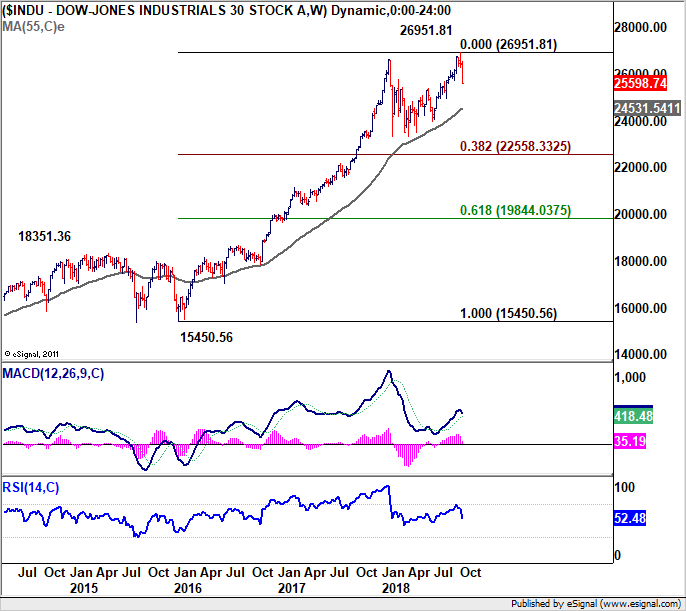
DOW already in medium term reversal? 24531 is next test
Let's have a look at DOW after yesterday's steep, -831 pts or -3.15% fall.
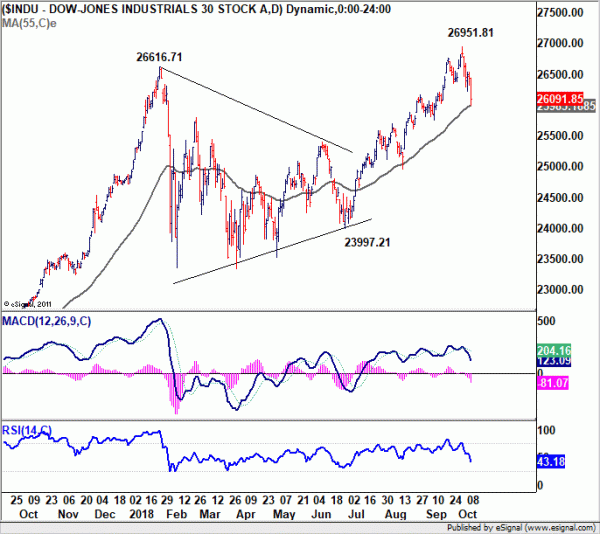
The strong break of 55 day EMA, coupled with bearish divergence condition in daily MACD, is significantly raising the chance that it's now in medium term reversal. From price structure point of view, there was also a beautiful wave four triangle from 26616.71 to 23997.21, followed by a short impulse wave five from 23997.21 to 26951.81. Unless DOW could get back above 55 day EMA quickly, otherwise, risk is now heavily on the downside.
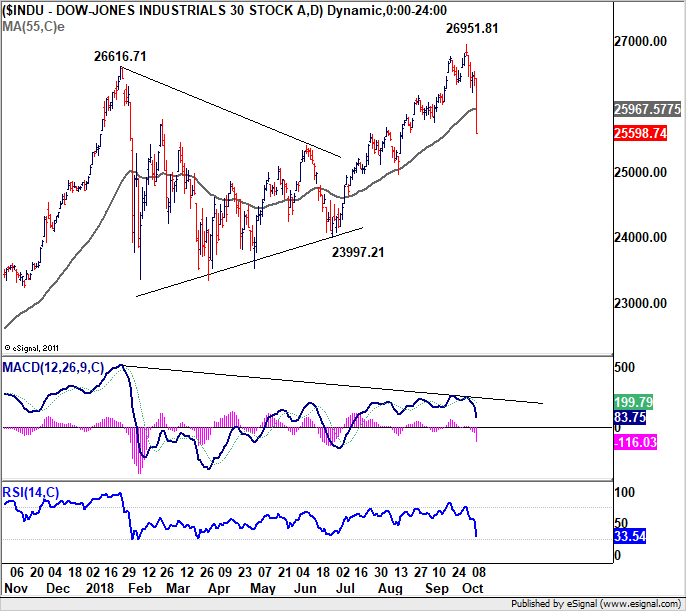
So how far could DOW fall to? If we take a less bearish view, it's just correcting the uptrend from 2016 low at 15450.56 to 26951.81. Then, first support is 55 week EMA (now at 24531.54). Defending this support will keep the medium term intact and invalidate the above mentioned medium term reversal case. However, firm break there should at least send DOW back to 38.2% retracement of 15450.56 to 26951.81 at 22558.33 before bottoming.
EURUSD Price Extension Eyes The 1.1590 Resistance Zone
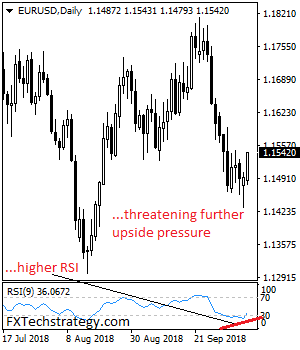
EURUSD price extension now eyes its cluster of resistance located the 1.1593/99 zone. This is coming on the back of its lower price rejection candle printed on Monday. On the upside, resistance comes in at 1.1600 level with a break through there opening the door for more upside towards the 1.1650 level. Further up, resistance lies at the 1.1700 level where a break will expose the 1.1750 level. Conversely, support lies at the 1.1500 level where a violation will aim at the 1.1450 level. A break of here will aim at the 1.1400 level. Below here will open the door for more weakness towards the 1.1350. All in all, EURUSD still faces further upside pressure on corrective recovery.
High Hopes Give Way To Steeper Slopes
High hopes give way to steeper slopes
The markets are fraught with peril as the focus not too unexpectedly remains on US equity and bond markets. And while there is not one plausible explanation for the latest equity tumult, the horrible intersection of risk aversion due escalating US-China tensions and rising US rates has spooked out investors overnight triggering abroad selloff which took the S&P 500 to the lowest level since February. Technology stocks took a big hit today, recording their worst today since August 2011 the “fear gauge ” VIX rose above 20 for the first time since April which triggered more than just a wave of profit taking; investors were genuinely panicked. All of which has investors cowering trying to determine if this is a case of risk aversion of the beginning of a massive correction.
But cheap money has been the rocket fuel for equities as investors piled in the past two years given that it was the only game in town to get a decent yield. But the more aggressive Fed rate-hike schedule has brought the gravy train to an end sooner than expected. But the real question facing investors is just how far is the Fed prepared to go.?
Investors have become used to and perhaps over complacent from FOMC's in the past that approached rate hikes cautiously. So, the markets are still going through the reality check with Jay Powell at the helm who has unambiguously signalled a significant policy change was afoot. And it's not too much of a stretch to think he could be borrowing a page or two from Allan Greenspan when the Feds raised the Fed funds rates aggressively higher from 2004-2006 during the last cycle.
And despite the US yields correcting lower on a combination of risk aversion and foreign demand kicking in buying these very juicy yields post-auction, the equity carnage accelerated as investors continue to aggressively deleverage equity positions as high hopes give way to steeper slopes.
But China concerns ahead of the US Treasury report on FX are likely aggravating sentiment as this could trigger a worsening of global trade outlook. But let's not forget tonight's CPI report. From a pure fundamental trader perspective, given the hawkish tail risk from a higher inflation print has also weighed down sentiment.
Oil markets
Oil prices were weighted down most of the NY session by the sharp stock market sell-off. However, prices were primarily driven by the uncertainty concerning the real impact of US sanctions on Iranian oil supply, which continues to seesaw. While rising output concerns from the likes of Saudi Arabia and Russia, contiued to weigh. As well, given traders tend to” sell the landfall ” scenario, and with the surprising intensity of Hurricane Michael, it will likely have negative short-term ramification for petrol demand across the US Southeast if not further up the coast, suggesting yet more inventory builds. So, the market has swung aggressively from the Supply to the Demand side of the equation especially with the IMF global growth downgrades fresh in the memory banks.
But then sentiment completely buckled when the American Petroleum Institute (API) reported a significant build of 9.75 million barrels of United States crude oil inventories for the week ending October 5, which was colossally bigger than analysts expected. While builds at the Cushing, Oklahoma delivery point for NYMEX WTI crude stocks increased 2.2 million barrels per day.
According to Reuters sources Saudi Arabia is set to deliver an extra 4 million barrels of its oil to India in November in what looks to be an aggressive move by Saudi move to replace the loss of Iranian barrels due to the U.S. sanctions and ease the suffering of one of the worlds biggest oil consumers.
Gold markets
Gold prices ignored the .2% rise in US PPI, but hedgers were stepping back into the fray as US equity markets were tanking. But the moves were tempered by high US yields.
Currency Markets
While the Tech-heavy NASDAQ bore the brunt of the selling, the S&P500 which is more correlated to currency markets broke through some substantial support level, suggesting the move could run much more profound.
Japanese Yen
USDJPY came off sharply with the risk-aversion sentiment permeating throughout the London afternoon/NY morning amid massive USD selling for the second day in a row. There was plenty of USD selling following the double whammy of Nikki Haley's surprise resignation and President Trump weighing in on Fed policy, and with the markets leaning lower on USDJPY due to focus on a possible BoJ shift, the trap door sprung on an aggressive break of 113.
The Chinese Yuan
Trader continues to test the 6.93 USDCNH level as increasing chatter about the 7 level intensifies. But it would be folly to move in front of the US Treasury's Currency Report is due by Monday, October 15 where there's a consensus building that the US Treasury will classify China as a currency manipulator
The Euro
There's enough risk weighing down the EURO to sink a battleship, but the single unit has caught a reprieve from broad-based USD selling rather than any significant shift in EU sentiment. Which makes it a prime target for a beat on tonight's CPI
The Malaysian Ringgit
The Ringgit could face additional pressure from negative risk sentiment and lower oil prices. The upcoming budget has triggered another unwanted wave of uncertainty, especially around new taxes. Markets hate tax increases even if they are necessary to balance the budget.
Eco Data 10/11/18
[php_everywhere instance="1"]
Mid-US update: DOW in crash mode, Dollar gets no support from treasury yields
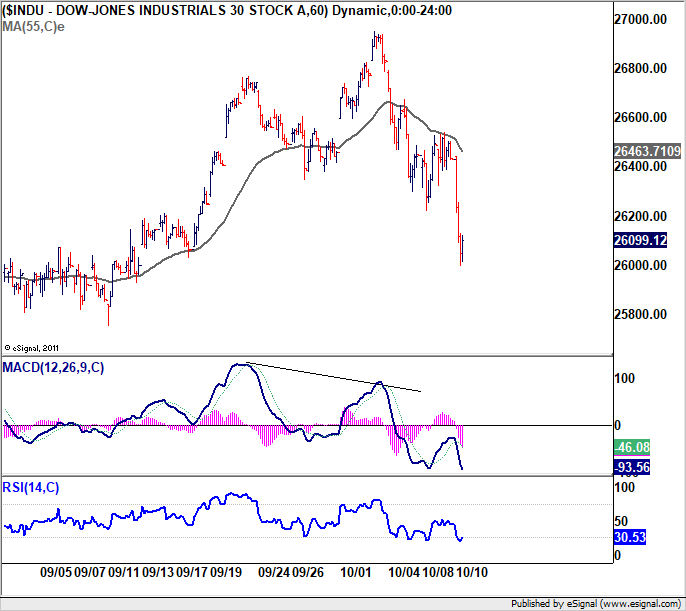
Risk aversion is the main theme in the first half of US session as stocks are in crash mode. DOW is trading down -1.4% or -370 pts. S&P 500 is down -1.30% and NASDAQ is down -1.86%. European indices are even worse, with DAX closed down -2.21%, CAC down -2.11% and FTSE down -1.27%.
Strength in global treasury yields is being blamed as the reason for the stock market selloff. German 10 year bund yield closed up 0.0041 at 0.556, quite "confidently" above 0.5 handle. US yields are also rising so far, with 5 year yield up 0.009 at 3.066, 10 year yield up 0.012 at 3.220, 30-year yield up 0.017 at 3.387. But we have to emphasize that these three US yields are held below last week's highs.
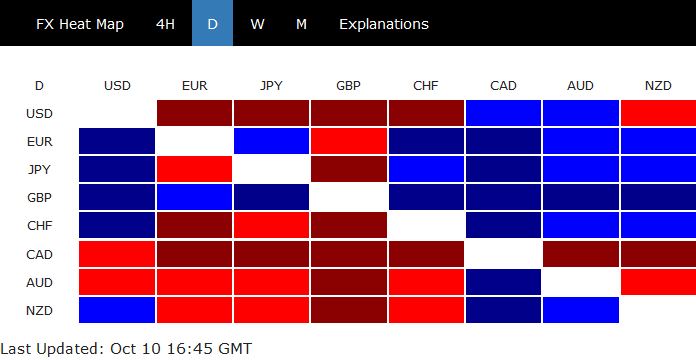
In the currency markets, commodity currencies are the weakest ones naturally. But it should be noted that Dollar doesn't get any lift from US yields and is trading as the third weakest for now, next to Canadian, Australian and New Zealand Dollar. Yen and Swiss are not the strongest neither. It's Sterling that's the biggest winner and Euro the second. It will take some more time for us to analysis what's really happening. But for sure, it's not as simple as rising yield and falling stocks. We're not satisfied with this simplistic explanation.
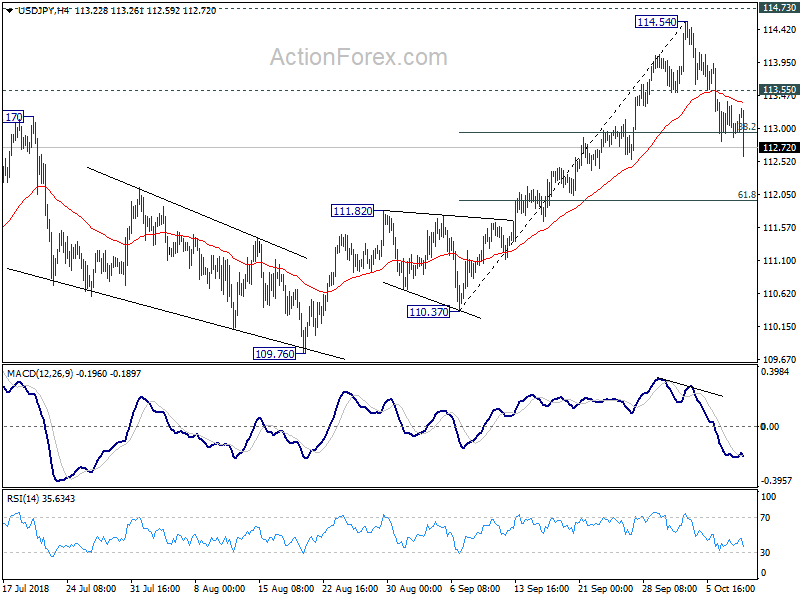
Anyway, USD/JPY finally made up its mind to break through 38.2% retracement of 110.37 to 114.54 at 112.94. Next target is 61.8% retracement at 111.96.
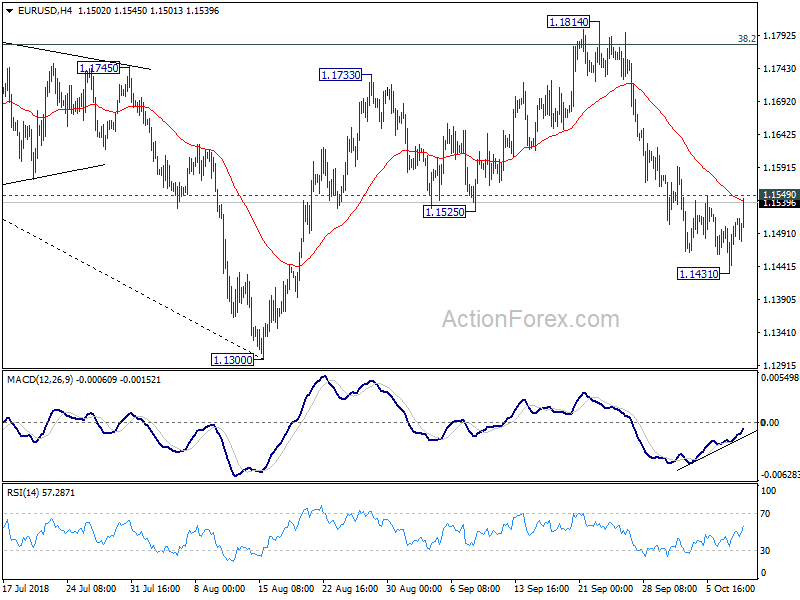
EUR/USD will most likely take out 1.1549 resistance to indicate short term bottoming at 1.1431. It's unsure, for now, whether it will extend the corrective rise from 1.1300 through 1.1814. But at least, more upside is in favor in near term.
The bigger question for us is, whether DOW has topped out in medium term at 26951.81, earlier that we expected. It's a beautiful short wave five impulse from 23997.21 after wave four triangle from 26616.71 to 23997.21. Unfortunately, for now DOW is still holding above 55 day EMA. Thus, we cannot make a call yet. Let's see how it goes for the rest of the week.
British Pound Climbs to 2-Week High on Strong GDP
GBP/USD has recorded considerable gains on Wednesday, continuing the upward movement seen on Tuesday. In the North American session, the pair is trading at 1.3200, up 0.42% on the day. On the release front, British data disappointed. GDP grew by 0.7%. In the U.S, PPI and Core PPI both gained 0.2%, matching the estimate. These inflation readings were the strongest gains since June. On Thursday, the U.S will release CPI reports and unemployment claims.
British numbers were mixed on Wednesday, but the pound has pushed higher, breaking above the 1.32 level for the first time since September 26. The economy expanded 0.7% for the three months to August, compared to the three months to May. This was music to the ears of investors who are constantly concerned about the negative ramifications of Brexit on the economy. The news was not as good from manufacturing production, which posted a second consecutive loss of 0.2%, short of the estimate of 0.1%.
The mood seems more positive in London and Brussels, as there are reports of progress in the Brexit negotiations. With Britain set to sail away from the EU in March 2019, both sides are sounding more conciliatory, after months of bickering. Still, there are plenty of issues to solve, with the issue of the Irish border one of the thorniest problems. Prime Minister May’s government depends on the tiny DUP party for its survival. The leaders of the DUP, Arlene Foster, met with the EU’s chief negotiator, Michel Barnier on Tuesday. Foster is adamantly opposed to any regulatory barriers between Northern Ireland and the rest of the U.K. However, the EU wants to see Northern Ireland remain in a customs union with the continent, which would require some type of border check between Northern Ireland and the rest of the U.K. Foster has gone so far as to threaten to vote against the budget later this month if May agrees to the EU demands.
Will Britain and the European Union reach an agreement over Brexit? Despite months of gloom and fears of a hard Brexit, there is renewed optimism in London and Brussels that a deal can be reached before the March 2019 deadline. There are reports that the sides have made progress on a range of issues, including the Irish border and continued EU access to London’s clearinghouses. EU leaders will hold a crucial meeting on October 17, with Brexit one of the key items on the agenda. If there are tangible signs of progress on Brexit ahead of the summit, the pound could move higher.
What Do the IMF’s Trade Concerns Imply for FX Markets?
The IMF presented its World Economic Outlook (WEO) on Tuesday, a survey that is released every six months, with economic activity estimates being updated in between. In its report, the organization stresses that downside risks to global growth have risen lately, with special mention made to threats stemming from intensifying trade tensions. Consequently, for the first time in more than two years, it has revised its global growth projections downwards, specifically to 3.7% for the years 2018-19 from 3.9% previously for both. The commentary that follows focuses on certain aspects of the report that relate to major economies and summarizes the IMF’s findings, blending them with our own views wherever deemed necessary.
US strength to linger amid fiscal impulse, but fade into 2020
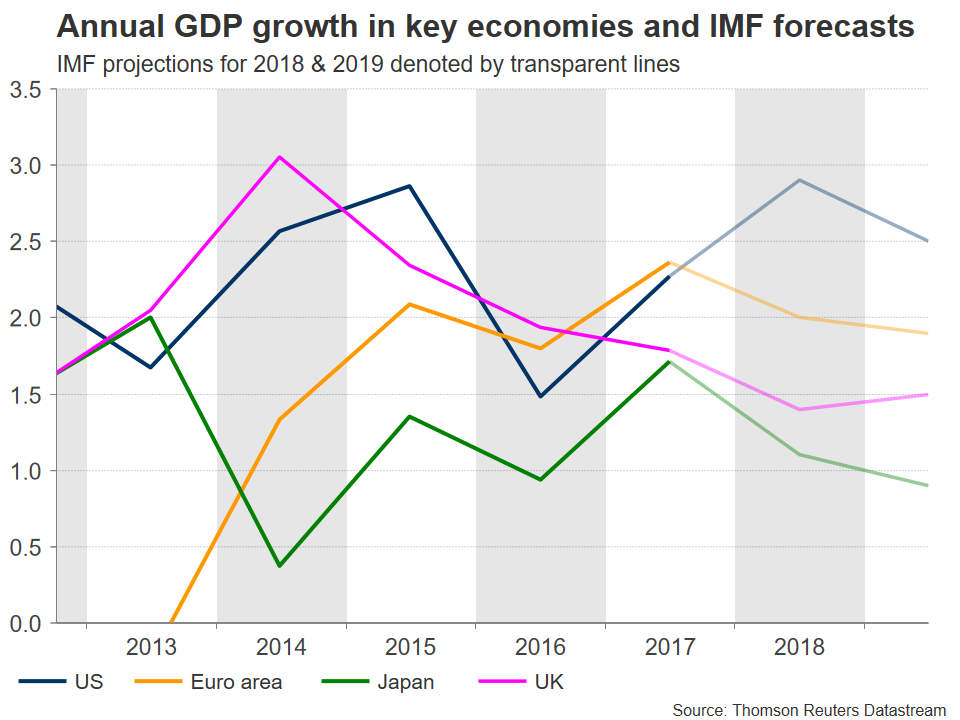
The IMF wasn’t particularly downbeat on the outlook for the US. The Fund kept its GDP estimates for 2018 unchanged from July at an elevated 2.9%, citing strong fiscal stimulus supporting growth. It did however, revise modestly lower its 2019 forecast, mainly due to the recently announced trade tariffs against China. Perhaps most striking, was a warning that US growth will decline in 2020 as fiscal stimulus begins to unwind at a time when monetary policy tightening may be at its peak.
On another interesting note, the Fund observed that despite the US economy operating above full employment, markets are pricing in less tightening than signaled by the Fed itself. This suggests an upside inflation surprise could trigger an abrupt repricing of expected rate increases, in turn catapulting US bond yields and the dollar higher. Besides boosting the dollar, such an outcome would also imply pain for riskier assets, most notably stocks. Yet, it’s perhaps puzzling that the IMF marked its US inflation forecasts lower both for 2018 and 2019, even in the face of tariffs that will add to consumer prices.
Worsening trade, weakening credit availability threatening Chinese economy
The international organization has maintained its 2018 growth forecast for the world’s second largest economy at 6.6% in 2018, which compares to 2017’s 6.9%. However, it revised its projections for 2019 to 6.2% from the previous 6.4%, as it anticipates that much of this year’s tariff actions will be felt next year. Overall, the IMF expects Chinese economic activity will remain robust moving forward but gradually decline.
Beyond trade risks, weakening credit growth is also cited as a drag to the economy. Given growing considerations for a debt crisis on the back of loose credit conditions in the past, this may well be long-term positive for China though, leading to a higher quality and less “fragile” growth outlook. In fact, the IMF states that the country should continue limiting credit expansion and address financial risks.
It bears mention that the aforementioned rely on base-case assumptions, which are not predicated on an all-out trade war between the US and China. The organization modelled the effects of a full-blown trade confrontation as well, with the negative outcome on the Chinese economy – and the US for that matter – being much more profound in that case, to state the obvious.
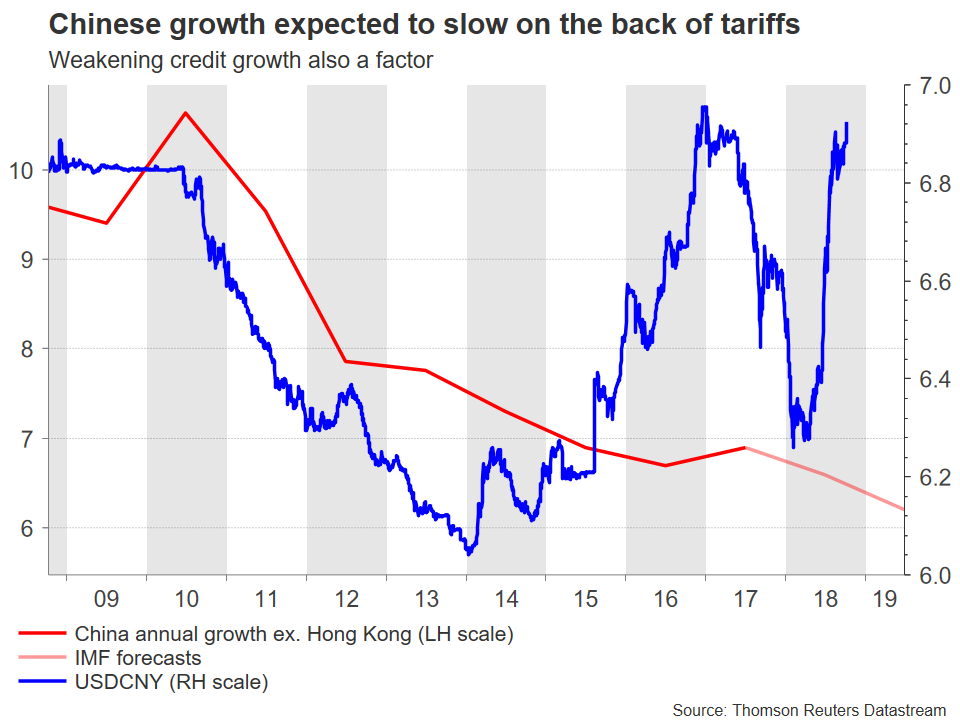
On the FX front, both the onshore (depicted above) and offshore yuan are currently trading not far below their weakest since January 2017 hit in mid-August. Despite China continuing to have relatively strong fundamentals, its currency is likely to come under increased pressure, at least during the remainder of the year. This is based on the fact that investors have so far opted to penalize the yuan whenever tensions between the two superpowers escalate, under the assumption that China has more to lose from the standoff.
Euro area seen weaker in 2018, unchanged further out
In Euro land, growth projections for 2018 were also pushed lower to 2.0%, from 2.2% in July’s estimates, as a streak of disappointing data releases earlier in the year dimmed the short-term outlook. For 2019, the IMF kept its forecasts unchanged from July, signaling that the bloc’s broader prospects haven’t changed radically.
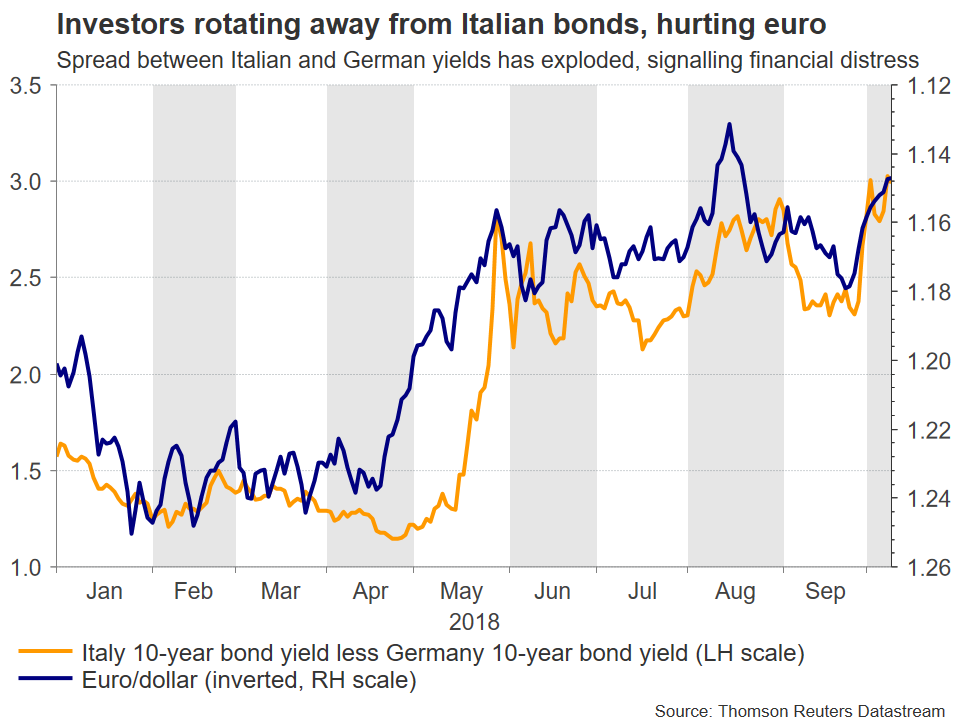
In the short-run, the euro’s path will hinge on how the Italian budget situation plays out. A risk premium has been priced into the currency amid jitters that Italy and the EU are headed for a clash over the budget deficit’s size. The details will be known by October 15, at which point the European Commission must approve or reject the budget; the euro will probably move accordingly. Separately, ratings agencies like Moody’s and S&P will be reviewing Italy’s credit position at the end of October, with a potential downgrade – and thus more pain for the euro – being in store if Italy sticks to its large deficit.
Brexit remains a key UK consideration
The Fund continues to believe that the UK economy will grow by 1.4% in 2018. However, this reflects a downgrade from April’s forecast of 1.6% and a slowdown compared to last year’s pace of 1.7%. In 2019, the respective projection has remained unrevised at 1.5%.
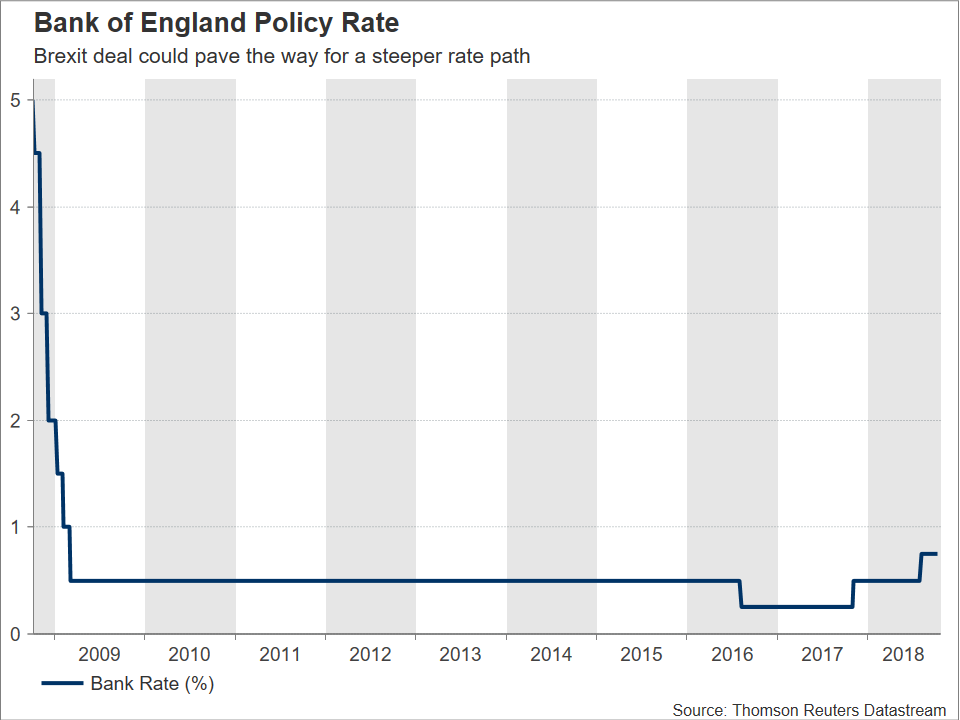
To the surprise of no one, Brexit and the possible failure in negotiations for an orderly exit from the EU bloc was cited as a risk. In this respect though, the market is currently pricing a relatively conservative BoE rate path, of roughly one hike per year. Should the no-deal cloud be lifted, something which recent news flow suggests is getting more and more probable, then sterling is likely to rally on the expectation of a steeper rate outlook.
In terms of price pressures, the IMF sees annual CPI easing in 2019, though still remaining above the Bank of England’s target of 2%. Of note is the revision of 2018’s CPI figure to 2.5%, from 2.7% previously.
Japanese growth seen treading water, inflation to remain below BoJ target
Japan’s economic growth is expected to slow to 1.1% this year, which represents an upgrade from July’s projection of 1.0%, but a downgrade from the 1.2% in April. The dimmer outlook from April was attributed to the contraction the economy suffered in Q1. Yet, the rebound in Q2 showed the dip was likely temporary, hence the slight upward revision from July. The estimates for 2019 were kept unrevised.
On the inflation front, although projections were revised a touch higher to 1.2% this year and 1.3% in 2019 on the back of higher energy prices, the broader picture remains bleak. The IMF expects inflation to remain below the Bank of Japan’s (BoJ) 2% target for the entire of its 5-year forecast horizon. Accordingly, the report highlighted that maintaining accommodative monetary policy is a “necessity”.
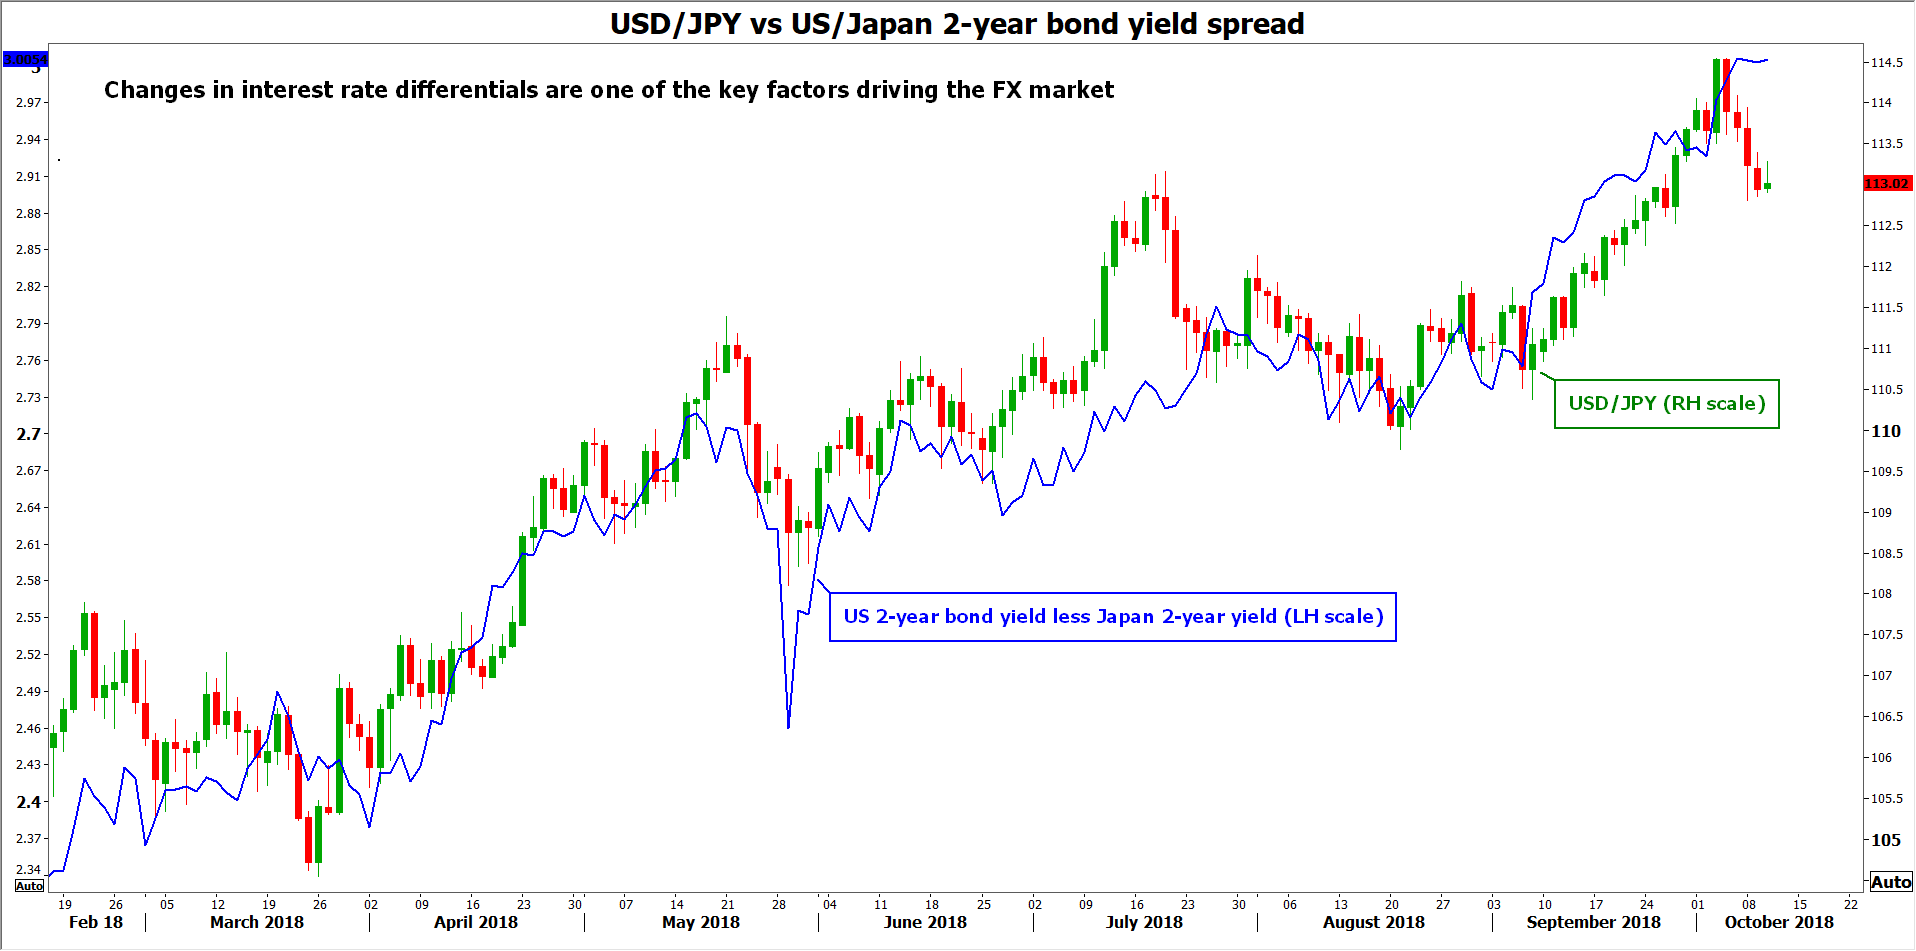
Indeed, the BoJ looks unlikely to materially modify its ultra-loose framework, under which it keeps the yields on 10-year Japanese bonds fixed around 0%. With the BoJ holding longer-dated yields capped near 0% while other major central banks like the Fed are raising rates, interest rate differentials between Japan and the US are widening, rendering the yen less attractive from a relative rates perspective. That said, the Japanese currency could always – and unexpectedly – attract safe-haven flows.
Market implications
In the big picture, the IMF placed enormous emphasis on the mounting risks presented by trade tensions, and their potential adverse effects on the global economy. In terms of market effects, higher trade barriers would probably trigger a defensive rotation towards haven-perceived assets, and away from riskier ones. Specifically, the Japanese yen – and to a lesser extent the US dollar – are likely to post gains in such an environment, particularly against currencies of economies that run substantial trade surpluses, like China and the Euro area. Beyond FX, equity markets are also expected to be vulnerable to greater trade frictions. Case and point, China’s CSI 300 index is already down by 18.6% year-to-date, and that trend may well continue should the confrontational rhetoric heat up further.
Now, as for the probability that the situation escalates, it appears to be relatively high, especially considering the recent rhetoric from both the US and China, the upcoming US midterm elections, and reports of tensions on noneconomic fronts as well. Moreover, the fact that China eased monetary policy and plans to do so with fiscal policy as well suggests it expects the standoff to be a prolonged one, and is “digging in” for the long haul.