

Sample Category Title
Sugar Outlook: Strong Bullish Acceleration Shows Signs Of Stall
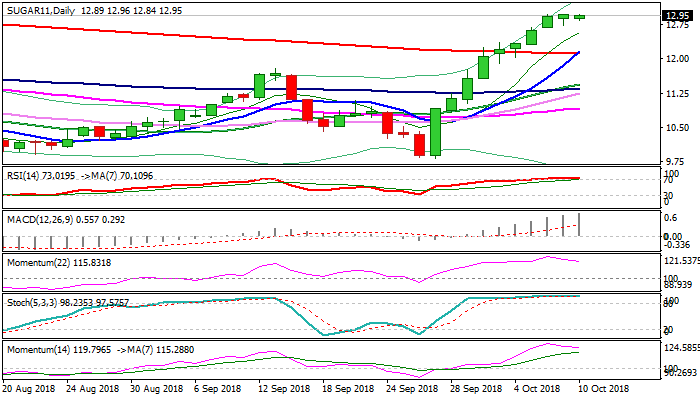
Sugar 11 future contract for March maintains bullish tone and extends strong recovery rally to the highest since early March, following last week's strong bullish acceleration which resulted in weekly gains of 13.4% (the biggest one-week rally since the third week of Sep 2015).
Sugar prices rose on strengthening currency of top producer – Brazil, which discourages producers to sell and signs that the EU is to reduce sugar exports, as output was impacted by low prices and poor weather conditions.
This week's extension of strong rally reached levels near key barriers at $13.00/09 (psychological / falling weekly cloud base), but showing initial signs of stall.
Bulls face strong headwinds here, with price action being capped ticks under 13.00 barrier for the third straight day.
Overbought daily / weekly studies warn of pullback, with momentum turning south and showing bearish divergence, which adds to negative signals.
Repeated failure at 13.00 zone would be further warning, but initial signal of pullback could be expected on penetration of rising thick hourly cloud (cloud top lays at 12.58).
Bearish acceleration through 11.95 (hourly cloud base) and 11.76 (Fibo 38.2% of 9.81/12.97 rally) is needed to confirm reversal.
Res: 13.00, 13.09, 13.31, 13.82
Sup: 12.84, 12.70, 12.58, 11.95
EUR/USD – Lack Of Data Leaves Euro Trading Sideways
EUR/USD is unchanged in the Wednesday session. Currently, the pair is trading at 1.1497, down 0.04% on the day. On the release front, there are no key German or eurozone indicators. In Germany, the yield on 10-year bonds rose to 0.55%. On Thursday, the ECB releases the details from its August policy meeting. The U.S releases key inflation indicators this week, starting with Producer Price Index reports. PPI and Core PPI are both expected to post gains of 0.2%, after a decline of 0.1% in the previous release. The U.S. will also publish the Treasury Currency report, a semi-annual publication.
Traders are awaiting the U.S Treasury's next currency report, which was last released in April. In that report, the U.S did not name any of its major partners as currency manipulators, but it did criticize China for the “non-market direction” of its economy. Since then, the Trump administration has imposed some $200 billion in tariffs on Chinese goods. China has retaliated with its own tariffs on U.S goods, and there has been speculation that China could respond to the U.S tariffs by devaluating the Chinese yuan, in order to bolster Chinese exports. In 2015 and 2016, the markets dropped sharply on fears that China would implement a major devaluation of its currency. The report should be treated as a market-mover.
With the ECB on track to wind up its stimulus program at the end of the year, the markets are focusing on the timing of a rate hike next year. The ECB has stated that it will not raise rates before the “end of the summer”, which many analysts have interpreted as September 2019. However, inflation has climbed significantly in the eurozone, and the ECB could opt to raise interest rates before September in order to curb inflation. Besides inflation, ECB policymakers will have to weigh other factors such as the U.S-China trade war when deciding when to raise interest rates.
Dollar Gains Pause, But Probably Not For Long
Wednesday October 10: Five things the markets are talking about
U.S treasury yields are largely stable, after declining from their seven-year high print yesterday.
Euro equities are on the back foot after Asia stocks managed to break a multi losing session.
Elsewhere, the ‘big’ dollar has stalled temporarily after U.S President Trump said the Fed should not raise interest rates as fast. However, Trump’s plea is unlikely to alter the broader theme of dollar gains in the short-term.
Dollar ‘bulls’ have yet to have a clear understanding of what the top is for the Fed cycle, and until the Trump administration changes its tune on China and trade, investors will continue to support the USD against emerging markets and pro-growth currencies.
For the dollar ‘bear’s’ next month’s midterm elections have the potential to derail dollar demand, especially where the loss of the House by the GoP would curtail most hopes for fresh fiscal stimulus. However, a month is a long time in politics.
Despite the U.S bond rout easing a tad, +$230B of new U.S debt is coming to the market this week, which should put pressure on dealers to back up yields.
U.S producer and consumer price data is also due in the next two-days and it too will determine where yields go from here.
1. Stocks mixed results
In Japan, the Nikkei edged a tad higher overnight as investors picked up defensive stocks on the dips, while index-heavyweight SoftBank dived on news it was to buy a majority stake in U.S shared office space provider WeWork. The Nikkei share average ended +0.2% higher, while the broader Topix was also up +0.2%.
Down-under, Aussie stocks rallied after its worst 48-hours in six-months. The ASX 200 closed +0.1% higher as the health-care sector rebounded +1.5%, reversing some of yesterday’s -3.9% losses, the biggest drop in seven-years. In S. Korea, the Kospi stock index closed down -1.12% overnight, hitting its lowest close in 18-months after the IMF cut its growth forecast for the country.
In China, stocks were mixed after the close overnight, as gains in utilities and communications led shares higher while losses in the energy sector led shares lower. At the close, the Shanghai composite rallied +0.18%.
In Hong Kong, stocks closed marginally higher earlier this morning, with investors remaining nervous about volatility in the U.S and a weak yuan. The Hang Seng Index edged up +0.08%.
In Europe, regional bourses continue their bearish tone with declines across the board. Sino-U.S trade concerns, coupled with Italian budget and U.K Brexit commentary continue to weigh on markets.
U.S stocks are set to open in the ‘red’ (-0.1%).
Indices: Stoxx600 -0.4% at 371.5, FTSE -0.1% at 7227, DAX -0.6% at 11904, CAC-40 -0.7% at 5283, IBEX-35 -0.6% at 9203, FTSE MIB -0.2% at 20023, SMI 0% at 8960, S&P 500 Futures -0.1%
2. Oil dips as IMF cuts growth outlook; eyes on hurricane
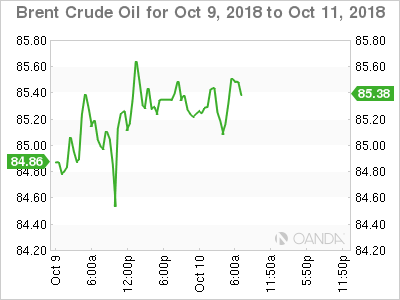
Oil prices have eased a tad after the IMF yesterday lowered its global growth forecasts. Nevertheless, markets are well supported on pullbacks as Hurricane Michael, a category 4, moves toward Florida causing the shutdown of nearly +40% of U.S Gulf of Mexico crude production.
Brent crude is down -20c at +$84.80 a barrel, after a +1.3% gain on yesterday. U.S light crude is down -15c at +$74.81.
Also providing an underlying bid is data showing crude exports from Iran, OPEC’s third-largest producer, are declining before the imposition of new U.S sanctions next month.
According to tanker data, Iran’s crude exports fell further in the first week of October, as buyers sought alternatives ahead of U.S sanctions that are to take effect on Nov. 4. Iran exported +1.1M bpd of crude in the first week of October, down from at least +2.5M bpd in April – before President Trump imposed sanctions.
Yesterday, the IMF cut its global economic growth forecasts for 2018 and 2019, raising concerns that demand for oil may also slump.
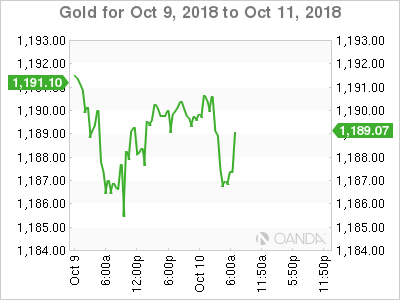
Ahead of the U.S open, gold is holding steady in a narrow range overnight, as the ‘big’ dollar pulls back from its seven-week high – support remains strong for the dollar on the back of a strong U.S. economy and expectations of steady interest rate hikes by the Fed. Spot gold is little changed at +$1,189.35 an ounce, moving largely within a +$4 range. U.S. gold futures have rallied +0.1% to +$1,192.60 an ounce.
3. Sovereign yields dip, including Italy’s BTP’s
Italian BTP yields have eased a tad this morning after Italy’s Economy Minister Giovanni Tria confirmed budget forecasts and said that he expected collaboration with the E.U over the budget.
After hitting multi-year highs yesterday, Italian government bond yields fell -2 bps along the curve – the two-year BTP yield fell to +1.70%. The spread of Italy’s 10-year BTP’s over Germany’s has widened +10 bps to +3.026%.
Yesterday, President Trump repeated his displeasure with higher short-term interest rates set by the Fed. Trump believes U.S inflation remains “in check,” which does not warrant a tighter monetary policy, especially at the Fed’s current pace.
The yield on U.S 10’s has eased -1 bps to +3.21%. In Germany, the 10-year Bund yield has decreased -1 bps to +0.54%, while in the U.K, the 10-year Gilt yield has backed up less than +1 bps to +1.719%.
4. Dollar takes a breather
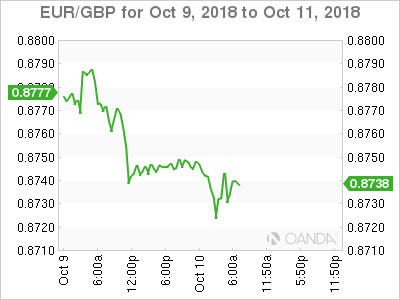
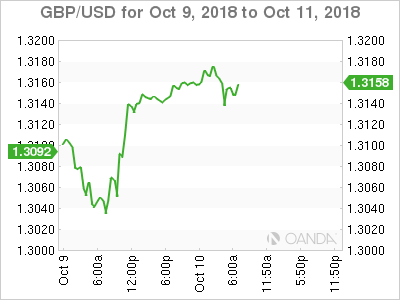
The pound (£1.3160 +0.10%) has advanced to a four-month high against the EUR and a two-week high against the dollar, on signs of momentum in the Brexit negotiations. According to the Times, a group of between 30 and 40 Labour members of parliament will defy Jeremy Corbyn and endorse a less hard-line proposal to prevent a ‘no-deal’ exit from the E.U.
Note: Both the U.K and E.U are said to have made progress in Brexit negotiations over Irish backstop.
Rising Italian bond yields continue to provide some resistance for the EUR (€1.1482), but major falls are not in the cards as long as the ‘single’ unit’s existence is not threatened, and as long as the ECB indicates ‘whatever it takes’ promise is in place.
The USD/JPY (¥113.19) is a tad higher as the yen snapped a four-day winning streak as some safe-haven flows retreated as U.S Treasury rates stabilized.
5. U.K economy picked up in the summer
Data this morning showed that U.K economic growth picked up over the summer, supported by stronger retail sales and house building in response to warmer-than-usual weather.
According to the ONS, economic output in the three-months through August was +0.7% higher than in the three-months through May, equivalent to annualized growth of +2.8%.
However, there were signs that the U.K economy was losing traction towards the end of the period, with output flat in August compared with July.
According to the ONS, “the economy continued to rebound strongly after a weak spring with retail, food and drink production and house building all performing particularly well during the hot summer months.”
Note: The BoE indicated it would follow its two rate rises with a number of further moves over the coming years if the economy continues grow at around its current rate. However, expect the Brexit strategy to determine monetary policy, at least in the short-term.
Other data showed that the U.K’s trade deficit widened in August as its goods deficit deepened to -£11.2B from -£10.4B in July, while its manufacturing output was -0.2% lower in August than in July, a second straight month of decline.
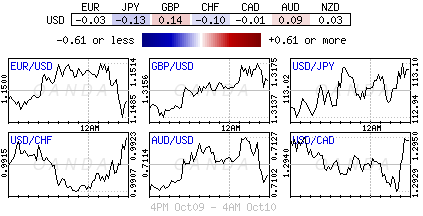
EUR/AUD 4H Chart: Meets Support Cluster At 1.6174
The common European currency has been appreciating against the Australian Dollar since the middle of August. This movement was bounded by a seven-week ascending channel pattern.
Currently, the EUR/AUD currency pair is trading near the lower boundary of a one-week ascending channel and the three SMAs at the 1.6174 mark and could be set for a breakout.
However, from a theoretical point of view, it is expected for the currency exchange rate to hold that support level at 1.6174 then pullback towards the weekly pivot point at 1.6228 during the following trading sessions.
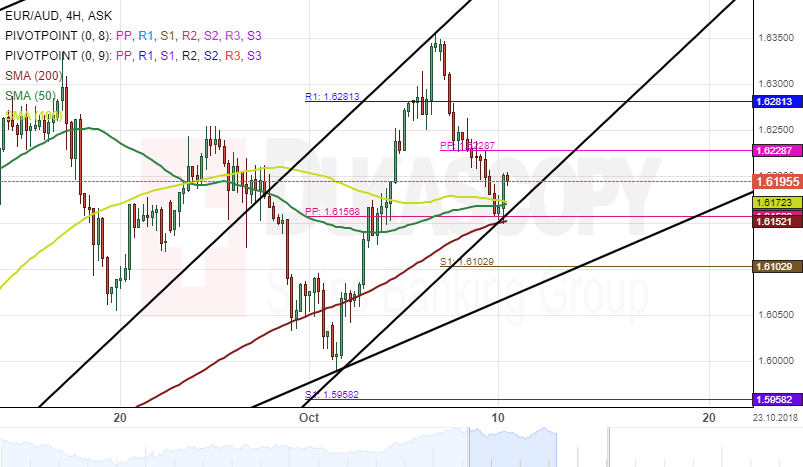
EUR/CAD 4H Chart: Triangle-Like Formation
The single European currency has declined significantly against the Canadian Dollar since the end of September. This downside momentum began after the currency pair hit the upper boundary of a downtrend line at the 1.53 mark.
Presently, the exchange rate is trading in a triangle-like formation and has breached the upper border of the triangle pattern. Furthermore, the pair is stranded between SMAs during the morning hours of today's session.
Everything being equal, it is that the currency exchange rate increases its trading range during the following trading sessions.
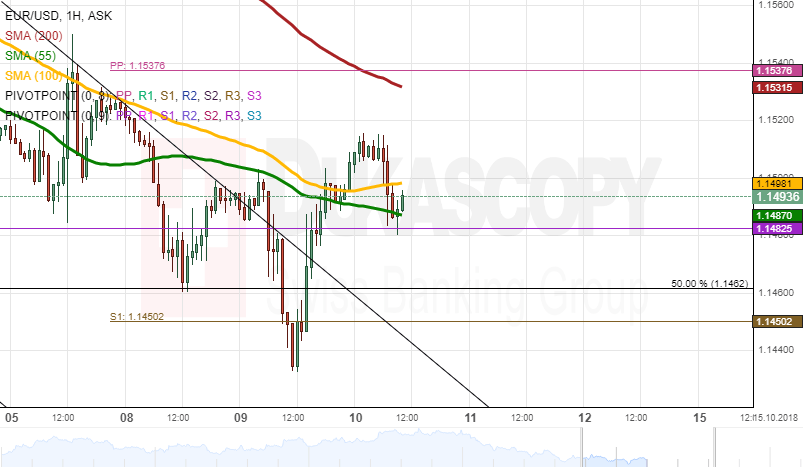
EUR/USD Analysis: Trades Sideways At 1.1500
The European Single Currency appreciated 0.04% against the US Dollar since Tuesday's session. On Wednesday morning, the currency pair was located between the 55-hour and the 100-hour SMAs at the 1.1494 mark.
In regards to the near-term future, most likely, the European Single Currency will trade sideways due to the resistance of the 200-hour SMA and the support of the monthly S1 at the 1.1482 mark. The rate should stay at the 1.1500 level during the day.
However, the 200-hour SMA could resist the currency exchange pair to pass through the monthly S1 to trade near the 50.00% Fibo on Wednesday.
GBP/USD Analysis: Trades At 50.00% Fibo
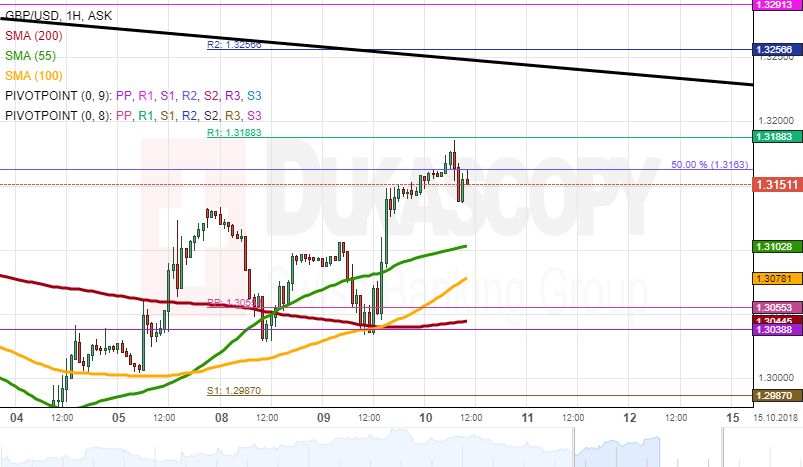
The British pound appreciated 0.49 % against the US Dollar since Tuesday's session. During Wednesday morning hours, the British pound was trading at the 50.00% Fibo at 1.3163 mark.
In regards to the near-term future, most likely, the British pound will trade downwards due to the resistance of the 50.00% Fibo on Wednesday. The simple moving averages will try to catch up the rate during the trading session.
On the other side, the rate might pass through the 50.00% Fibo to surge upwards passing through the weekly R1 at the 1.3188 mark to trade at the 1.3200 level.
USD/JPY Analysis: Waits For Break-Out
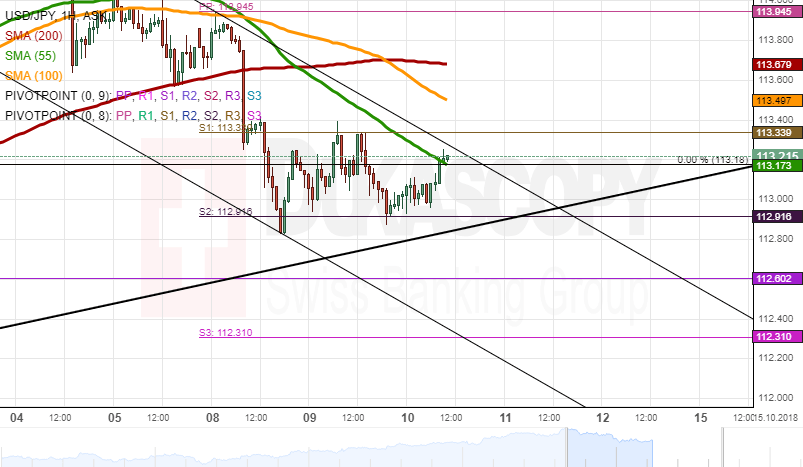
The US Dollar appreciated 0.17% against the Japanese Yen since Tuesday's session. On Wednesday, the US Dollar was resisted by the 55-hour SMA to trade at the 113.13 mark.
In regards to the near-term future, most likely, the US dollar will trade sideways to reach the bottom boundary of the ascending medium pattern at the 112.80 level during the day. The rate is waiting for break-out to trade upwards or downwards in the following trading session.
However, the rate could pass through the support of the weekly S2 at the 112.91 mark and use the weekly S2 as resistance to pass the medium pattern.
XAU/USD Analysis: Trades At 1,185.00
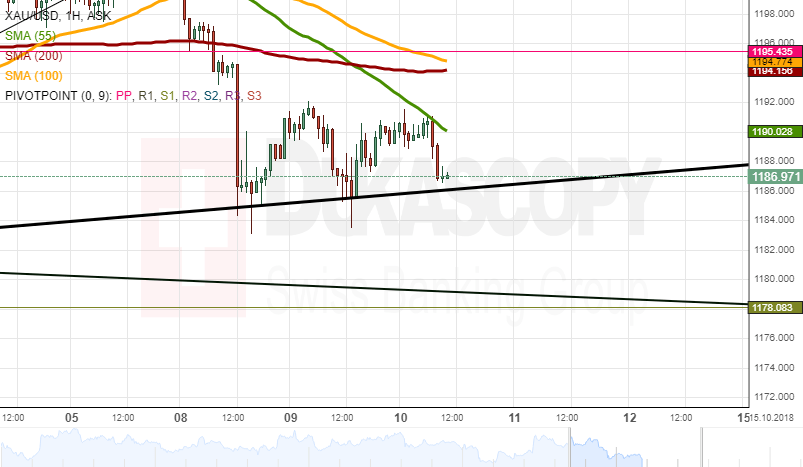
The gold price depreciated 0.21 % since Tuesday's session. On Wednesday morning, the yellow metal was resisted by the 55-hour simple moving average to trade at the 1,187.32 mark.
In regards to the near-term future, most likely, the yellow metal will keep trading sideways to stay at the 1,185.00 level during the trading session.
On the other side, the 55-hour simple moving average could resist the gold to pass through the bottom boundary of the medium ascending pattern to trade at the 1,184.00 level on Wednesday
Expected Slowdown In US CPI Unlikely To Derail Fed Rate Path
US inflation data as gauged by the consumer price index (CPI) will be made public on Thursday at 1230 GMT. Headline CPI growth is expected to ease to its lowest since March on a yearly basis, though combined with the rise in underlying price pressures as measured by the core CPI, that’s unlikely to pose any threats to the Federal Reserve’s rate normalization plans. Still, the dollar is likely to prove sensitive to deviations from analysts’ forecasts, with the release constituting the most important one out of the US for the week.
September’s CPI is anticipated to grow by 0.2% on a monthly basis, the same as in August. This would put the annual rate of growth in the measure at the six-month low of 2.4%. Still, this would keep the print at relatively elevated levels. Overall and adding to this the projected rise in core CPI to 2.3% y/y from 2.2%, the annual slowdown in headline CPI is unlikely to be seen as threatening the Fed’s rate outlook. Core inflation is the reading that excludes volatile food and energy items from its calculations.
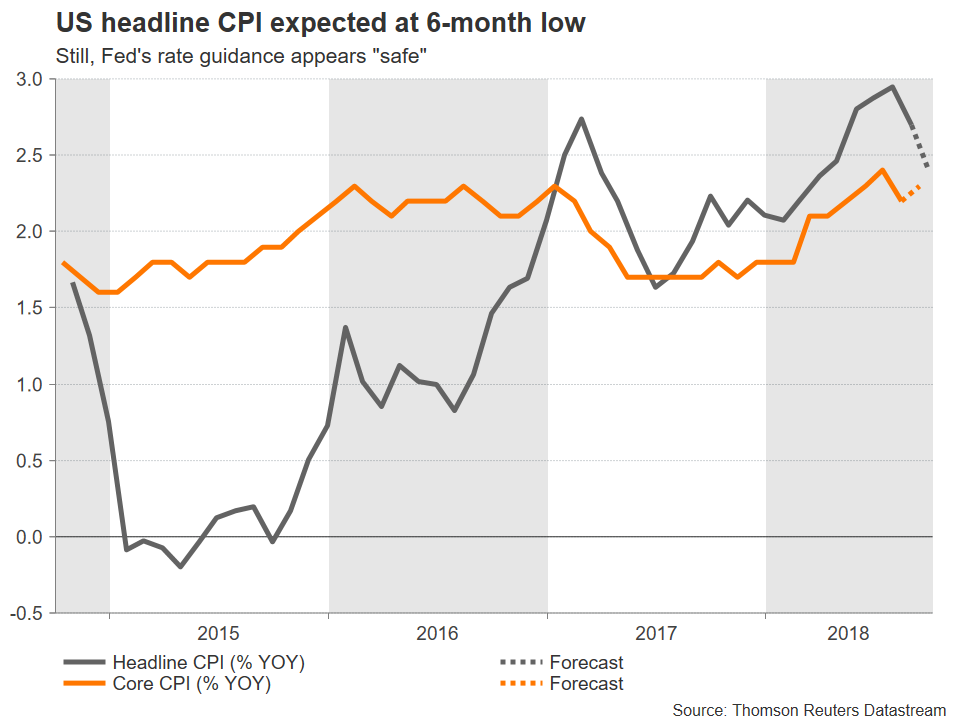
Energy prices supported headline CPI in August, with falling healthcare and apparel costs acting as a drag on the gauge, which tracked an annual pace of expansion of 2.7% during the month.
For the record, the US central bank’s preferred indicator of price pressures is the core PCE price index, which during August stood at 2.0% y/y for the fourth straight month, coinciding with the Fed’s annual target for inflation. Still, consumer price inflation is also closely watched, as a beat in the figures is likely to be met with rising odds for a fourth 25bps rate rise in 2018 (79% priced in according to Fed fund futures), resulting in long dollar positioning. Conversely, weaker-than-expected prints are likely to weigh on the greenback. Of course, the extent of the discrepancy from economists’ projections will determine how volatile markets will be in the aftermath of the data; the two are positively correlated.
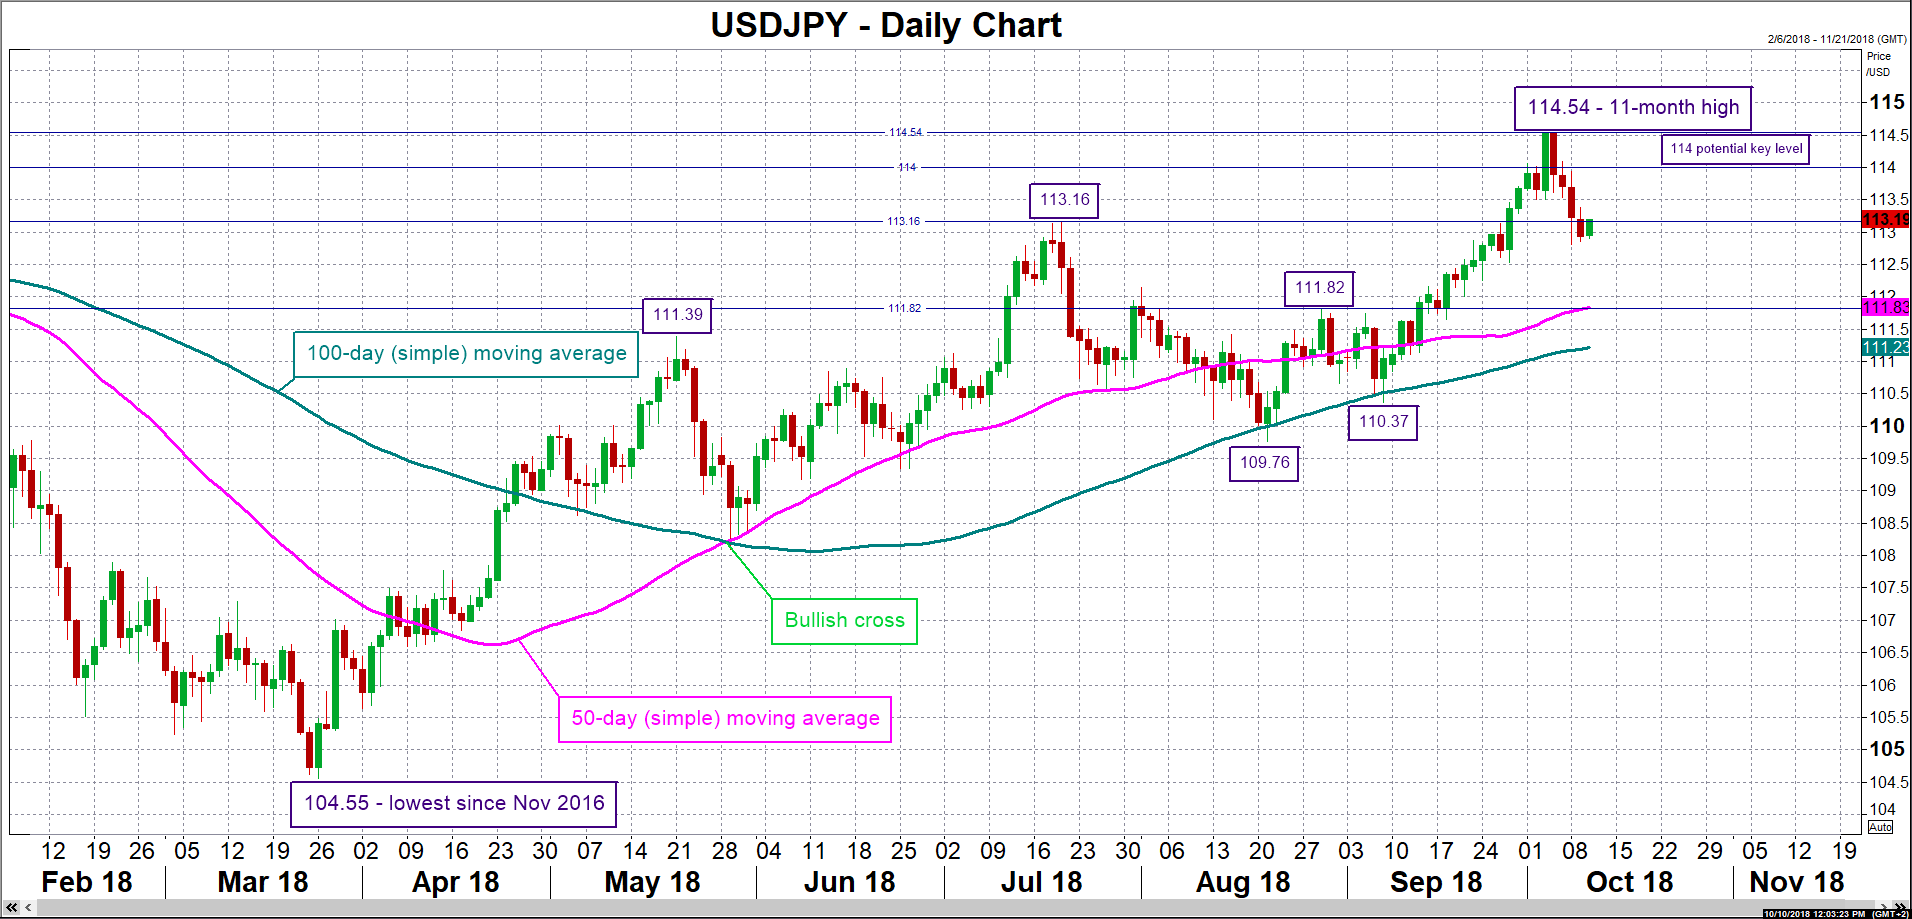
Technically, a rising USDJPY that conclusively moves above a previous peak at 113.16 may meet resistance around the 114 round figure which halted advances in previous occasions. In case of an upside violation, the attention would turn to last week’s 11-month high of 114.54, while further above, the 115 handle would come into scope. On the downside, a declining pair could find support from the region around 111.82, which is another top from the past; the 50-day moving average roughly coincides with this point as well. Lower still, the focus would turn to the 100-day MA at 111.23.
It bears mention, perhaps more so at this point in time that Fed policymakers appear more confident in hiking interest rates, that the numbers are anticipated to affect bond and equity markets as well. The readings overshooting expectations are supportive of higher yields and consequently lower stock market valuations, as the borrowing costs of corporations would be facing upside pressures. In this respect, two-year and 10-year Treasury yields reaching fresh highs last week – they extended their move up during the current week – sent shivers across stock markets, with the Dow Jones, S&P 500 and Nasdaq Composite all posting weekly losses.
On the Fed front, numerous FOMC members will be making public appearances as the week unfolds. Evans (non-voting FOMC member in 2018 – 1415 GMT) and Bostic (voter – 2100 GMT) are on the agenda on Wednesday. The two will return to the rostrum on Friday at 1330 GMT and 1545 GMT respectively.
Lastly, the producer price index (PPI) that measures factory inflation is due at 1230 GMT later today. Traders may use these figures to speculate on how the CPI numbers will be released, though it should be stressed that the two gauges (PPI & CPI) are far from perfectly correlated.