Sample Category Title
UK GDP growth stalled in August, Sterling mildly lower
Sterling trades mildly lower after UK GDP miss. UK GDP was flat in August, grew 0.0% mom, below expectation of 0.1% mom. Though July's figure was revised up from 0.3% mom to 0.4% mom. For the three months from June to August, GDP grew 0.7% from the March to May quarter.
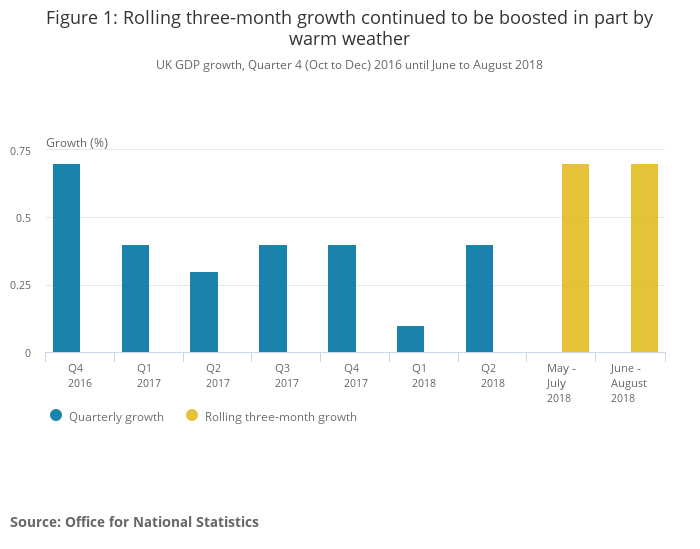
Commenting on today's GDP figures, Head of GDP Rob Kent-Smith said: "The economy continued to rebound strongly after a weak spring, with retail, food and drink production and housebuilding all performing particularly well during the hot summer months. However, long-term growth continues to lag behind its historical trend."
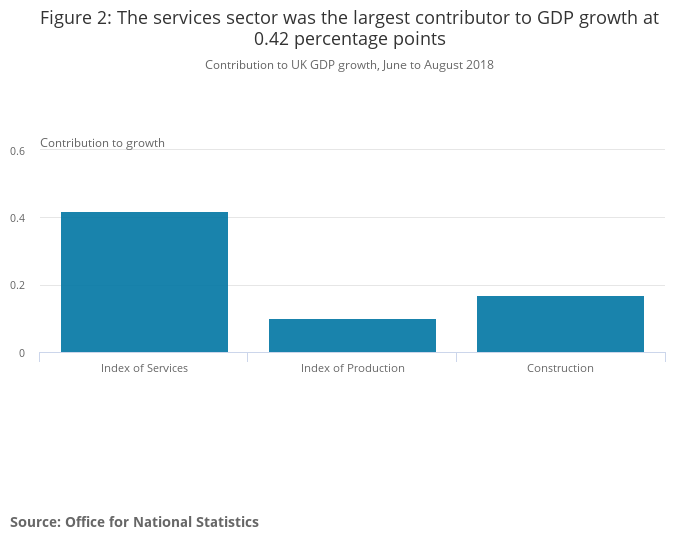
All three main sectors contributed to GDP growth in the three months to August. Services grew 0.42%, production grew 0.10%, construction grew 0.17%.
Also from UK, industrial production rose 0.2% mom, 1.3% in August, above expectation of 0.1% mom, 1.1% yoy. Manufacturing production dropped -0.2% mom, rose 1.3% yoy, below expectation of 0.2% mom, 1.5% yoy.
Visible trade deficit widened to GBP -11.2B in August, above expectation of GBP -10.9B.
GBP/USD: GDP Data Failed To Produce Any Move
Brexit news is likely to bring another major move for sterling and this could be this week
No move in Pound despite the fact that the manufacturing production numbers were weak and the index of services has seen a fairly large drop. But looking at the GDP data, it becomes clear that the country's economic health isn’t that. It is on course for its best calendar quarter in nearly two years.
In terms of currency pairs, if you are measuring the strength in Pound against the euro, then it is definitely a wrong strategy. Yes, the GBP/EUR pair is trading near 3-1/2 month high, but this is mainly because of the weakness in the euro. The real strength of the British Pound can be measured against the dollar.
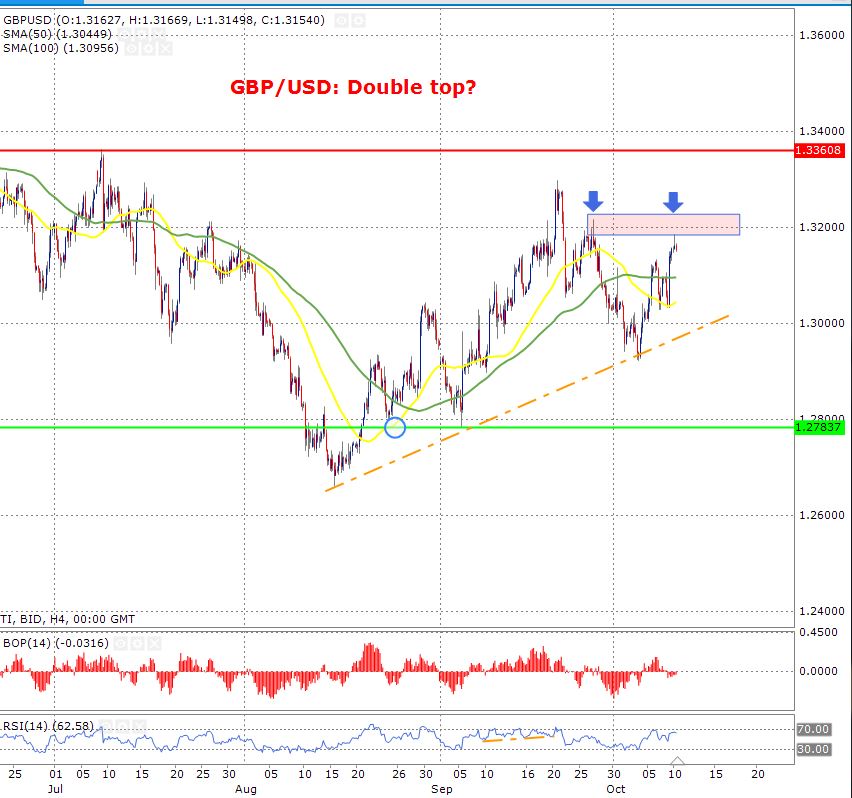
Moving forward, a strong move is still on the card and this move will be driven by Brexit headline. It is likely that traders will play a catch-up game. This is because the price hasn’t broken out of its range (1.29-1.33). The Brexit headline this week will push the price out of this range. Looking at the spot and options market, one element is pretty clear that the British pound remains out of favour.
Speaking purely from a technical perspective, the price is trading above its upward trend line (shown in orange). This confirms that the upward trend intact. Further confidence in the upward trend comes from the fact that the price is trading above the 50 and 100- day moving average (shown in green and yellow respectively).
For those who are holding long positions on the GBP/USD pair, the price could be forming a double top. This is pattern which usually pushes the price lower.
The support level is at 1.2783 and the resistance is at 1.3360.
AUDUSD Outlook: Recovery Attempts Face Strong Headwinds From 10SMA /Fibo Barriers
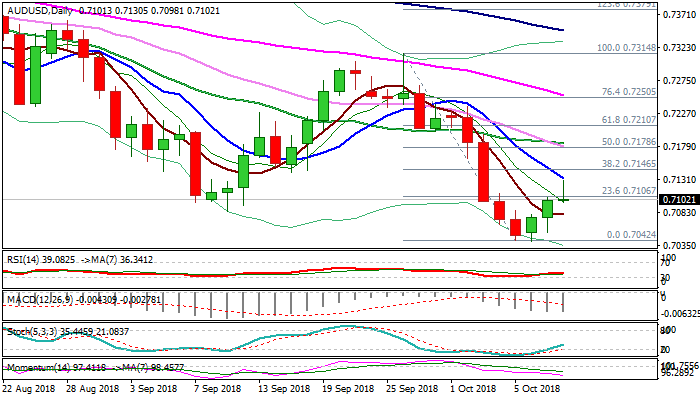
Recovery rally from temporary base at 0.7042 extends into third straight day but rally was so far capped by falling 10SMA (0.7133), showing initial signs of stall.
North-heading slow stochastic which reversed from oversold territory supports for further recovery, but momentum remains negative and MA’s in bearish configuration warn.
Recovery needs sustained break above 10SMA and nearby Fibo barrier at 0.7146 (38.2% of 0.7314/0.7042) to generate fresh bullish signal for extension.
Negative fundamentals keep the downside vulnerable, with larger bears taking a breather before resuming.
Break below key supports at 0.7042/00 would confirm bearish continuation.
Res: 0.7133, 0.7146, 0.7183, 0.7210
Sup: 0.7080, 0.7054, 0.7041, 0.7000
US Treasurer Mnuchin warns China on competitive Yuan devaluation
US Treasury Secretary Steven Mnuchin warned China in a Financial Times interview on currency manipulation. He said that "as we look at trade issues, there is no question that we want to make sure China is not doing competitive devaluations." Nonetheless, Mnuchin also acknowledged that Chinese Yuan "depreciated significantly" due to "various factors". He added "one of those factors has to do with their own economic issues and what has gone on in the Chinese economy."
Earlier this week, Bloomberg reported that Mnuchin faced pressure from within the White House to formally designate China as currency manipulator. The Treasury Department is expected to release its semiannual currency report later this month. And we'll see Mnuchin's eventual stance then.
There are clear rules for the Treasury to decide whether a country is manipulating its currency. Rules aside, as we argued in our report, China has been clearly intervening in the markets to "halt" or "slow" the sharp decline of the Yuan exchange rate. It's clearly seen by almost everyone sensible in Asia that the Yuan and Chinese stocks are in deep trouble facing the risks of trade war escalations.
And it's unknown why part of the US administration continued to lie about intention devaluation by China on the Yuan. Though, we wouldn't mind the US just face the facts by naming China as currency manipulator and requests it stopping to support the Yuan exchange rate.
EUR/USD Completes Bearish Wave-A And Starts Wave-B
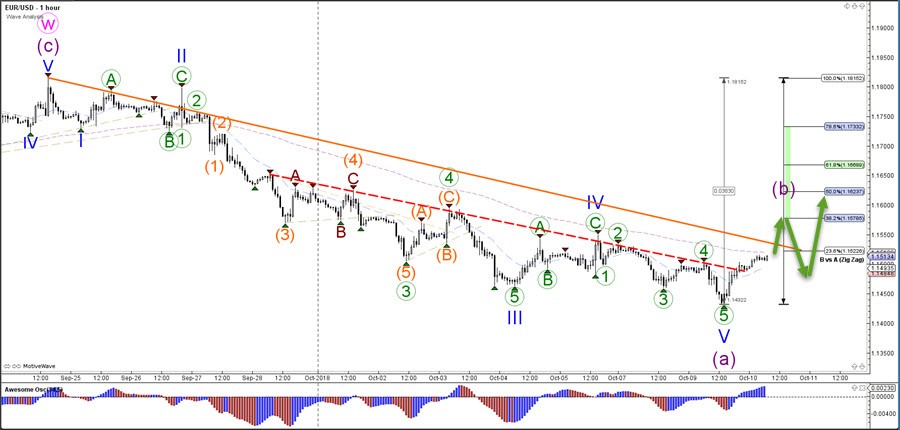
The EUR/USD broke above the resistance trend line (dotted red) after making a bullish bounce around 1.1450. Could indicate a larger bullish retracement?
The EUR/USD is probably ready to build a larger wave B (purple) correction after completing wave A (purple) at the most recent low unless price manages to break below the bottom. A break of the bottom could indicate a downtrend and could price challenge 1.14 and then 1.13. A bullish move could see price head up towards the Fibonacci resistance.
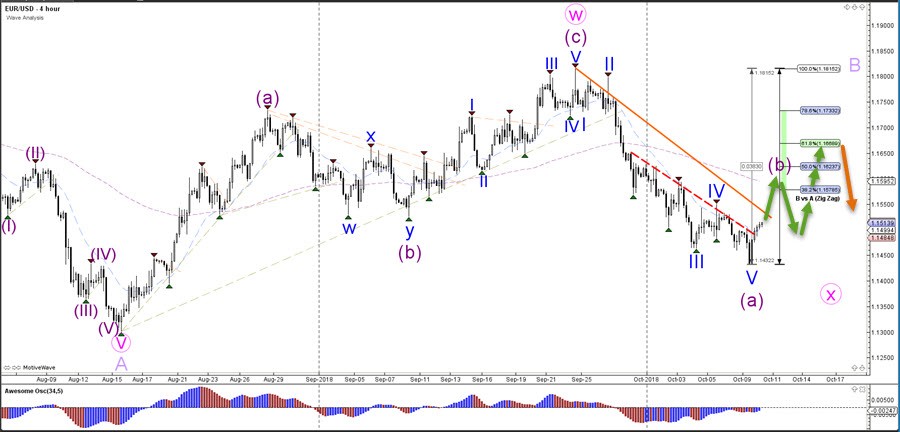
The EUR/USD seems to have completed 5 waves (blue) within wave A (purple). A break above the resistance trend line (orange) could confirm the breakout. Price will find resistance at the Fibonacci retracement levels of wave B.
USDJPY Outlook: Bears Face Strong Headwinds From Important Fibo Support At 112.95
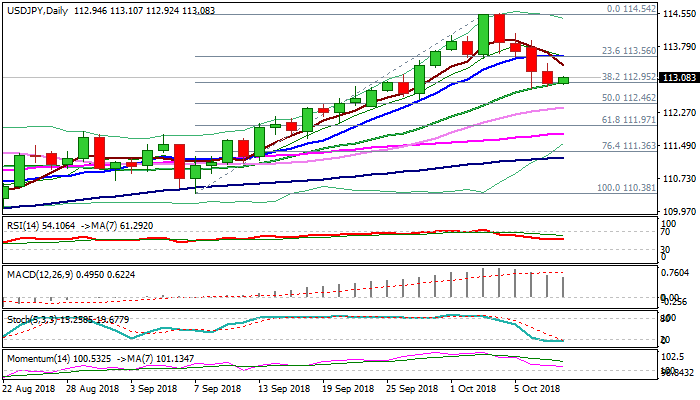
Steep four-day fall from 114.54 double top found footstep at 112.95 Fibo support (38.2% of 110.38/114.54, reinforced by rising 20SMA), with consolidation under way in early Wednesday's trading.
Pullback should be ideally contained here to keep overall bulls in play.
Oversold slow stochastic on daily chart supports scenario, but weakening momentum keeps the downside vulnerable.
Violation of 112.95 handle would risk extension towards 112.46 pivot (Fibo 50%/daily Kijun-sen) loss of which will be bearish.
Break and close above 10SMA (113.59) is needed to neutralize and shift near-term focus higher.
Res: 113.39, 113.59, 113.94, 114.10
Sup: 112.95, 112.46, 112.38, 111.97
Why IMF’s Warning Doesn’t Matter For Bitcoin
Bitcoin rally could pick up steam during this month and a poor earning season over in the U.S. would fuel this rally
The International Monetary Fund downgraded the world economic growth outlook and this spurred the risk-off trade across the globe. The risk-off trade brought some life for bitcoin. It made a high of $6,656 but the price has retraced from this level as the move wasn’t supported by volume. What this means is that any breakout, upward or downward, should have healthy volume behind it and only this assures that the price would continue its move from here. If the volume isn’t there, it is more than likely that the breakout is only a trap.
The fact which has derailed the rally for bitcoin is that the speculators failed to see the IMF has also raised its concern about the cryptocurrency space. The Fund clearly stated in its World Outlook report “Cybersecurity breaches and cyber attacks on critical financial infrastructure represent an additional source of risk because they could undermine cross-border payment systems and disrupt the flow of goods and services. Continued rapid growth of crypto assets could create new vulnerabilities in the international financial system.”
As always, the upward momentum for bitcoin is lacking one critical element; participation from the wider community. Remember, the last year’s move towards the $20K was supported by the retail client. It was this crowd which was going crazy about the cryptocurrency thinking that buying bitcoin is the shortcut for them to acquire that Lambo which they always wanted.
No matter which exchange you look at, there is one common theme- there is no volume. A lot of questions are being raised about the opening of new accounts with various different exchanges and again the ugly fact is that the absence of a reliable third party auditor, no one can be certain if the audit process at these exchanges is as accurate as it should.
Bitcoin needs some sort of a blessing and only that can revitalise the rally for the currency. This particular blessing could be in the form of approval of an ETF from the U.S. Securities Exchange Commission (SEC). The department has invited parties or persons (basically public) to share their views in support of, or in opposition to, bitcoin ETFs. The date which is set for this is October 26th, 2018. To date, the SEC hasn’t approved any bitcoin ETF, in fact it has rejected nearly nine applications in this space.
I think that the SEC seeking a public opinion about the Bitcoin ETF is a positive sign, the department perhaps wants to respect the public opinion and most importantly wants to see the accurate landscape. If the public interest shows that the support is in favour of ETF it is highly unlikely that the department would reject an actual application which satisfies their criteria. In other words, this softened stance towards the industry by the SEC should bring the bull rally which the industry has been waiting for since last year.
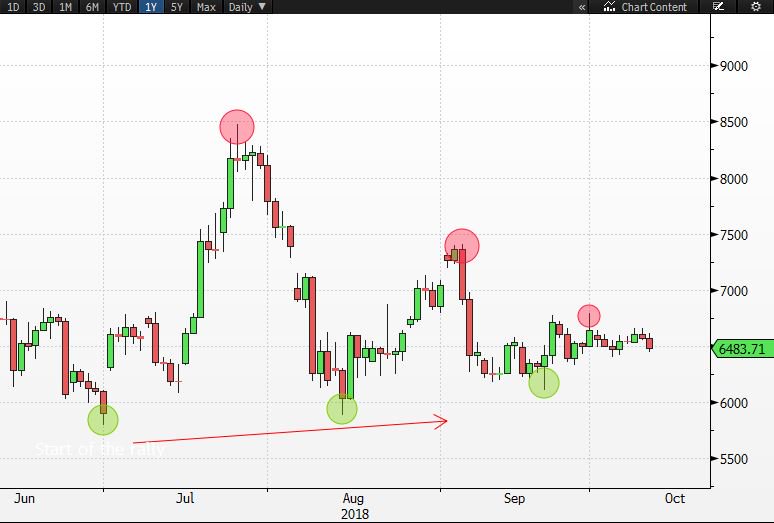
In terms of technical analysis, I am going to avoid all those crazy jargons and keep things simple. The definition of an uptrend says that we should have higher lows and higher highs. The definition for downtrend is completely opposite to that of the uptrend. So, by looking at the chart below, we can't say that the price has an uptrend or downtrend. We have lower highs (shown by green circle) and then we have lower highs (shown by red circles). Hence, the only take away from this could be that as long as the previous lower low stays intact- meaning the price doesn’t start to make lower lows, the odds will remain intact that the price is likely to move higher.
We do think that the uptrend for Bitcoin could shape up this month because the global trade war has made many investors nervous and if the earning season over in the U.S. shows that analysts have downgraded their future forecast for earnings, this would create even bigger rout in the market. The U.S. mid-term elections aren’t that far either and the ongoing tussle between Italy and Berlin is only becoming worse.
Fresh Dose Of Brexit Optimism Lifts Pound, Key UK Data And US Factory Inflation Coming Up
Here are the latest developments in global markets:
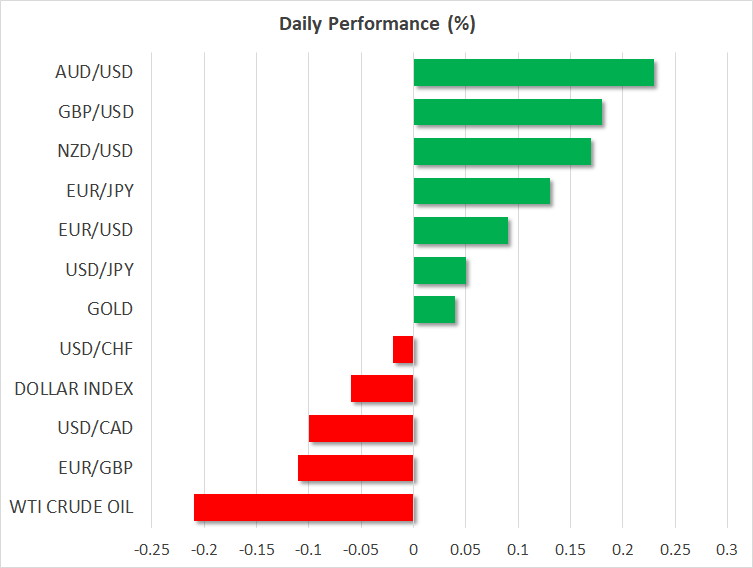
FOREX: The dollar index is fractionally lower on Wednesday (-0.06%), after finishing the previous session down as well, weighed on by a slight pullback in US bond yields. The British pound outperformed, as fresh media reports amplified optimism that a Brexit deal may be reached by next week. On the other hand, the euro surrendered ground across the board, even despite some soothing remarks by the Italian PM.
STOCKS: Wall Street closed mostly in the red on Tuesday, albeit only modestly, as concerns around elevated bond yields and a worsening outlook for global growth following the latest IMF downgrades kept risk appetite in check. The Dow Jones (-0.21%) underperformed, while the benchmark S&P 500 (-0.14%) wasn’t far behind. The tech-heavy Nasdaq Composite though, inched higher by a marginal 0.03%. Sentiment was a little better in Asia on Wednesday. In Japan, both the Nikkei 225 and the Topix climbed by 0.16%, while in Hong Kong, the Hang Seng gained 0.39%. In Europe, risk appetite remained sour, as futures tracking all the major indices are flashing red, pointing to a lower open today.
COMMODITIES: Oil rose on Tuesday, on the back of news that Hurricane Michael turned towards Florida, leading to the shutdown of nearly 40% of crude production in the US Gulf of Mexico. On the other hand, the outlook for demand darkened as the IMF cut its forecasts for global growth, thereby keeping a lid on gains in the precious liquid. Prices pulled back somewhat on Wednesday, with WTI dipping by 0.21% to $74.78 per barrel, and Brent inching down by 0.18% at $84.85/barrel. In precious metals, gold is nearly flat today (+0.04%) at $1,188 per ounce, trading close to the lower bound of the range it has been contained in recently
Major movers: Sterling claws its way higher on hints of imminent Brexit deal
The British pound ended up being the best performer in Tuesday’s session, gaining ground against all its major peers as a fresh round of Brexit headlines painted a brighter picture around the prospect of a near-term deal. Media reports suggested the EU and UK are making material progress in the Brexit talks, and that the divorce terms may be agreed by Monday, ahead of the all-important EU summit next week. Although unconfirmed, investors seem to have taken the news at face value, immediately pricing out some of the risk-premium on the pound.
While it’s not out of the question that an accord could be reached by Monday, one would be forgiven to take this with a grain of salt. The absence of detail in these reports suggests some caution is warranted, as this may simply be another dose of optimism at this point. That said, it is becoming increasingly clearer that momentum is shifting in favor of a deal. The real question may be whether one will be delivered by next week, hence catapulting sterling higher, or whether the proverbial can will be kicked down the road for the umpteenth time, leading investors to rein in their optimism and thereby weighing on the pound.
In the rest of the G10 FX space, the safe-haven yen was the second-best performer, as markets remained largely in risk-off mode amid concerns around a potential tariff-driven slowdown in China, jitters around elevated bond yields, as well as the unresolved situation in Italy. On the latter subject, Italy’s PM Conte said yesterday markets will calm down when investors have read the details of the highly-disputed budget. That helped bring some relief to the battered euro, though the single currency still underperformed, finishing the day lower across the board.
The dollar meanwhile, gave back early gains to close slightly lower against a basket of six major currencies, mimicking similar moves in the yields of longer-dated US Treasuries. Once again, the US President voiced his displeasure with the Fed’s pace of raising rates. He said the Fed doesn’t have to hike as fast when there are no signs of inflation in the economy, though he also noted he doesn’t want to interfere in monetary policy decisions. There wasn’t much market reaction, as investors have likely become accustomed to such remarks by now.
Day ahead: Monthly GDP and industrial & manufacturing output out of the UK; US producer prices due
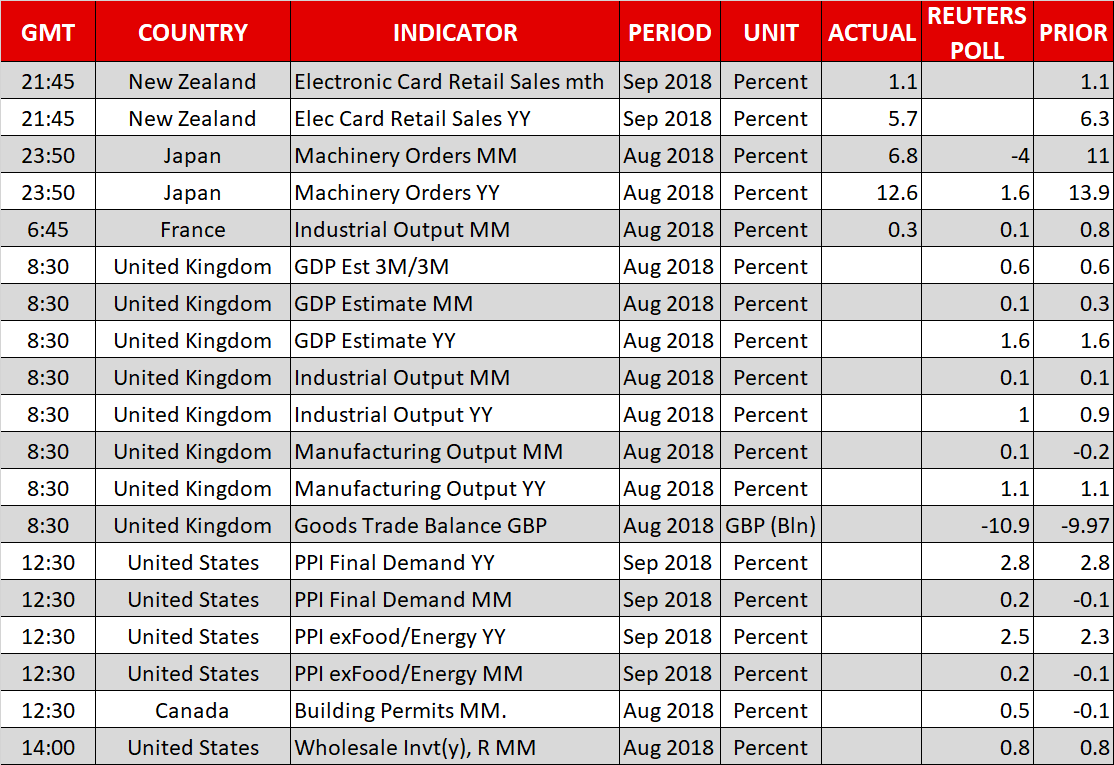
Wednesday’s calendar features monthly GDP figures out of the UK, as well as numbers on industrial and manufacturing output out of the nation. In the US, data on factory inflation will be attracting interest.
At 0830 GMT, UK GDP numbers for August will be made public. The pace of growth is anticipated to ease to 0.1% m/m from 0.3% in July. Despite the monthly deceleration, this would still leave the annual rate of expansion at 1.6%, thus not raising any major red flags on economic activity. On a three-month rolling basis, growth is forecast at 0.6%, which would match July’s rate. Also of importance and due at the same time will be figures on industrial and manufacturing output. Manufacturing production is projected to re-enter a path of positive growth on a monthly basis during August, after contracting by 0.2% in July.
Furthermore, the UK’s goods trade balance for August is slated for release at 0830 GMT as well. The relevant deficit is expected to stand at 10.90 billion pounds, widening by roughly one billion compared to July.
However, as has been the case in the past, any Brexit developments are likely to steal the thunder from UK economic data, hence driving sterling pairs. In this respect, a report yesterday made reference to a UK-EU deal on the former’s exit from the bloc being reached by Monday.
The prints on September’s US factory inflation as gauged by the producer price index (PPI) will be hitting the markets at 1230 GMT. On a yearly basis, headline PPI is predicted to grow by 2.8%, the same as in August, while the core measure that excludes volatile food and energy items is expected to expand by 2.5%, faster than August’s 2.3%. Traders may use these figures to speculate on how tomorrow’s CPI numbers will turn out. It should be kept in mind though that the two gauges (PPI & CPI) are far from perfectly correlated. Lastly out of the US, August wholesale inventory data will be released at 1400 GMT.
Canadian building permits for August are due at 1230 GMT.
Elsewhere, investor angst over Italy’s budget plans as well as over Sino-US trade tensions remains in the background.
The ECB’s Mersch will be participating in a discussion at 0800 GMT, while Bank of England policymaker Haldane will be giving a speech at 0910 GMT. Fed policymakers Evans (non-voting FOMC member in 2018 – 1415 GMT) and Bostic (voter – 2100 GMT) are also on the agenda.
In energy markets, weekly API data on US crude stocks are due at 2030 GMT.
Technical Analysis: EURGBP bearish as it touches 4-month low; RSI oversold
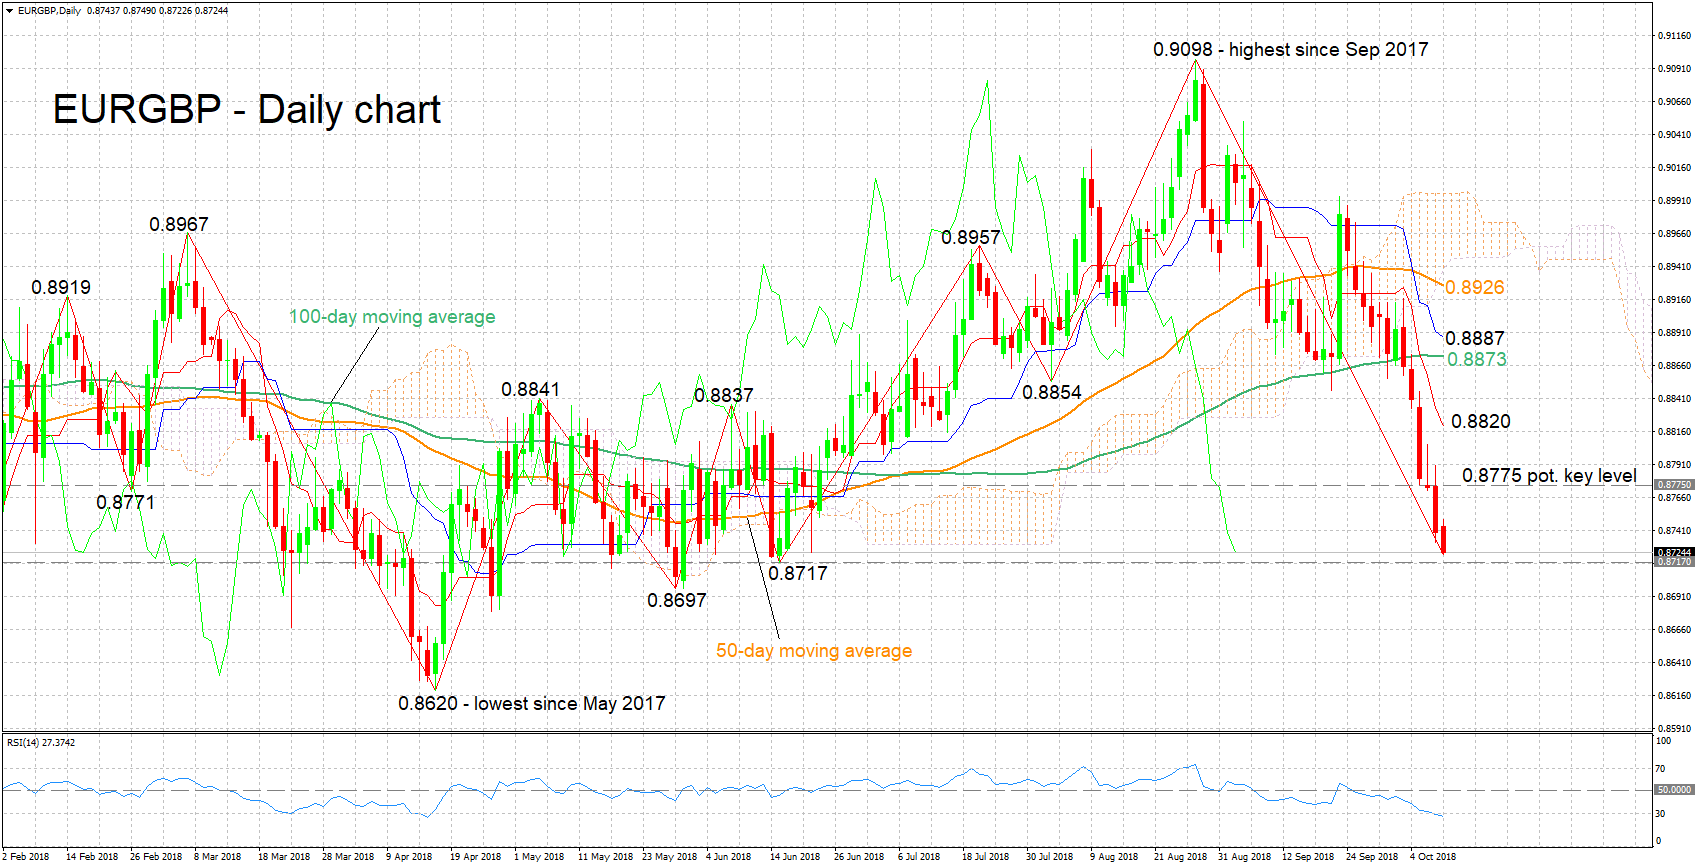
EURGBP touched a four-month low of 0.8723 earlier on Wednesday, after finishing lower in the previous five days. The short-term bias is clearly bearish, something which is also supported by the negatively-aligned Tenkan- and Kijun-sen lines, as well as the declining RSI. Notice though that the RSI has entered oversold territory below 30, a sign that the selloff may be overstretched.
Upbeat UK data or a Brexit deal are likely to push the pair further down. Immediate support could occur around 0.8717, this being a previous low with the area around it encapsulating another bottom from late May at 0.8697. Lower still, the pair’s lowest since May 2017 of 0.8620 would be eyed.
Conversely, disappointing figures or a Brexit deal not receiving traction are expected to boost the pair. The zone around 0.8775 was congested in the past and may act as resistance to gains. Stronger advances would turn the attention to the region around the Tenkan-sen at 0.8820, which captures a couple of tops from previous months as well. Further above, the current level of the 100-day moving average line at 0.8873 would come into scope.
Italian developments can also move the pair.
USD/JPY Triangle Pattern Waiting For Decisive Breakout
The USD/JPY currency pair is testing a key support level and decision zone. The 50% Fibonacci retracement level at 112.83 is a critical bounce or break spot for the wave 4 pattern (blue). A bearish break could see the price test another key support zone at 112.50, but a break below that could indicate a downtrend. A bullish breakout above the resistance trend line (red) could indicate an uptrend continuation.
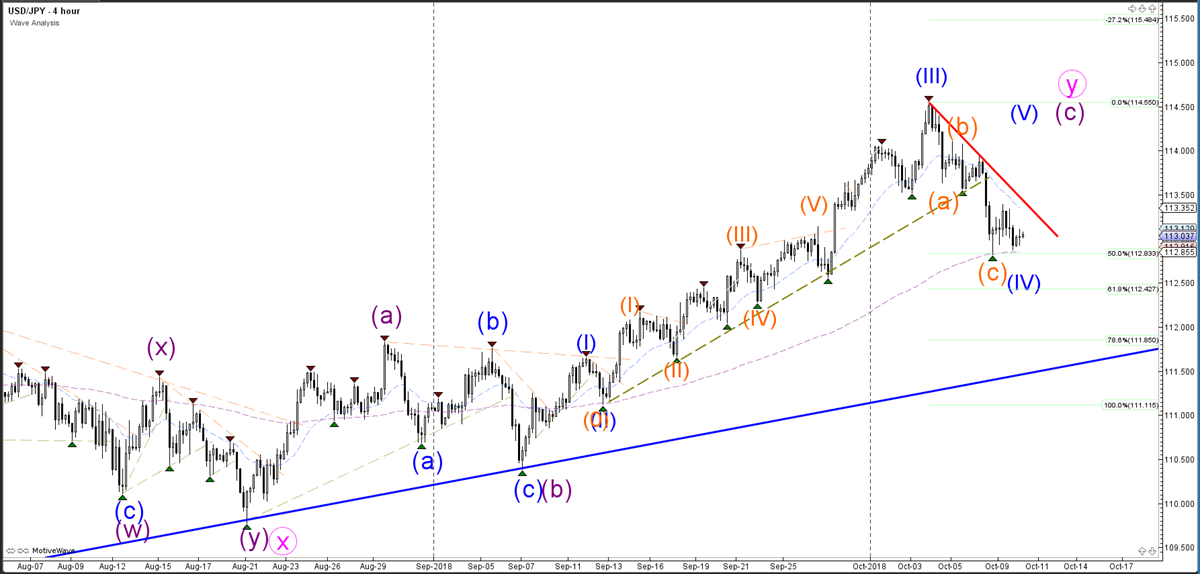
The USD/JPY is building a triangle pattern, and the breakout direction will depend on candlestick patterns that push through support (blue) or resistance (red), and whether the price has a better chance of moving higher or lower.
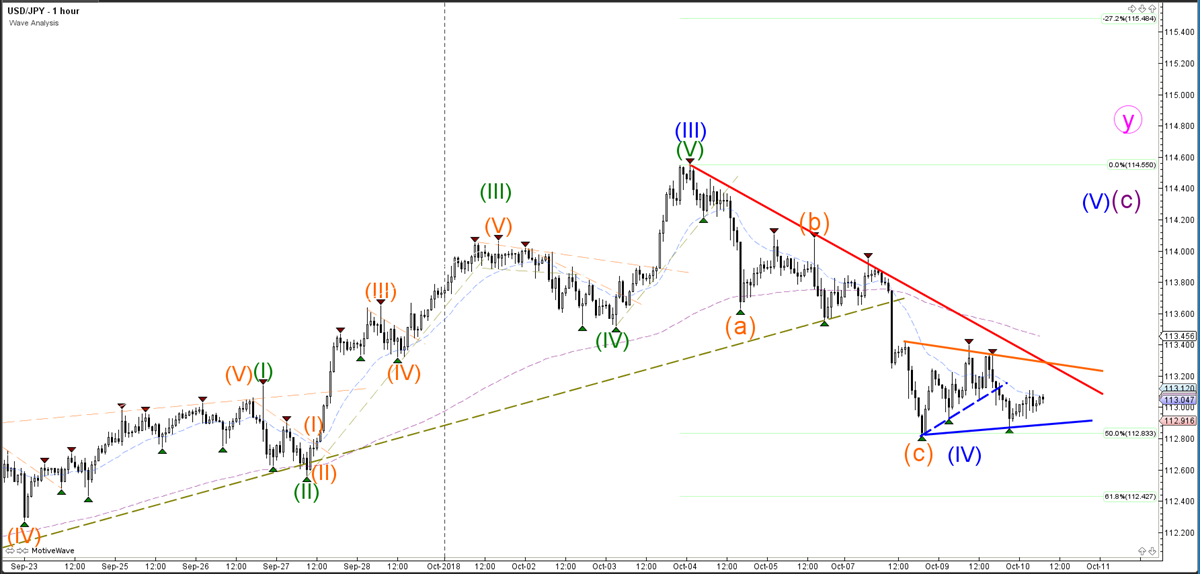
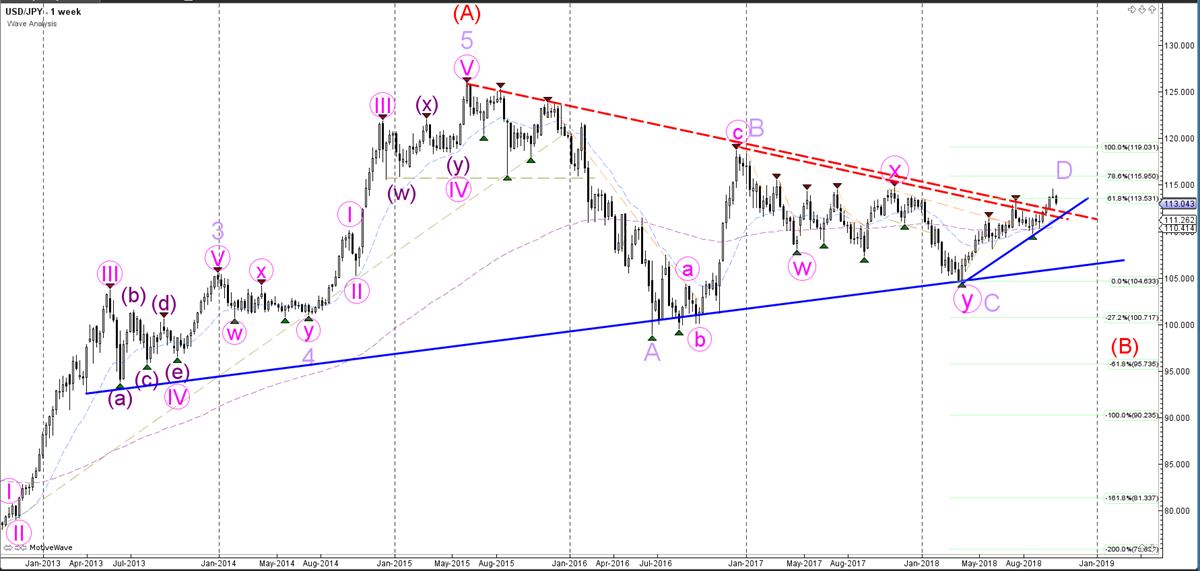
The USD/JPY currency pair broke above the resistance trend lines (dotted red), but the breakout might be limited due to the potential triangle chart pattern that is taking place via the ABCD (purple) within wave B (red). The price could bounce at the Fibonacci levels if the price is indeed building a triangle pattern.
AUD/USD Is At Important Resistance Cluster
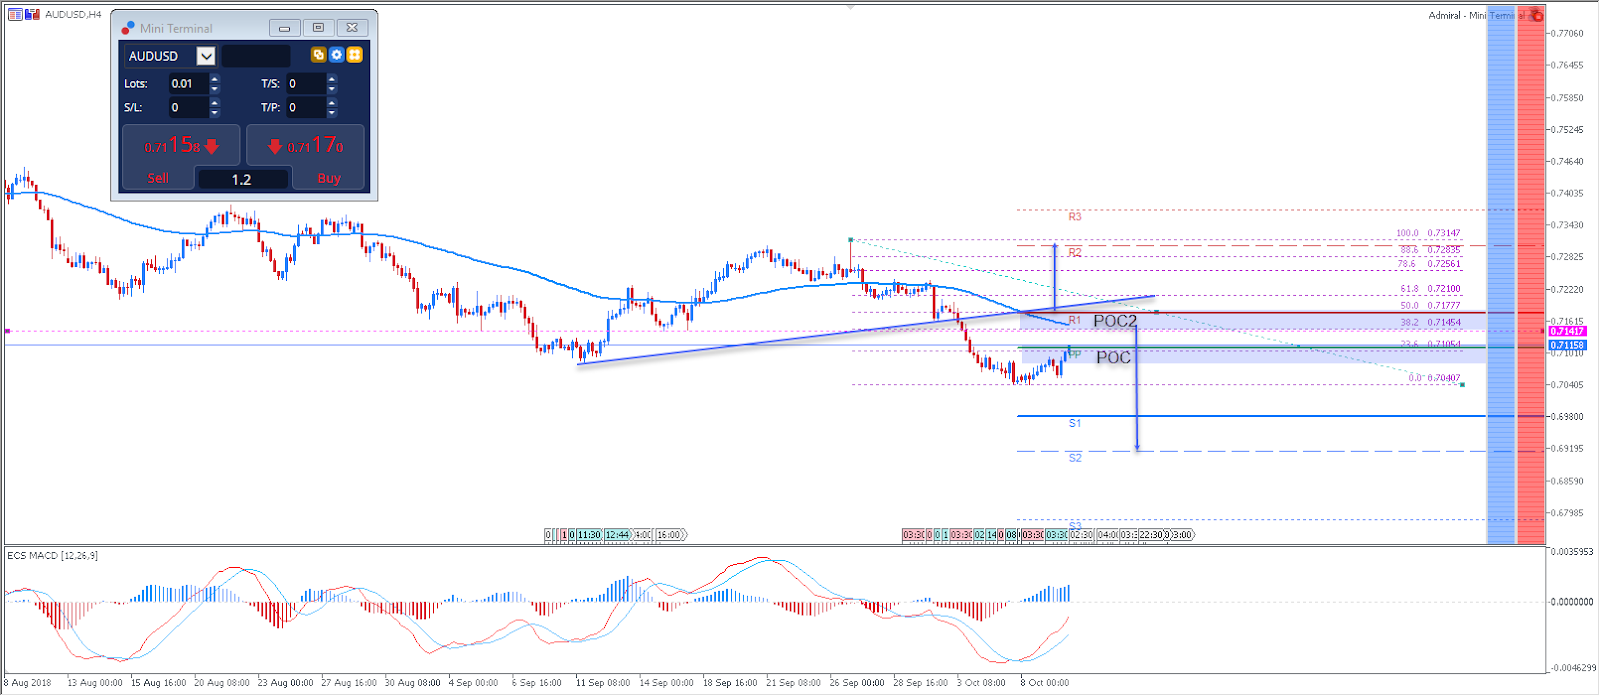
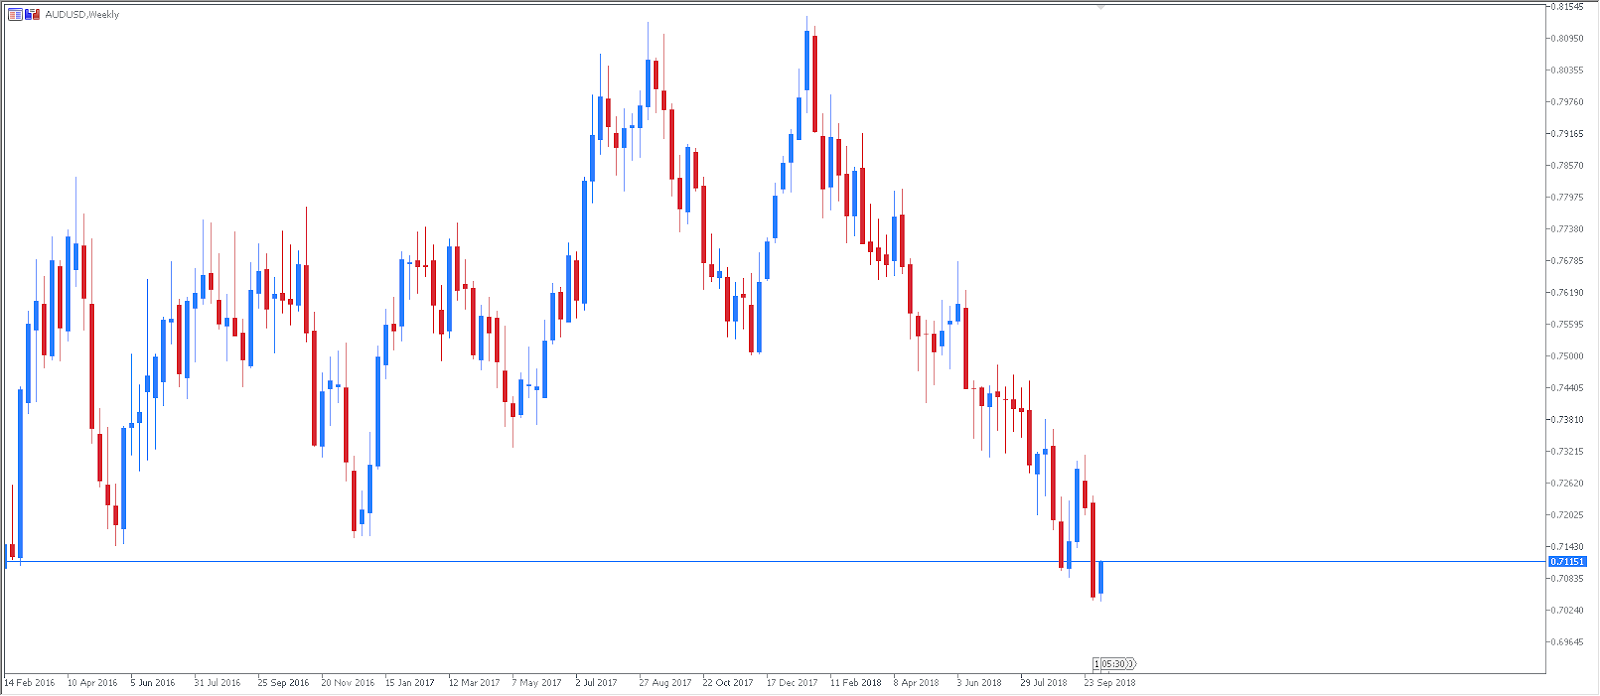
The AUD/USD currency pair is experiencing a retracement after successfully breaking below the Head and Shoulders pattern. Currently the price is hanging around the PP point. We are currently in the POC zone and a reversal pattern could tank the price. The rise in US yields might also follow with the USD appreciation. If long term yields rise, we might see a higher volatility and pressure on emerging markets, thus making the AUD currency weaker. As no major data is scheduled for the AUD, we might see technical analysis prevail at this point. Don't forget to follow our Forex calendar for all regular updates on the news,economic announcements, forecasts and much more.
Technically, the AUD/USD currency pair might exhibit a higher volatility during the Tokyo and US session. The rejection from the POC 1.7100-15 could fuel another bearish momentum. If the price retreats to POC2 1.7130-45 that could be the last line of the defense for bears. Above that the price is bullish and potentially we might see 0.7290 as a bullish target. Rejections from any of the POC zones should target 0.7050 and 0.6980. Always pay attention to price action before you start making new entries, as the price might possibly be making a fake move.
Pivot Lines - Weekly Support and Resistance
POC - POC - Point Of Confluence (The zone where we expect the price to react - aka the entry zone)