

Sample Category Title
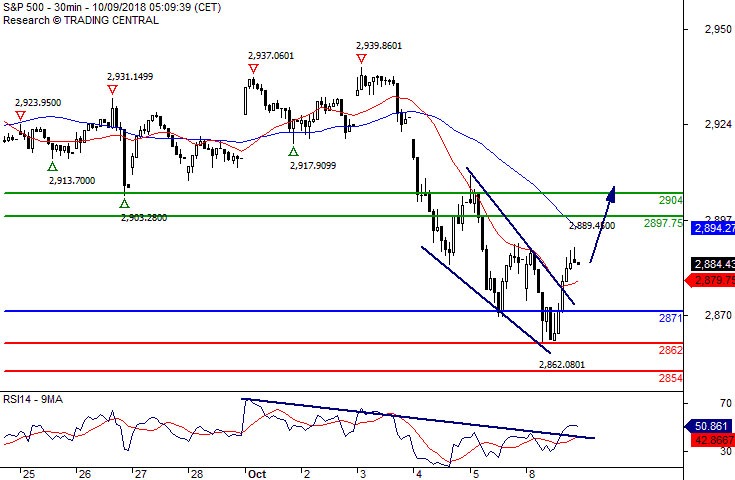
S&P 500 Bullish Bias Above 2871.00
Pivot (invalidation): 2871.00
Our preference Long positions above 2871.00 with targets at 2897.75 & 2904.00 in extension.
Alternative scenario Below 2871.00 look for further downside with 2862.00 & 2854.00 as targets.
Comment The RSI broke above a declining trend line.
DAX The Downside Prevails
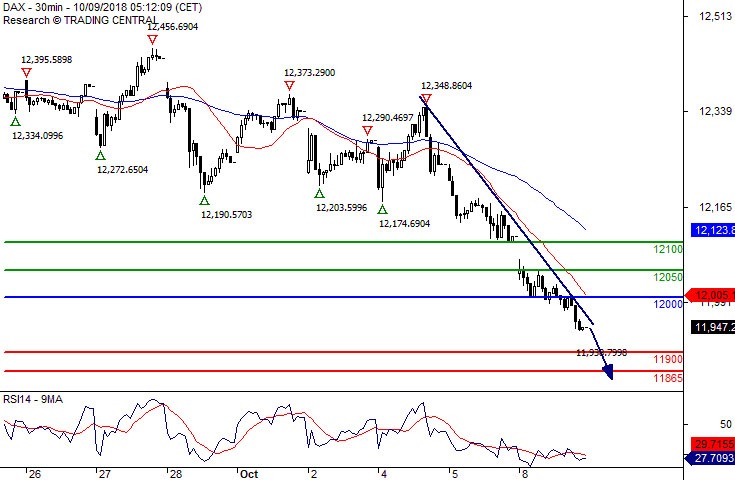
Pivot (invalidation): 12000.00
Our preference Short positions below 12000.00 with targets at 11900.00 & 11865.00 in extension.
Alternative scenario Above 12000.00 look for further upside with 12050.00 & 12100.00 as targets.
Comment The immediate trend remains down and the momentum is strong.
Crude Oil Further Upside
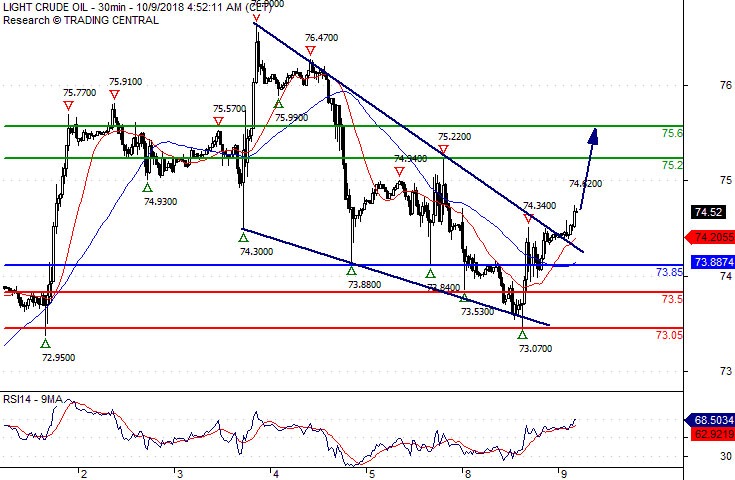
Pivot (invalidation): 73.85
Our preference Long positions above 73.85 with targets at 75.20 & 75.60 in extension.
Alternative scenario Below 73.85 look for further downside with 73.50 & 73.05 as targets.
Comment The RSI shows upside momentum. Crude oil broke above a declining wedge, confirming a bullish outlook.
Silver Spot Caution
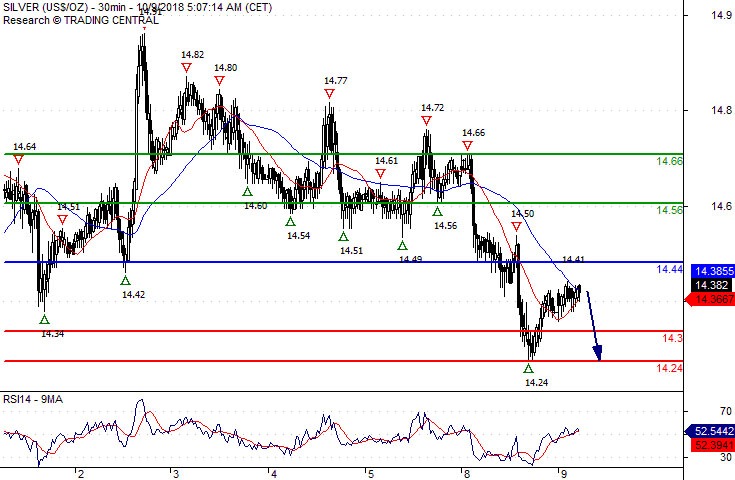
Pivot (invalidation): 14.4400
Our preference Short positions below 14.4400 with targets at 14.3000 & 14.2400 in extension.
Alternative scenario Above 14.4400 look for further upside with 14.5600 & 14.6600 as targets.
Comment The RSI is mixed and calls for caution.
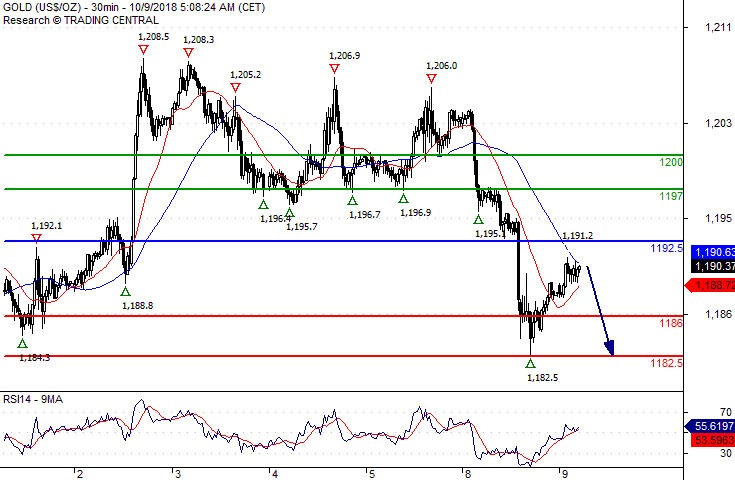
Gold Spot Watch 1186.00
Pivot (invalidation): 1192.50
Our preference Short positions below 1192.50 with targets at 1186.00 & 1182.50 in extension.
Alternative scenario Above 1192.50 look for further upside with 1197.00 & 1200.00 as targets.
Comment As Long as 1192.50 is resistance, expect a return to 1186.00.
EURUSD Outlook: Bears Look For Break Below 1.1463 To Signal Continuation
The Euro accelerated lower at the beginning of the European session after holding within narrow range in Asia on Tuesday.
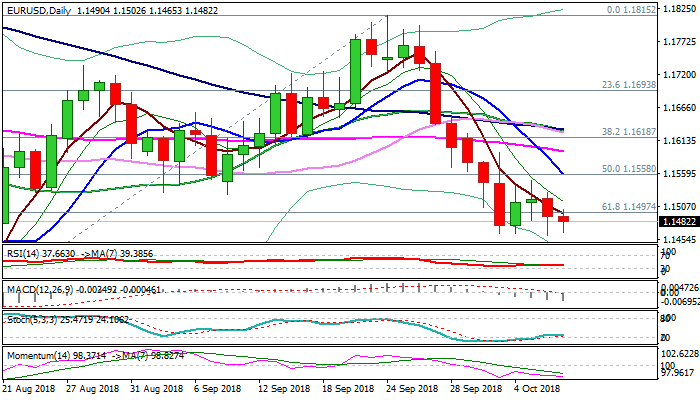
Near term tone remains negative following Monday's close in red, despite strong downside rejection at strong support at 1.1463 (double-bottom).
Monday's close below 1.1497 pivot (Fibo 61.8% of 1.1300/1.1815 ascend) was bearish signal, as former support now reverted to resistance and caps today's action for now.
Daily techs maintain strong bearish momentum for further weakness, as daily cloud is thickening and weighs.
Firm break below 1.1463 is needed to confirm bearish continuation and expose next target at 1.1422 (Fibo 76.4% of 1.1300/1.1815).
Broken Fibo support at 1.1497 marks initial resistance (reinforced by falling 5SMA), followed by Monday's high at 1.1529 and key barrier at 1.1545 (daily cloud base) which is expected to cap extended upticks and maintain bearish bias.
Only sustained break above daily cloud (spanned between 1.1545 and 1.1577) would sideline bears and signal higher base at 1.1463.
Today's calendar is light with German trade data (trade surplus widened in Aug but exports and imports fell below forecasts) being the sole release from the EU, suggesting that techs and news would be pair's key drivers.
Res: 1.1502, 1.1529, 1.1545, 1.1577
Sup: 1.1463, 1.1422, 1.1394, 1.1366
Brent Oil Outlook: Bulls Return To Play After Shallow Pullback
Brent price regained traction and moved higher on Tuesday, as hopes that Iranian oil exports could partially extend after US sanctions kick in November, faded after data released on Monday showed fall in Iran's crude export in the first week of October.
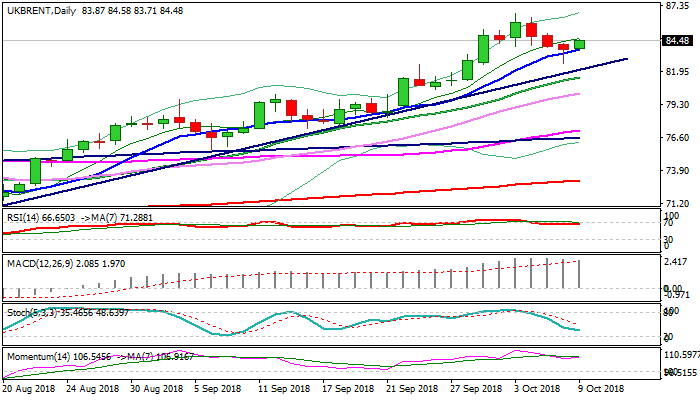
Three-day pullback from new high at $86.73 was strongly rejected at $82.65 on Monday and subsequent bounce left Hammer candle, generating initial reversal signal.
Close above cracked rising 10SMA which contained pullback and continues to track the ascend, adds to positive signals.
Today's strong bullish close is needed to complete reversal pattern on daily chart and signal further recovery for possible retest of key barrier at $86.73 (03 Oct high).
Rising 10SMA marks initial support at $83.79, followed by Monday's spike low at $82.65 and bull-trendline at $82.39, break of which would sideline bulls for deeper correction.
Res: 85.11, 86.73, 87.92, 90.00
Sup: 83.79, 82.65, 82.39, 81.48
Forex Technical Analysis: EUR/USD, USD/JPY, GBP/USD
EUR/USD
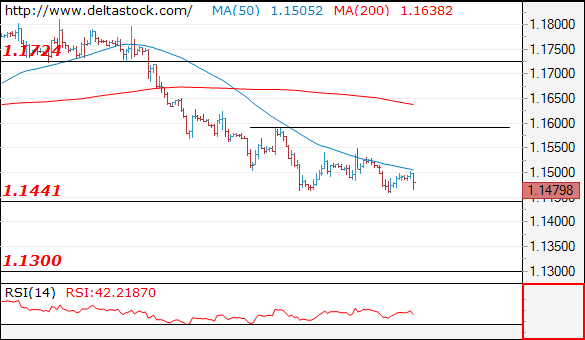
Current level - 1.1479
The slow pace signals a typical consolidation pattern and I expect a break through 1.1440 to initiate a continuation towards 1.1300 weekly low. Major resistance lies at 1.1550.
| Resistance | Support | ||
| intraday | intraweek | intraday | intraweek |
| 1.1550 | 1.1835 | 1.1440 | 1.1300 |
| 1.1720 | 1.2010 | 1.1300 | 1.1100 |
USD/JPY
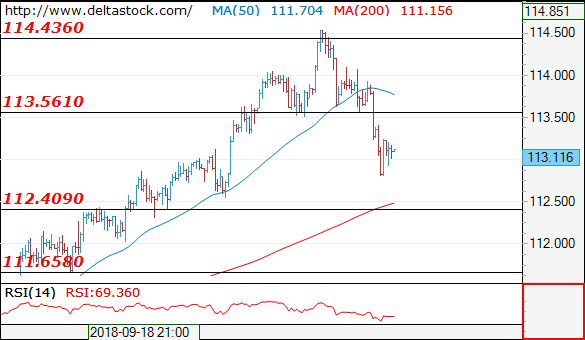
Current level - 113.11
The bias remains bearish, for a dip to 112.40 support zone. Key resistance is projected at 113.50.
| Resistance | Support | ||
| intraday | intraweek | intraday | intraweek |
| 113.50 | 114.40 | 112.40 | 111.65 |
| 114.40 | 114.40 | 112.40 | 110.40 |
GBP/USD
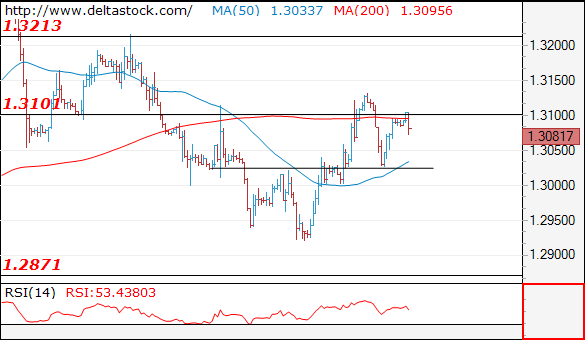
Current level - 1.3081
The rise to 1.3100 resistance should be considered an inner leg of the consolidation pattern below 1.3130 and my outlook is bearish, for another dip to 1.3000 area.
| Resistance | Support | ||
| intraday | intraweek | intraday | intraweek |
| 1.3140 | 1.3440 | 1.3020 | 1.2570 |
| 1.3210 | 1.3440 | 1.2870 | 1.2570 |
Tesla Elliott Wave View: Favoring More Downside To Proceed
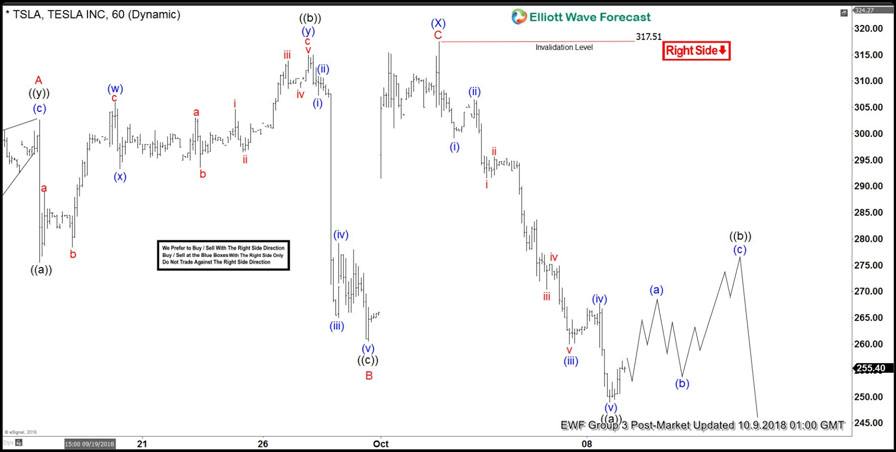
Tesla ticker symbol: $TSLA short-term Elliott wave view suggests that the rally to $317.51 high ended intermediate wave (X) bounce. The internals of that bounce unfolded as zigzag structure where Minor wave A ended in 5 waves at $302.64 high. Down from there, Minor wave B pullback ended as a Flat at $260.56 where lesser degree Minute wave ((a)) ended in swings at $275.50. Minute wave ((b)) ended in 3 swings at $315 high. And Minute wave ((c)) ended 5 waves decline at $260.56 low.
Up from $260.56 low, a rally to $317.51 high in 5 waves ended Minor wave C & also the intermediate wave (X). Down from there, Tesla has made a new low below 9/07/2018 low ($252.25) confirming the next extension lower in intermediate wave (Y) lower. Where initial decline to $249 low ended 5 waves in Minute wave ((a)) of a possible Zigzag structure. Above from there, the stock is doing a bounce in Minute wave ((b)) in 3, 7 or 11 swings. Near-term, while bounces fail below $317.51 high expect stock to fail for more downside. We don’t like buying it as the right side is lower & calling more downside against $317.51 high.
Tesla 1 Hour Elliott Wave Chart
German imports and exports contracted in August, more evidence of slowdown
In seasonally adjusted term, German trade balance widened to EUR 18.3B in August. Export dropped -0.1% yoy while import dropped even more by -2.7% yoy. The data added further evidence that the German economy is losing momentum again. It also echoed industrial production data released yesterday, which unexpectedly contracted -0.3% yoy in August.
In the updated forecasts by IMF, German GDP is expected to grow 1.9% in 2018, a large downward revision from April forecast of 2.5%> For 2019, growth projection was also revised to 1.9%, down from 2.0%.
The German government is due to release its updated economy forecasts this Thursday. And it's expected that there would be downward revision to growth for this year and next too.