Sample Category Title
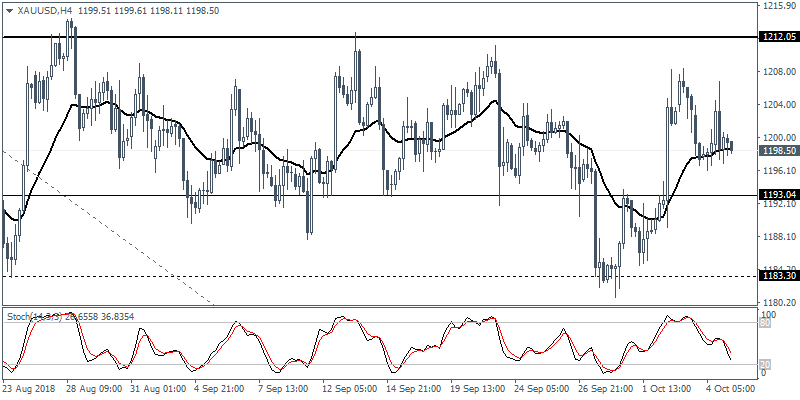
USD/CAD Further Advance
Pivot (invalidation): 1.2885
Our preference Long positions above 1.2885 with targets at 1.2940 & 1.2975 in extension.
Alternative scenario Below 1.2885 look for further downside with 1.2855 & 1.2810 as targets.
Comment The RSI is bullish and calls for further upside.
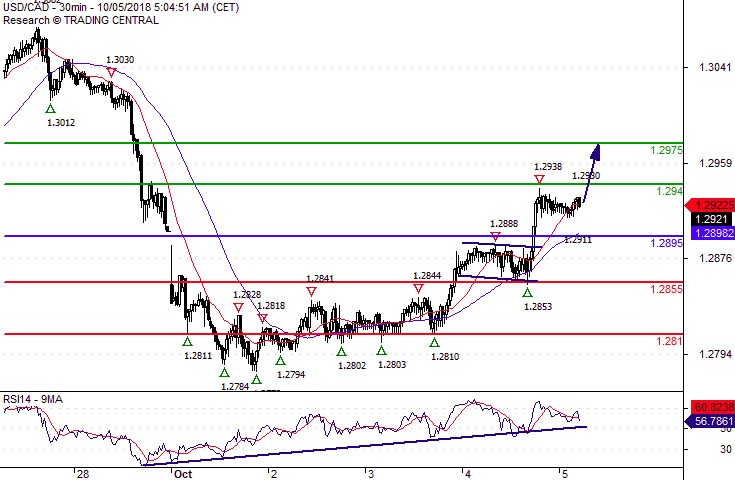
USD/CHF Aim @ 0.9970
Pivot (invalidation): 0.9895
Our preference Long positions above 0.9895 with targets at 0.9935 & 0.9970 in extension.
Alternative scenario Below 0.9895 look for further downside with 0.9860 & 0.9830 as targets.
Comment The RSI calls for a new upleg.
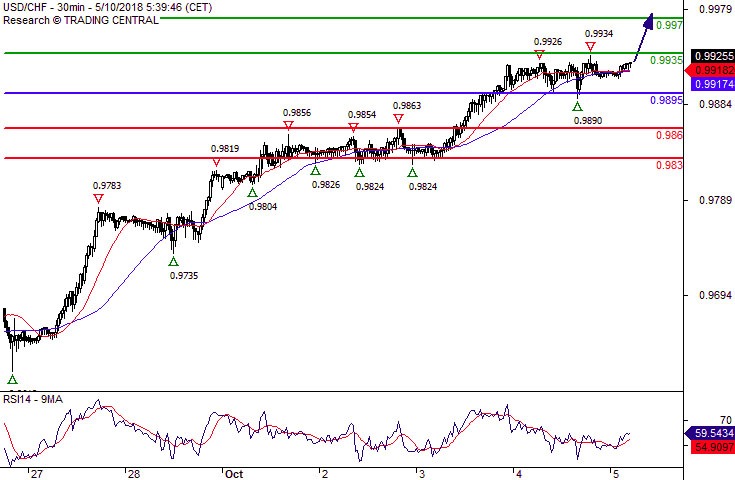
S&P 500 Towards 2883.50
Pivot (invalidation): 2912.00
Our preference Short positions below 2912.00 with targets at 2893.00 & 2883.50 in extension.
Alternative scenario Above 2912.00 look for further upside with 2917.75 & 2931.00 as targets.
Comment The RSI is mixed to bearish.
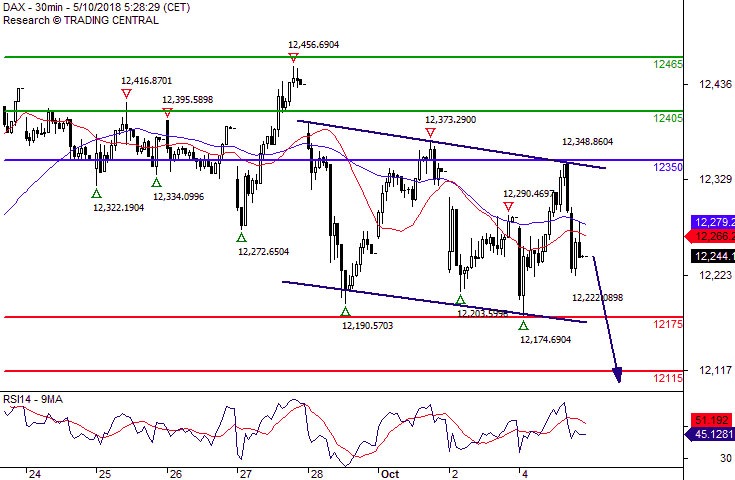
DAX Under Pressure
Pivot (invalidation): 12350.00
Our preference Short positions below 12350.00 with targets at 12175.00 & 12115.00 in extension.
Alternative scenario Above 12350.00 look for further upside with 12405.00 & 12465.00 as targets.
Comment As Long as 12350.00 is resistance, look for choppy price action with a bearish bias.
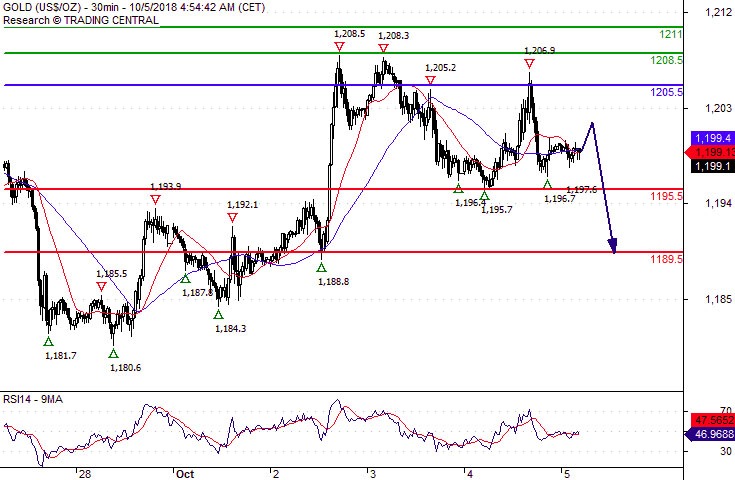
Gold Spot Consolidation
Pivot (invalidation): 1205.50
Our preference Short positions below 1205.50 with targets at 1195.50 & 1189.50 in extension.
Alternative scenario Above 1205.50 look for further upside with 1208.50 & 1211.00 as targets.
Comment As Long as 1205.50 is resistance, look for choppy price action with a bearish bias.
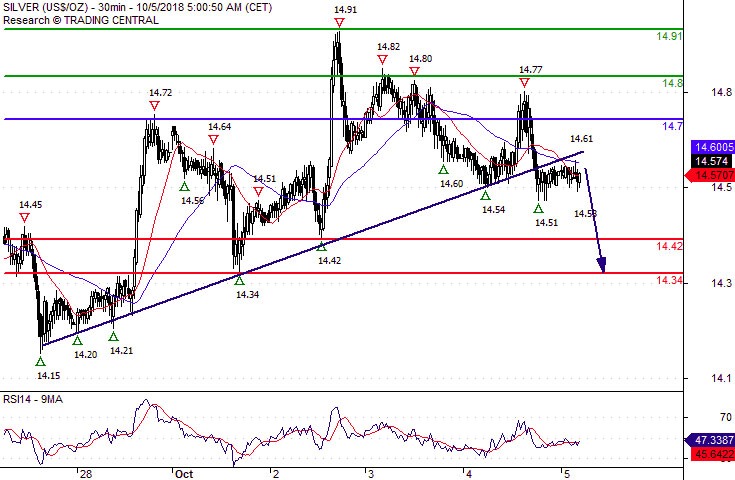
Silver Spot Aim @ 14.3400
Pivot (invalidation): 14.7000
Our preference Short positions below 14.7000 with targets at 14.4200 & 14.3400 in extension.
Alternative scenario Above 14.7000 look for further upside with 14.8000 & 14.9100 as targets.
Comment The RSI lacks upward momentum.
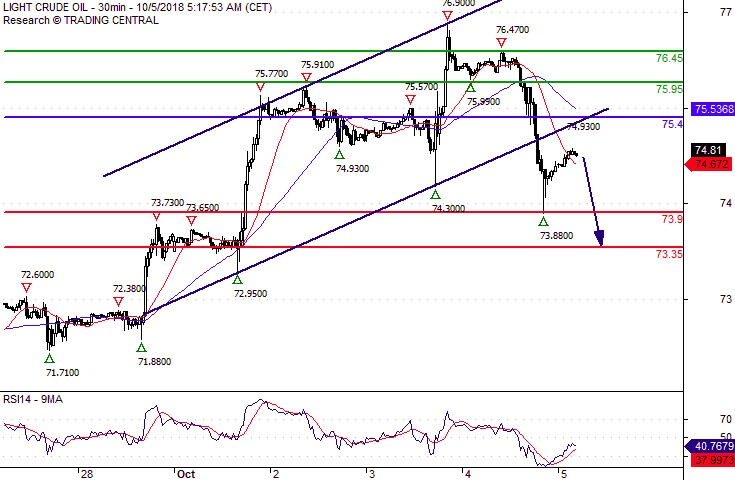
Crude Oil Watch 73.90
Pivot (invalidation): 75.40
Our preference Short positions below 75.40 with targets at 73.90 & 73.35 in extension.
Alternative scenario Above 75.40 look for further upside with 75.95 & 76.45 as targets.
Comment As Long as 75.40 is resistance, expect a return to 73.90. Crude Oil broke below the rising channel.
USDJPY Pulls Below 114.00 As Momentum Indicators Weaken
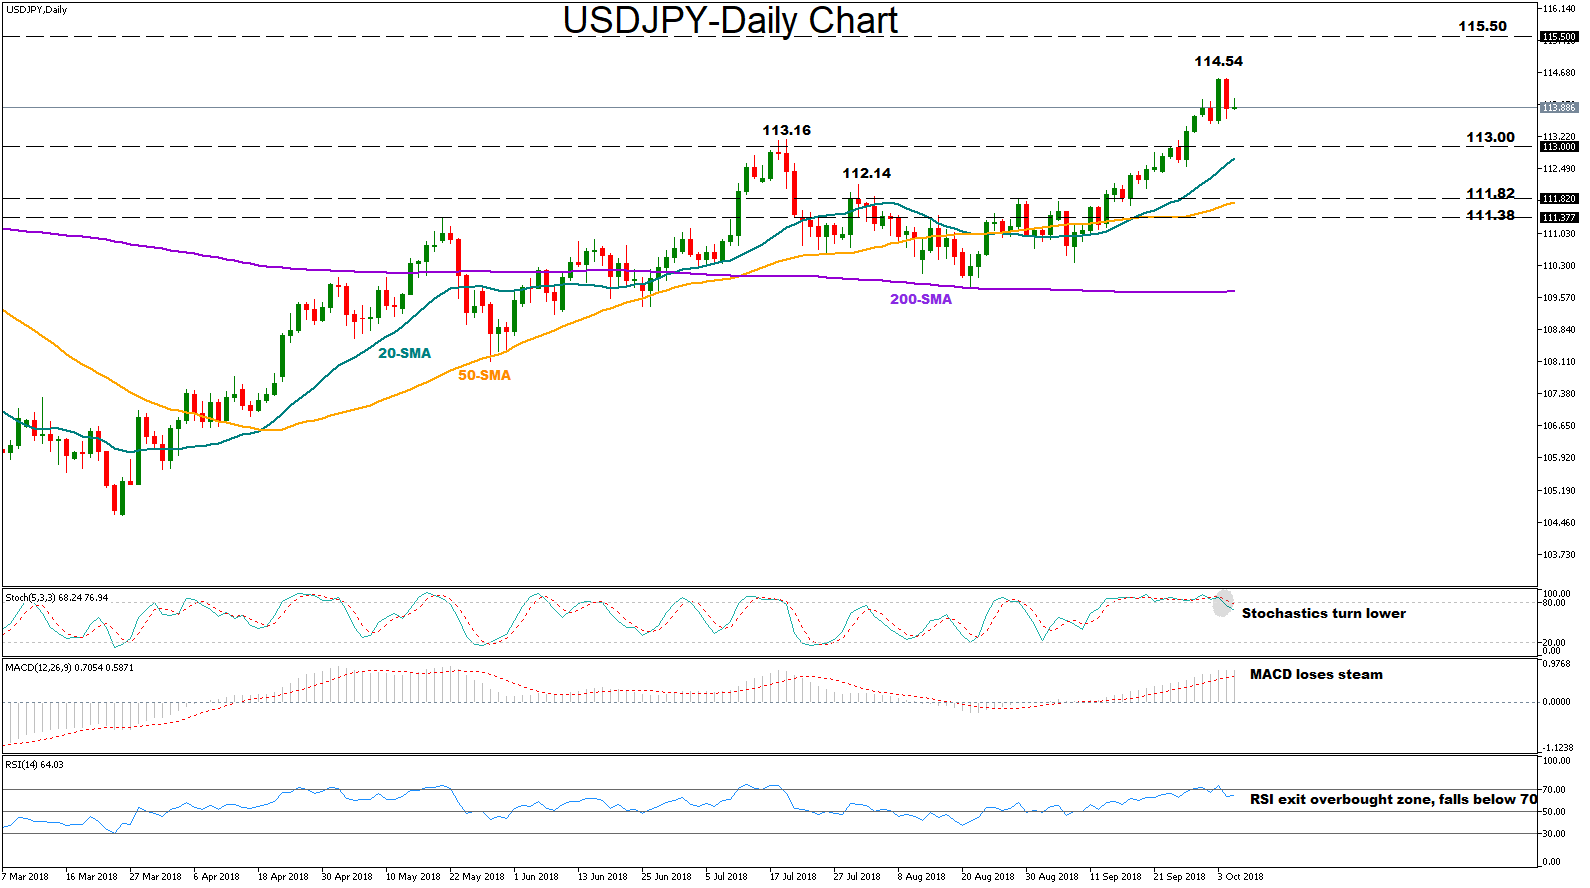
USDJPY has been trending very positively over the past three weeks and is set to close higher for another week. On Thursday the pair hit 11-month highs at 114.54, though it soon returned below the 114.00 round level, with the RSI, Stochastics and the MACD turning weaker, a sign that the spectacular rally could lose steam in the short-term. The (simple) 20- and the 50-day moving average lines, however, continue to strengthen, hinting that the upside trend is likely to stay in place.
Should the price head south, the 113.16 top on July 19 could be a potential support to keep in mind ahead of the 113.00 key level. A break below the latter may increase speculation that the recent rally has reached its peak and is time for the bears to take control, with traders probably looking next to 112.14, the August high. Lower than that, the resistance area between 111.82 and 111.38 could be another barrier in focus.
Alternatively, if the price resumes a bullish mode above 114.00, the bulls are expected to retest Thursday’s high of 114.54. In case this proves a weak obstacle too, a wall may be found around the 115.50 where the price paused on March 2017. Even higher, the door could open for the August 2017 high of 117.52.
In the medium-term picture, USDJPY maintains its bullish profile above the 113.16 high and should the shorter-term moving averages continue to move positively above the longer-term MAs the bullish outlook is likely to hold for longer
Sterling lifted by news that Brexit deal is very close
Sterling is apparently lifted today by news that EU's Brexit negotiating team told EU diplomats that a deal is "very close". And, both sides are working closely for the the summit on October 17-18 first, and then the final one on November 17-18.
Between now and then, October 10 is a key date when EU chief negotiator Michel Barnier will present to European Commission a first draft of the "Outline of new partnership with UK". That's for the trade relationship with UK after Brexit.
The issue on Irish border must be cleared before October 17-18 so as for EU to determine that enough progress is made for moving on the the emerging summit in November, when everything would be finalized.
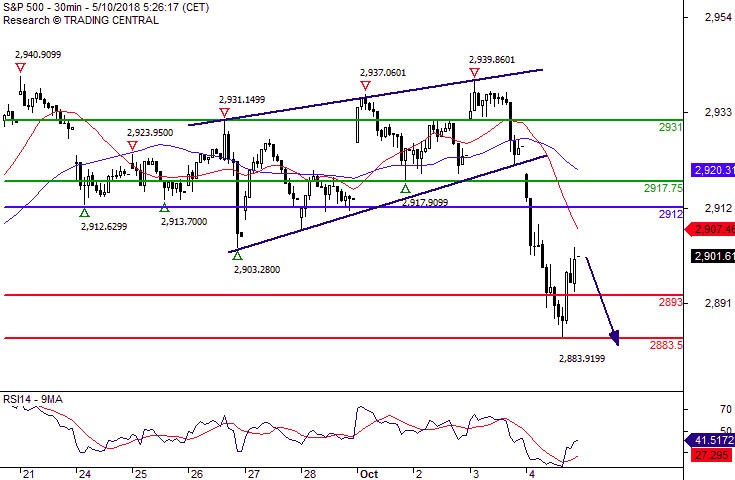
XAUUSD Intraday Analysis
XAUUSD (1198.50): Gold prices are seen consolidating near the 20-period moving average from the 4-hour chart. Price action remains trading sideways. However, there is scope for gold prices to test the upper resistance level at 1212.05. To the downside, the support at 1193.04 will most likely be tested in the short term. A close below this level could push gold prices back down to the 1183.30 level of support.