Sample Category Title
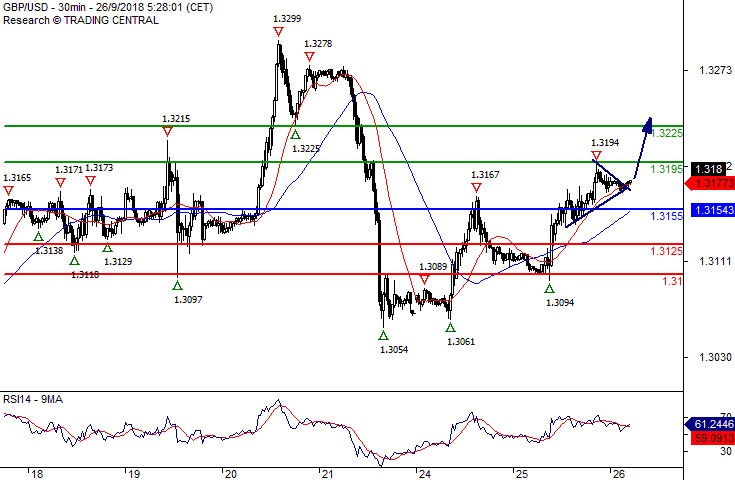
GBP/USD Further Advance
Pivot (invalidation): 1.3155
Our preference Long positions above 1.3155 with targets at 1.3195 & 1.3225 in extension.
Alternative scenario Below 1.3155 look for further downside with 1.3125 & 1.3100 as targets.
Comment The RSI advocates for further upside.
EUR/USD Bullish Bias Above 1.1755
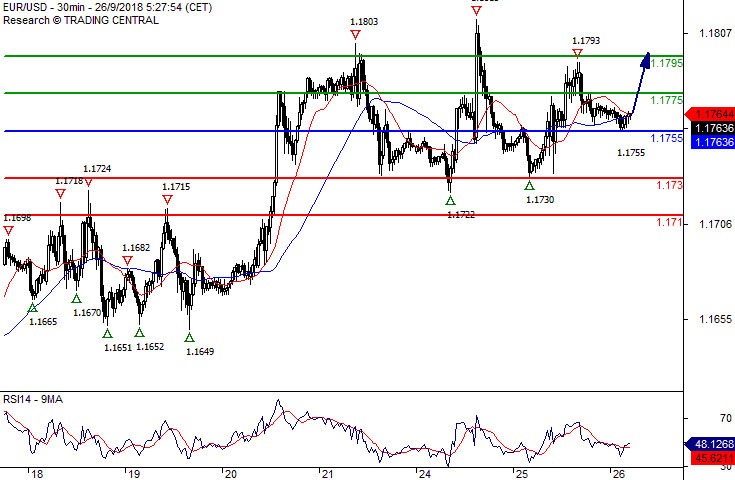
Pivot (invalidation): 1.1755
Our preference Long positions above 1.1755 with targets at 1.1775 & 1.1795 in extension.
Alternative scenario Below 1.1755 look for further downside with 1.1730 & 1.1710 as targets.
Comment A support base at 1.1755 has formed and has allowed for a temporary stabilisation.
EURUSD Outlook: Risk Of Reversal On Multiple Upside Failure
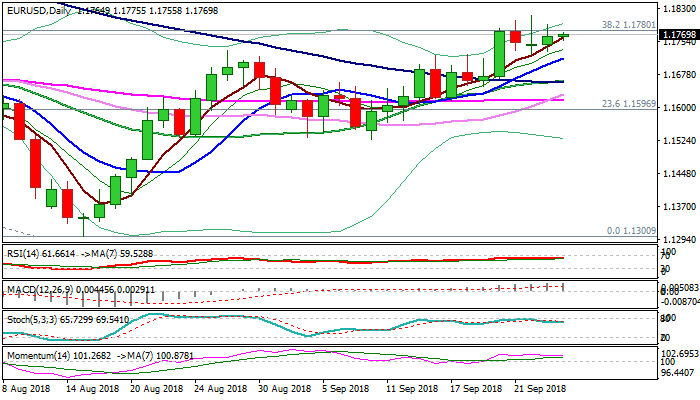
The Euro holds at familiar levels and within triangular directionless range, with negative signals growing after four consecutive failures to close above cracked pivot at 1.1780 (Fibo 38.2% of 1.2555/1.1300 descend).
Adding to negative signals is formation of diamond top pattern on daily chart which could result in pullback.
Break below pattern’s low (1.1724) and rising 10SMA (1.1714) would generate initial negative signals and would spark extension towards 1.1660 zone (converged 20/100SMA) which form bullish cross and expected to contain dips as overall picture is bullish.
Signals of deeper correction which would sideline bulls, could be expected on firm break below 1.1660 support zone.
Fed is expected to provide more clues about pair’s near-term direction as rate hike is widely expected, with more hawkish stance from the central bank to boost the greenback and increase risk of Euro’s deeper pullback.
Res: 1.1792, 1.1815, 1.1848, 1.1900
Sup: 1.1755, 1.1724, 1.1714, 1.1670
XAUUSD Intraday Analysis
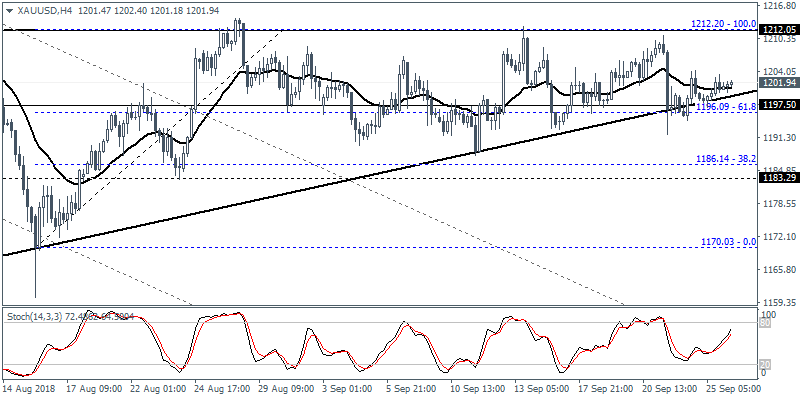
XAUUSD (1201.94): Gold prices were seen holding up above the 1196.10 support level. Price action is seen trading flat currently above this level. The resistance level at 1212.20 could be tested in the near term. Only a breakout above this level will trigger further gains to the upside. To the downside, a breakout below 1196.10 could trigger declines down to the 1186.14 - 1183.30 level.
GBPUSD Intraday Analysis
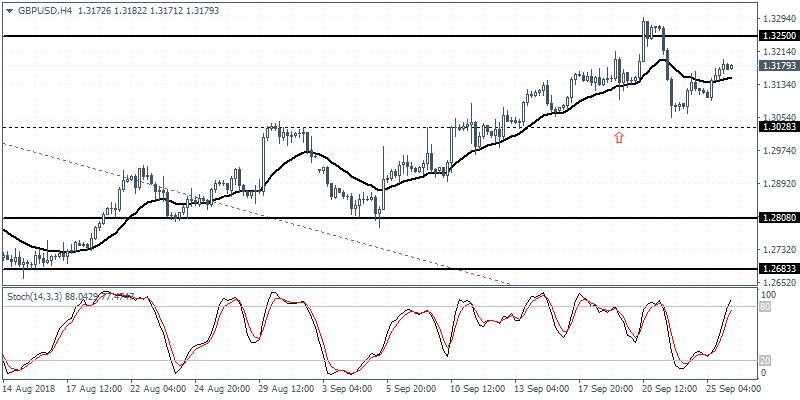
GBPUSD (1.3179): The GBPUSD was seen posting a modest recovery after price action dipped off the 1.3250 resistance. The lower high being formed however could signal another leg to the downside. The support at 1.3028 is likely to be tested in the near term. As long as the support holds, we expect the reversal to eventually test 1.3250 followed by a breakout to the upside.
EURUSD Intraday Analysis
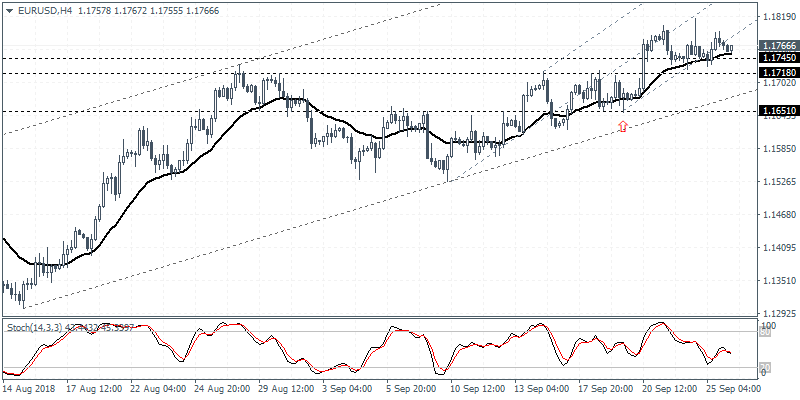
EURUSD (1.1766): The EURUSD currency pair was muted on Wednesday. Price action was muted as the currency pair as seen consolidating above the 1.1745 handle. With the resistance level looming at 1.1960 - 1.1920 the gains are likely to be capped. To the downside, the EURUSD could be seen testing the lower support at 1.1651 if the current support area of 1.1745 - 1.1718 gives way.
Investors Turn To The FOMC Meeting
The U.S. dollar was seen trading subdued on Tuesday. Economic data was sparse. From the Eurozone, the German WPI was seen rising 0.3% on the month. The data beat forecasts of a 0.2% estimates.
Consumer confidence data from the U.S. was seen rising to 138.4. The data beat estimates of 132.2. This marks the highest level in 18 years. Meanwhile, the Richmond Fed manufacturing index was seen rising to 29.0 beating estimates of 22.0
The Bank of Japan will be releasing its core CPI measure in a while. Forecasts point to a 0.6% on the year ending August. This marks a modest increase from 0.5% previously.
The economic data during the European trading session is very quiet. This puts the focus on the Fed meeting due later during the NY trading session. Investors expect the Fed to hike rates by 25 basis points at today's meeting. This would bring the short-term interest rates to 2.0% - 2.25%. It also marks a third rate hike this year.
Fed officials will be releasing the staff economic projections and the dot plot which will act as a guide on where future interest rates are heading. There will also be a press conference due later with Fed Chairman, Powell.
Expect to see some volatility in the markets during the Fed announcement.
EUR/USD Sideways Flat Correction Could Break Soon
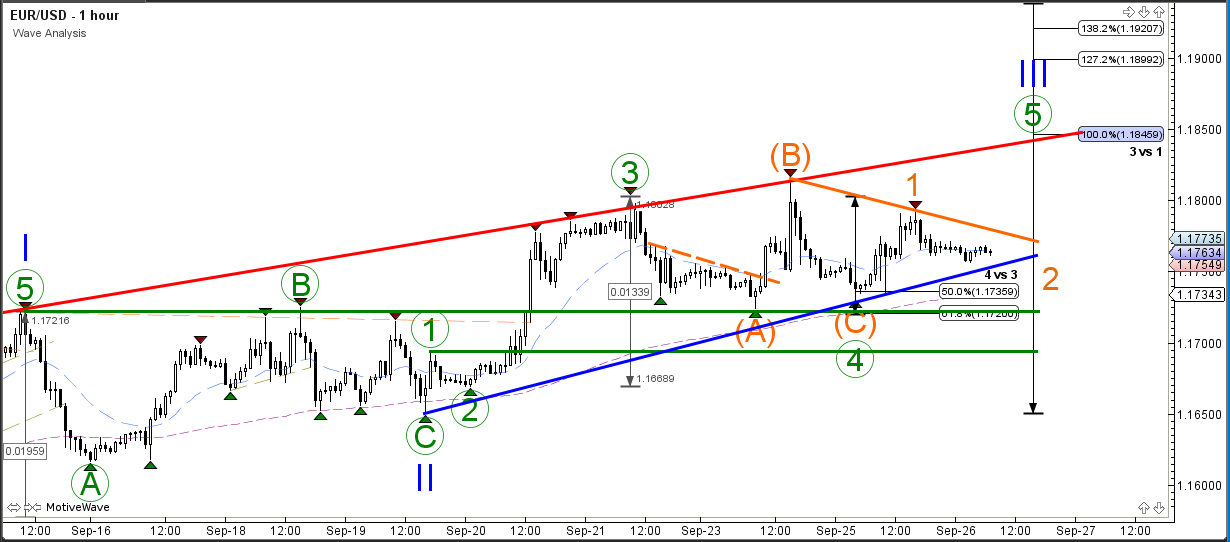
The EURUSD currency pair is still moving sideways as the price remains above the support trend lines (green/blue). A bullish continuation could see the price move up higher towards the Fibonacci targets, whereas a bearish breakout would indicate a change of wave pattern, and even a potential for a larger correction or reversal.
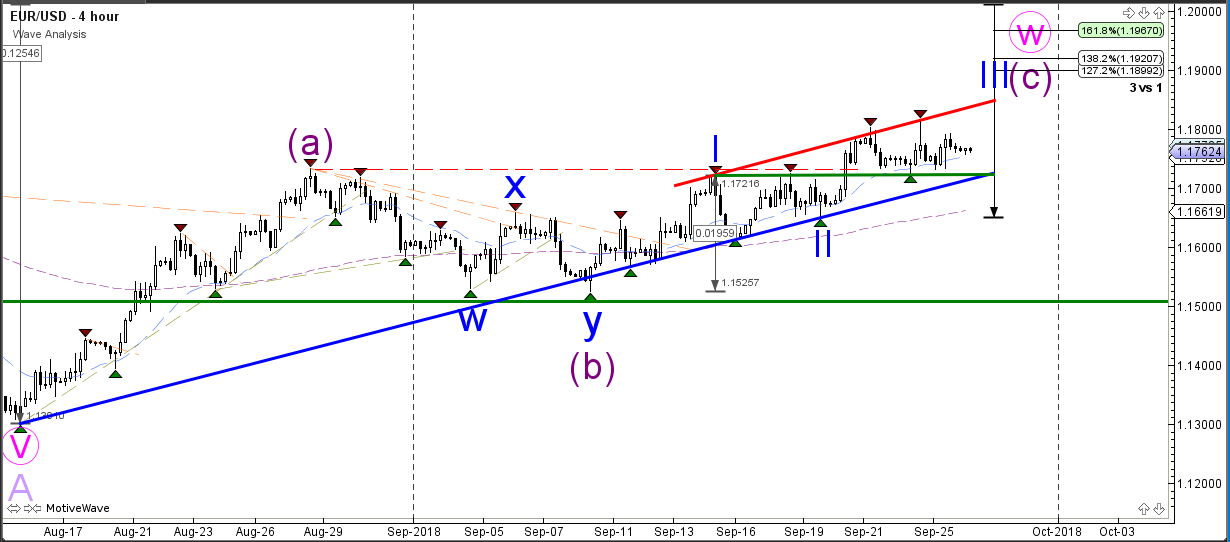
The EUR/USD currency pair finished an ABC correction (orange) yesterday in a potential wave 4 (green). A bullish breakout above the local resistance (orange) trend line could confirm the continuation higher towards the Fib targets and the resistance trend line (red), whereas a break below the support trend line (green) invalidates the wave 4 pattern.
The EUR/USD currency pair's previous weekly candle was bullish, which could indicate a potential for the price to move higher towards the Fibonacci levels of wave B (purple). The wave B (purple) could be part of a larger ABC (purple) correction in wave B (red).
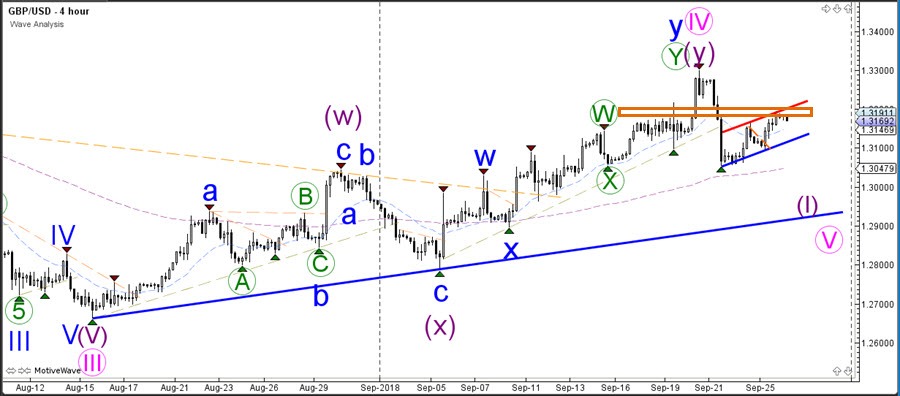
GBP/USD Creates Bear Flag After Bounce At 61.8% Fib Resistance
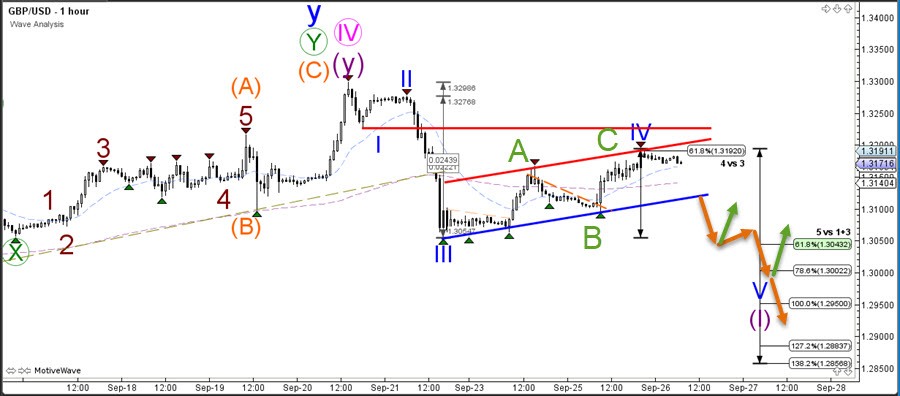
The GBP/USD is building a potential bear flag chart pattern, which could indicate more downside as long as price does not break above the flag.
The GBP/USD could be building a larger bearish reversal within a wave 1 (purple) of wave 5 (pink) if price makes a lower low by breaking below the support trend line (blue). A bullish break above the channel resistance could indicate an uptrend and invalidation of the current bearish wave 1 (purple) pattern.
The GBP/USD bounced at the 61.8% Fibonacci resistance level after completing a potential bearish ABC correction (green). The support trend line (blue) of the bear flag chart pattern is key for a bearish breakout and continuation whereas a break above the resistance lines (orange) could indicate a bullish move.
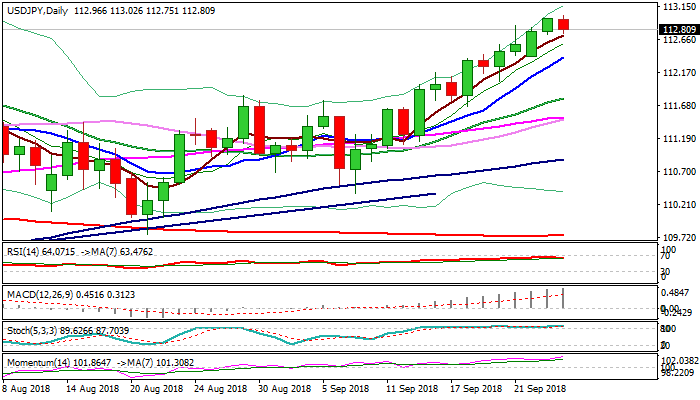
USDJPY: Bulls Consolidate After Cracking 113 Barrier, Fed In Focus
The dollar dipped to 112.75 in early European trading on Wednesday after eventually cracking psychological 113 barrier in Asia.
Overall bullish structure favors further upside and final attack at key barriers at 113.17 (19 July high) and 119.30 (Fibo 61.8% of 118.66/104.63).
All eyes are on Fed, which ends its two-day policy meeting today. Markets widely expect 0.25% rate hike and will also look for comments from the central bank for guidance on future steps, as another hike towards the year is expected.
The greenback benefited from hawkish policy outlook during past months, with further advance seen on Fed continuing at the same path.
Sustained break above 113.17/30 pivots would generate bullish signal for continuation of uptrend from 104.63 (2018 low), interrupted by 113.17/109.77 pullback, towards targets at 114.50/74 (July / Nov 2017 highs).
Dip-buying remains favored scenario for now, with initial support at 112.72 (rising 5SMA) and extended downticks to be contained by ascending 10SMA (112.40).
Res: 113.02, 113.17, 113.30, 113.75
Sup: 112.72, 112.40, 112.25, 112.04