Sample Category Title
What is the Best Forex Day Trading System?
Before moving ahead, let's understand what a Forex trading system is. It is basically a method of trading, buying or selling, which is based on observation and analysis. This helps to determine whether to sell or buy a specific currency at a given time. In other words, it is a set of rules that without which trading cannot be done in an accurate and disciplined manner.
The system of Forex trading can be based on a series of signals which are observed from a technical analysis using charting tools, or on basic news events. The latter is also referred to as fundamental trading. In most cases, trading systems are based on technical indicators.
Who needs Forex day trading systems?
Forex day trading is strictly carried out within one day and trades are always closed before the market closes on that same day. Those who trade in this way are referred to as day traders.
A Forex day trading system usually comprises of a set of technical signals which affect the decisions made by the trader about buying or selling on each of their daily sessions. The system can help traders navigate the market much more efficiently and confidently with the aim of allowing them to gain more profits.
Background of Forex day trading system
In the past, the activity of Forex day trading was only limited to financial organisations and professional speculators. The majority of day traders were the employees of banks or investment firms who specialise in equity investment and fund management. However, with the introduction of electronic trading and margin trading systems, the day trading system has now gained popularity amongst at-home traders. With easy access to Forex trading, now almost anyone can trade Forex from the comfort of their homes.
People choose to go into day trading for various reasons. However, a factor which is likely to have made this activity much more popular over recent years is the fact that day traders do not incur the Swap. This is a fee that is incurred when a position is kept open overnight.
How do Forex day traders make profit in 2018?
Day traders leverage large sums of capital to make profits by benefiting from small price changes among the highly liquid indexes, stocks or currencies. In other words, these traders are not looking for large dips and peaks in the prices. Instead they are happy with small, moderate movements, but their trade sizes are bigger than the ones of the people that invest over longer periods. As a day trader, the main aim is to generate a substantial amount of pips within a particular day. Ideally, you should generate returns on both the highs and lows of the assets.
The best Forex day trading systems
There are many different Forex day trading systems - it is important not to confuse them with trading strategies. The main difference between a system and a strategy is that a system mainly defines a style of a trading, while a strategy is more descriptive and provides more detailed information - namely entry and exit points, indicators and time-frames. A brief overview of some of the most commonly used systems is given below:
- Scalping: In this system, the selling or buying takes place instantly after the trade achieves profitability. In this trading type, the target is to attain profitability when you are up by just a few pips. You can expect to trade a lot and generate quite a large volume. However, the income per trade is rather small.
- Fading: This system involves the shorting of stocks, index or a currency pair immediately after upward moves. In this form of day trading, the price target is set when buyers start to step in again. In other words, you are aiming to make pips on the market moves that try to restore the past price of an asset.
- Daily Pivots: In this system, the profit is gained through the volatility of the daily prices of assets. The buying or selling takes place during the low period of the day and closing of the trade happens at the high period of the day. The price target here has a similar pattern as above.
- Momentum: In this type of Forex day trading system, trading is usually done on news releases, or by locating the strong moves which are trending and are supported by high volumes. The price target in this strategy is when the volume starts to diminish and the appearance of bearish candles takes place. You are generally looking into acquiring an asset a few hours before news is released and then getting rid of it after the market has moved enough into your direction.
The entries in the different Forex day trading systems make use of similar kind of tools which are utilised in normal trading - the only difference is in the timing and approach. With day trading, you generally expect to make less profit per trade, yet you expect to make far more trades.
What is the best Forex day trading system?
As you may have gathered by now, dealing with a day trading system can be quite a challenge. There is a lot to learn and prepare for that many of us simply don't have the time, experience or knowledge to do. Therefore, when you are starting out, it can be nice to know what the best trading system is going to be. While it's always nice to have a Forex trading strategy to work from, you need to have something beyond that to help you actually make the grade and start earning some money.
Because the best Forex trading system that will be suited to you will fit your own market and needs, finding the ideal one can be hard work. However, the best thing to do is remember that the majority of Forex trading systems are built around various strategies and run with their own foundations, fundamental aspects and characteristics.
The community of traders using day trading systems is loaded with so many different people and their setups, so finding the best day trading system is pretty hard – it depends on so many little factors that having a blanket answer to give you is almost impossible. However, you can feel safe in the knowledge that finding the right trading system will typically come from doing your own research. Do your research into finding the right trading system for your needs and choose the best day trading system for your budget.
Being able to dictate what the best FX day trading system is for you also comes from your own experience – what do you currently know about the actual regime? Do you need something that can help you get into the system from the very start or do you just need something that will give your existing knowledge a push in the right direction?
Whatever you pick, you need to start looking at the FX trading systems that are out there – some of them will make outrageous claims that you simply cannot trust, but it should be easy enough to start making the right choices and decisions based on how realistic they sound. Remember, the program has to sound authentic – if it's not built around actionable information and doesn't provide you with details that you can actually benefit from in the long term, move onto the next one.
Be ready to look around and find the right balance for your individual needs – what you know, what you can afford and what you are willing to invest will all dictate what the top trading systems are for you.
In other words, the best system for trading Forex is the most suitable one. When it comes to trading short term, you would need to it to be convenient and to feel confident using it, as this is an activity you would be performing for a few hours almost every day. It is suggested that you try out all of the above mentioned systems on a demo trading account first before engaging in live account trading. This is applicable even for experienced traders that are looking to switch from one system to another.
Conclusion
Determining your perfect day trading system for currencies is a hard task. It takes a lot of trial and error, yet it can pay back enormously too. Once you have determined a perfect system, then it is time to select the most appropriate strategy for it. A strategy will provide you with more detailed information on executing your day trades, while relying on the defined technical indicators and objects. What is also recommended is to try implementing a few systems and compare which one is the most interesting and comfortable for you. Don't run for profits straight away, the main idea when selecting a system is to be confident in what you are doing.
AUDUSD Outlook: Aussie Comes Under Pressure On Renewed Trade War Concerns
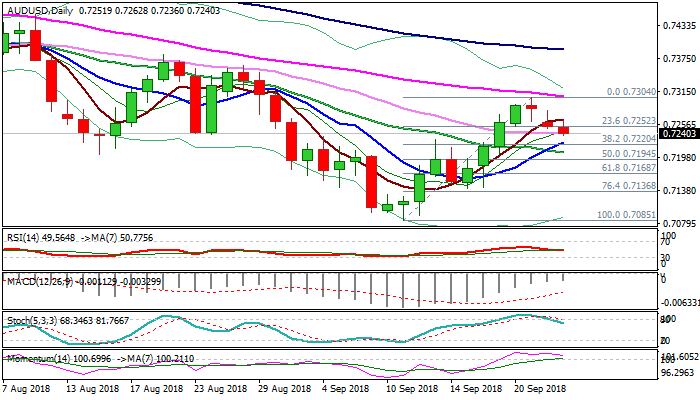
The Aussie dollar stands at the back foot on Tuesday and extends pullback from 0.7304 (21 Sep high).
Renewed US/China trade tensions and lower copper price weigh on Aussie, with fresh weakness pressuring pivotal supports at 0.7224/20 (rising 10SMA/ibo 38.2% of 0.7085/0.7304 recovery leg).
Sustained break here is needed to confirm reversal and open way for further retracement.
Weakening momentum studies and south-heading slow stochastic after reversing from overbought zone, support scenario.
Fed rate decision on Wednesday could provide more clues about pair’s near-term direction.
Res: 0.7252, 0.7265, 0.7281, 0.7305
Sup: 0.7220, 0.7205, 0.7194, 0.7168
The Analytical Overview Of The Main Currency Pairs
The EUR/USD currency pair
Technical indicators of the currency pair:
Prev Open: 1.17401
Open: 1.17479
% chg. over the last day: +0.03
Day's range: 1.17308 – 1.17621
52 wk range: 1.0571 – 1.2557
There is an ambiguous technical pattern on the EUR/USD currency pair. The trading instrument is moving in the flat. A unidirectional trend is not observed. Local levels of support and resistance are 1.17400 and 1.17700, respectively. Demand for the euro is supported by the positive comments by the ECB head Draghi. The official expects the acceleration of inflation in the coming months. The EUR/USD quotes are tending to grow. We recommend opening positions from the key levels.
The news feed on 2018.09.25:
At 17:00 (GMT+3:00) we expect the consumer confidence index in the US.
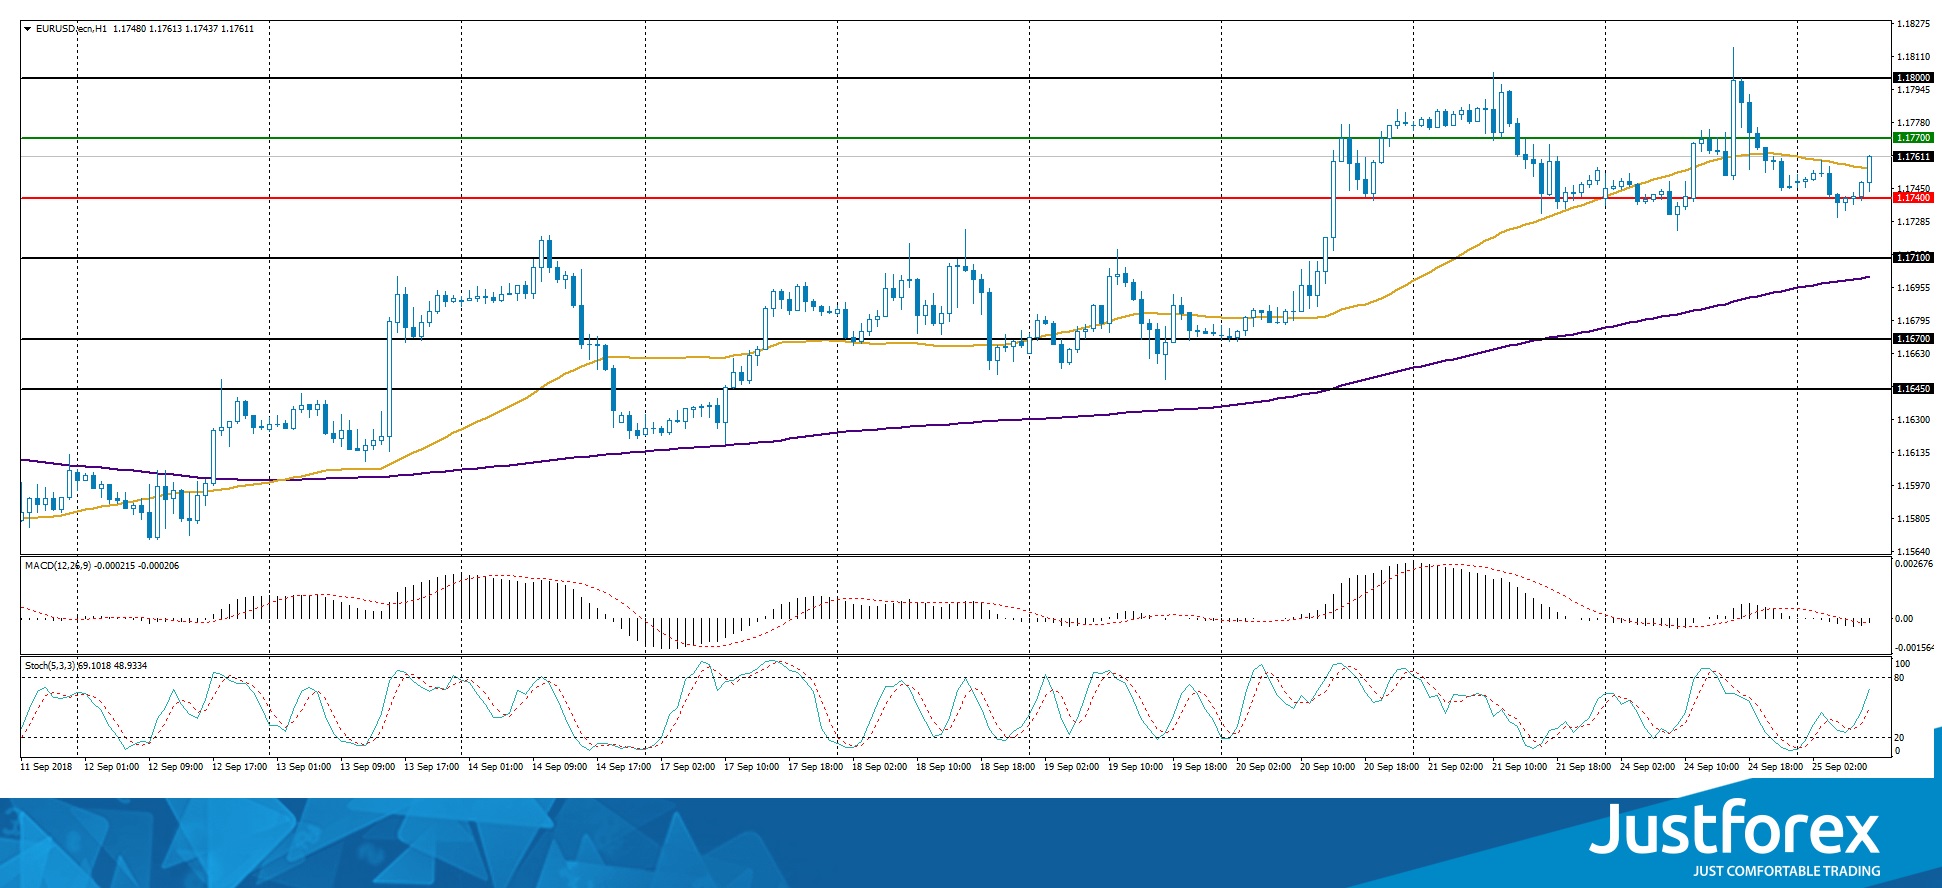
Indicators do not send accurate signals. The price has crossed 50 MA.
The MACD histogram is near the 0 mark.
Stochastic Oscillator is located in the neutral zone, the %K line is above the %D line, which signals the purchase of EUR/USD.
Trading recommendations
Support levels: 1.17400, 1.17100, 1.16700
Resistance levels: 1.17700, 1.18000
If the price fixes above the resistance level of 1.17700, further growth of the EUR/USD quotes is expected. The movement is tending to 1.18000-1.18250.
An alternative may be the reduction of the EUR/USD currency pair to 1.17100-1.17000.
The GBP/USD currency pair
Technical indicators of the currency pair:
Prev Open: 1.30749
Open: 1.31191
% chg. over the last day: +0.28
Day's range: 1.31014 – 1.31229
52 wk range: 1.2361 – 1.4345
Currently, GBP/USD is consolidating. The technical pattern is ambiguous. The key range is 1.31000-1.31350. The pound remains under pressure amid uncertainty over the Brexit. The GBP/USD quotes are tending to decline. We recommend opening positions from the key levels.
The news feed on the UK economy is calm.
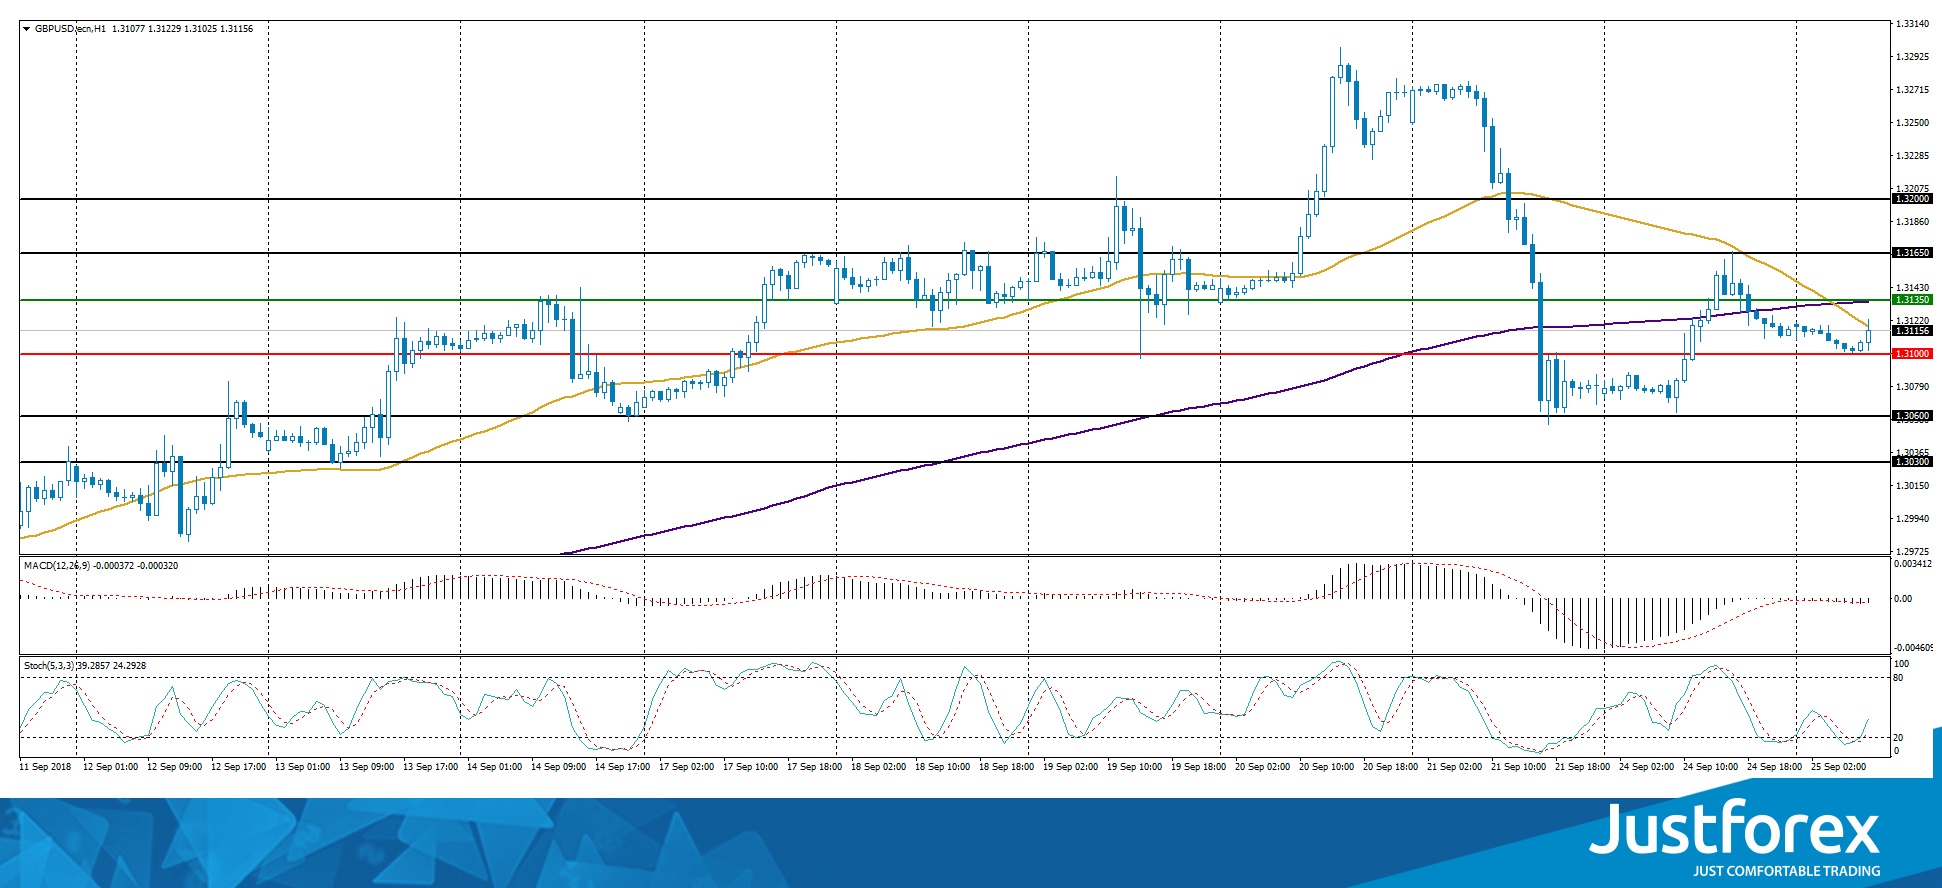
Indicators do not send accurate signals: 50 MA has crossed 200 MA.
The MACD histogram is located near the 0 mark.
Stochastic Oscillator is moving from the oversold zone, the %K line is above the %D line, which indicates the growth of GBP/USD.
Trading recommendations
Support levels: 1.31000, 1.30600, 1.30300
Resistance levels: 1.31350, 1.31650, 1.32000
If the price falls below the round of 1.31000, GBP/USD is expected to fall. The movement is tending to 1.30600-1.30300.
An alternative may be the correction of the GBP/USD currency pair to the level of 1.31650-1.32000.
The USD/CAD currency pair
Technical indicators of the currency pair:
Prev Open: 1.29243
Open: 1.29544
% chg. over the last day: +0.27
Day's range: 1.29441 – 1.29661
52 wk range: 1.2059 – 1.3795
The USD/CAD currency pair has begun to recover after a significant fall in the past two weeks. At the moment, quotes are testing the local offer zone of 1.29600-1.29800. The mark of 1.29300 is already a "mirror" support. The trading instrument is tending to grow. Positions must be opened from the key levels. We recommend you to keep track of current information regarding the NAFTA negotiations.
The news feed on Canada's economy is calm.
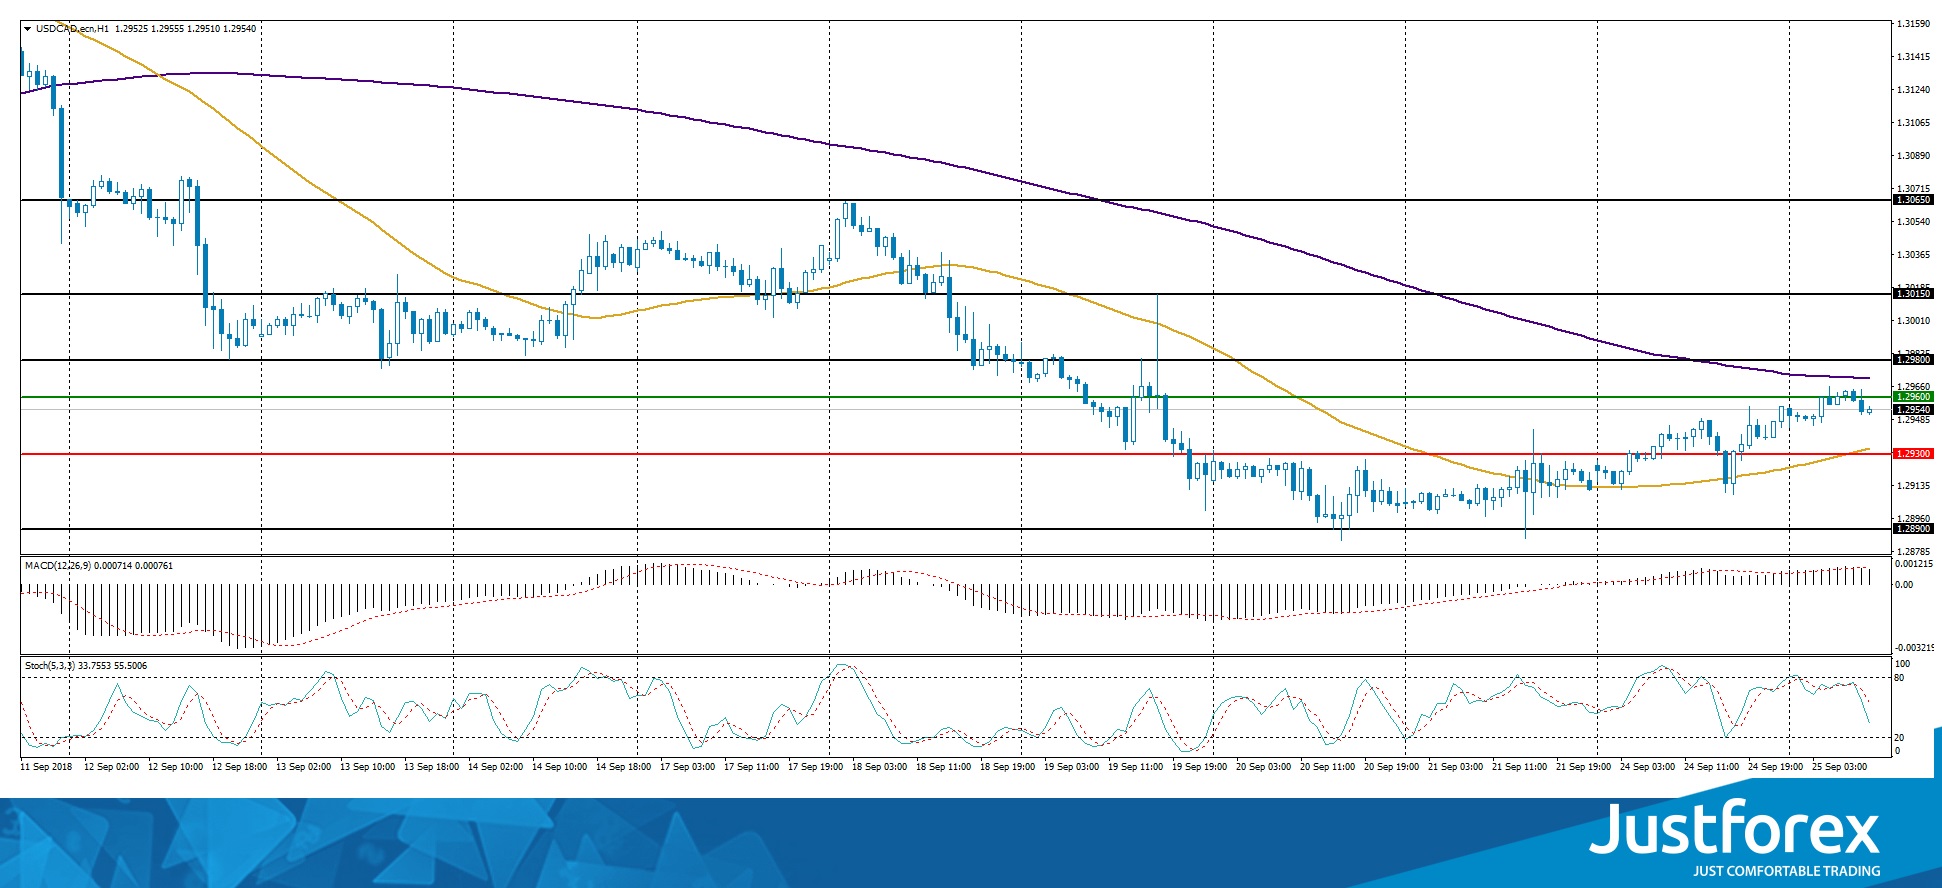
Indicators do not send accurate signals: 50 MA has crossed 200 MA.
The MACD histogram is located near the 0 mark.
Stochastic Oscillator is moving from the oversold zone, the %K line is above the %D line, which indicates the growth of GBP/USD.
Trading recommendations
Support levels: 1.31000, 1.30600, 1.30300
Resistance levels: 1.31350, 1.31650, 1.32000
If the price falls below the round of 1.31000, GBP/USD is expected to fall. The movement is tending to 1.30600-1.30300.
An alternative may be the correction of the GBP/USD currency pair to the level of 1.31650-1.32000.
The USD/CAD currency pair
Technical indicators of the currency pair:
Prev Open: 1.29243
Open: 1.29544
% chg. over the last day: +0.27
Day's range: 1.29441 – 1.29661
52 wk range: 1.2059 – 1.3795
The USD/CAD currency pair has begun to recover after a significant fall in the past two weeks. At the moment, quotes are testing the local offer zone of 1.29600-1.29800. The mark of 1.29300 is already a "mirror" support. The trading instrument is tending to grow. Positions must be opened from the key levels. We recommend you to keep track of current information regarding the NAFTA negotiations.
The news feed on Canada's economy is calm.
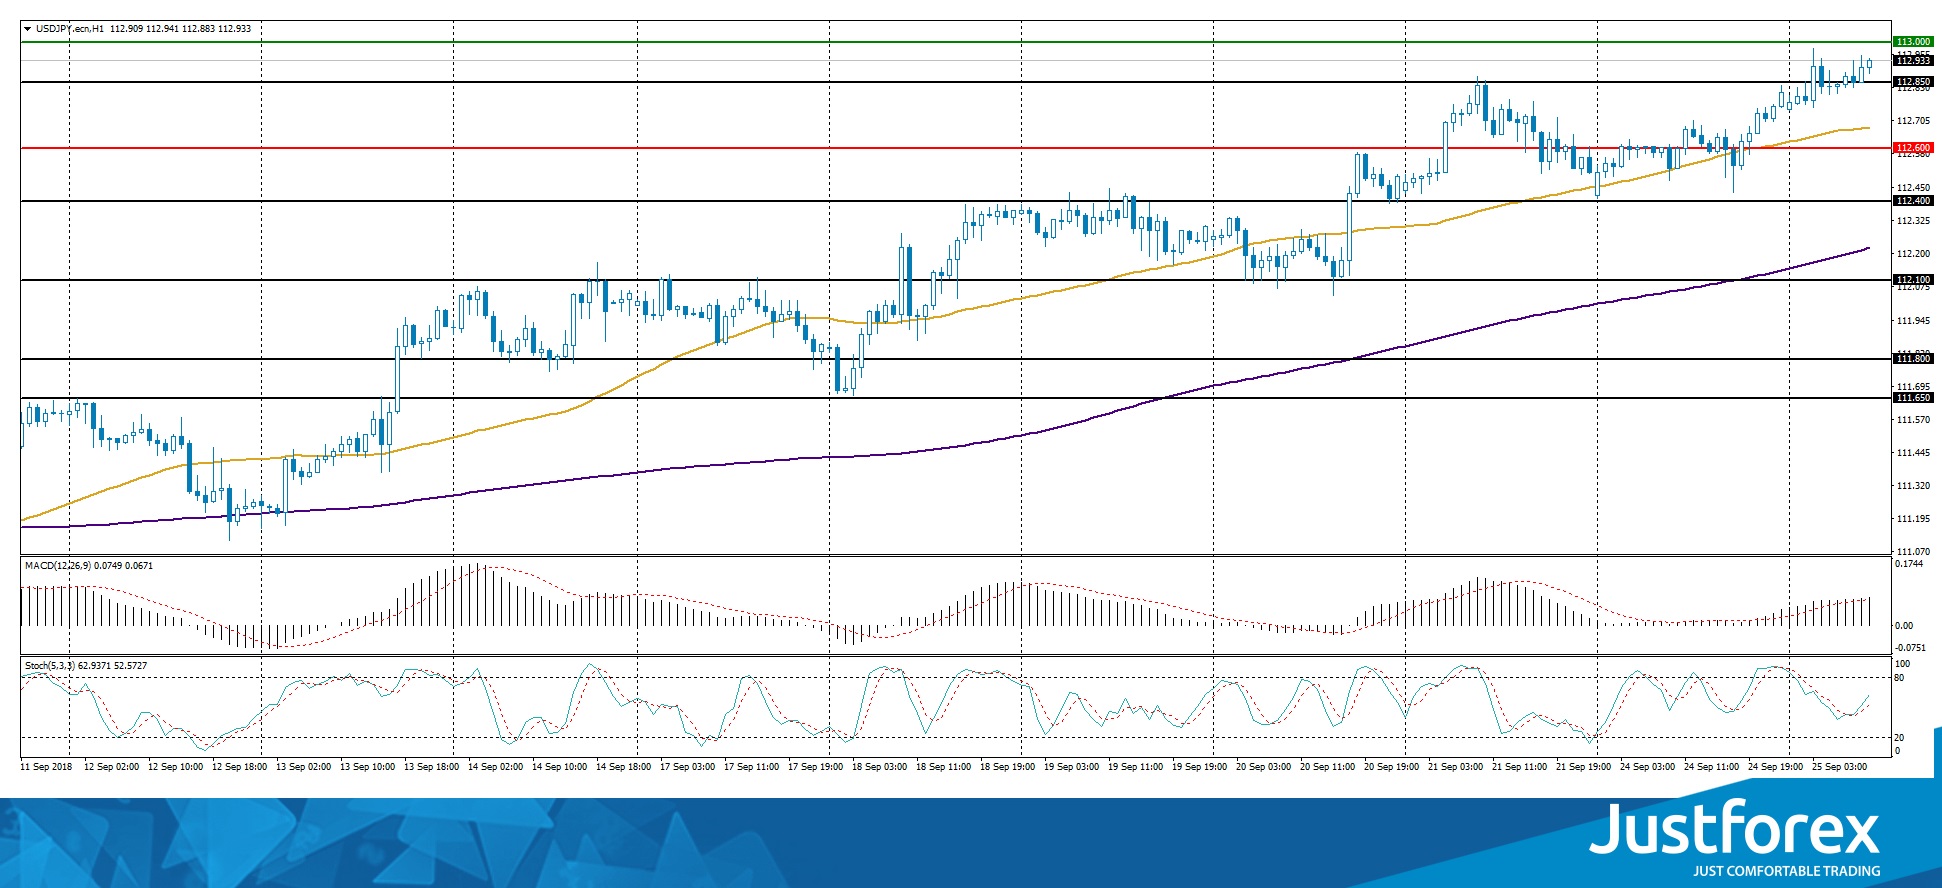
The price has fixed above 50 MA and 200 MA, which signals the power of buyers.
The MACD histogram is located in the positive zone and above the signal line, which gives a strong signal to buy USD/JPY.
Stochastic Oscillator is in the neutral zone, the %K line is above the %D line, which also indicates the growth of USD/JPY.
Trading recommendations
Support levels: 112.600, 112.400, 112.100
Resistance levels: 113.000, 113.500
If the price fixes above the round level of 113,000, further growth of USD/JPY is expected. The movement is tending to 113.400-113.600.
An alternative may be reduction of the USD/JPY currency pair to 112.600-112.400.
Technical Analysis: DAX Index Losing Its Bull Mojo
Bulls are losing the control and if the price falls below the downward trend line, the bulls could be in trouble.
The German DAX index has broken its downward trend line to the upside on a 4-hour time frame. This confirms that the downward trend (shown by orange line) is no longer in play and the bulls are back on the driving seat. However, it is important to mention that the price is trading very close to this downward trend line. If the price breaks the trend and falls below the downward trend line, this would confirm that the bears have taken over.
Hence, it is very critical that we keep a close eye on the RSI, relative strength index which is easing off from the overbought zone and now moving towards the oversold zone. For the sake of making things easier for us, we have the downward trend line (shown by pink line) and if the RSI breaks above this pink line, this would send us the signal that the bulls have started to build the momentum again. This will be the confirmation for the bullish trend.
We also have the reverse Head and Shoulder pattern forming, although it is not very clear, but it is there. The reverse head and shoulder pattern usually entails that the price would continue to move higher. But we still need more time for this and more confirmation.
Another bull signal for the price is that the 50-day moving average (shown in green) is trading above the 100-day moving average (shown in yellow). As long as this continues, we have higher odds for the DAX index to remain under the influence of bulls.
The support zone is shown by the green horizontal line and the resistance zone is shown by the red line.

ECB Praet: Price pickup a long process conditioned on very easy monetary conditions
ECB Chief Economist Peter Praet said today that "clearly we see progress in the underlying (prices), what is behind the inflation process." However he emphasized that "it's a long process and conditioned on very easy monetary conditions."
Yesterday, Euro spiked higher on ECB President Mario Draghi's comments that "domestic price pressures are strengthening and broadening". However, Praet talked it down and said there was "nothing new" in Draghi's comments.
Also, Praet added the the biggest risk to price stability is a "growth accident". That is, a sudden stop in the growth cycle. And that could come from from rising protectionism or emerging markets slowdown.
The Dollar Index Keeps The Current Levels
The US currency weakened slightly against the basket of major currencies. Yesterday it became known that China refused to negotiate with the US regarding trade tariffs. The visit by Vice-Premier of the State Council of the People's Republic of China, Liu He, which should be held this week, was canceled. The trade war between the US and China is escalating. The US dollar index (#DX) closed in the negative zone (-0.02%).
Yesterday, the ECB President, Mario Draghi, gave a speech at the European Parliament Committee on Economic and Monetary Affairs. The official assumes that the core inflation in the Eurozone would intensify in the near future due to the expected acceleration of wage growth. Draghi also noted the stable growth of the Eurozone economy and the stability of the labor market.
The British pound is still in the focus of investors’ attention. Most of the government officials of the British Prime Minister Theresa May supported the variant of a trade agreement with the European Union, similar to the existing agreement between the EU and Canada.
The "black gold" prices show positive dynamics. At the moment, futures for the WTI crude oil are testing a mark of $72.25 per barrel.
Market Indicators
Yesterday, there was a variety of trends in the US stock market: #SPY (-0.33%), #DIA (-0.64%), #QQQ (+0.10%).
At the moment, the 10-year US government bonds yield is at the level of 3.09-3.10%.
The news feed on 25.09.2018:
Consumer confidence index in the US at 17:00 (GMT+3:00).
Euro Pares Draghi-Induced Gains, Trade, Brexit And Eurozone Politics Eyed
Here are the latest developments in global markets:
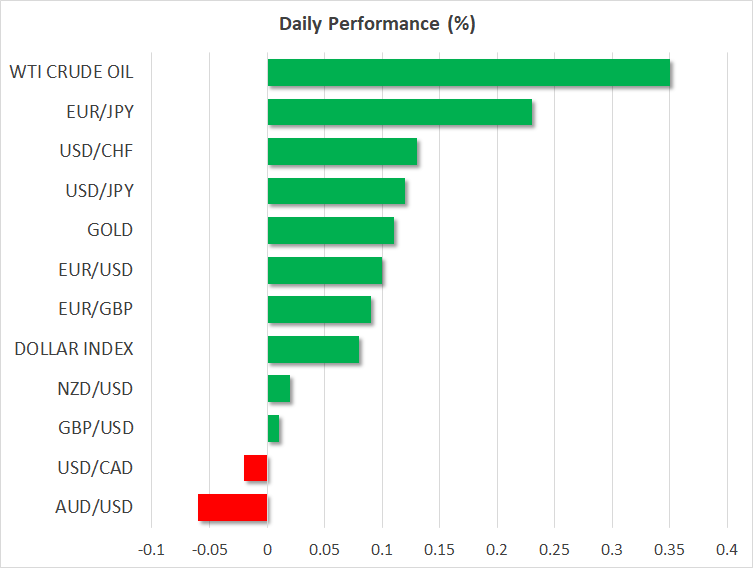
FOREX: The dollar index is higher on Tuesday, albeit by less than 0.10%, looking to extend the marginal gains it posted in the previous session. Meanwhile, the euro spiked higher after ECB chief Mario Draghi struck a more upbeat tone with regards to the bloc's economic outlook. The pound also bounced as the UK's Brexit Secretary Raab downplayed some fears. All these came largely at the expense of the yen, which was the main underperformer on Monday, and continues to trade on a soft note today.
STOCKS: It was a rocky session in Wall Street on Monday, with the Dow Jones (-0.68%) and the S&P 500 (-0.35%) closing lower as trade fears kicked in again, following China's rejection to hold talks with the US. That said, the Nasdaq Composite managed to gain slightly (+0.08%), amid a rotation back into tech stocks. Meanwhile in Asia on Tuesday, Japan's Nikkei 225 (+0.29%) and Topix (+1.02%) climbed on their first day back after a holiday, boosted by weakness in the yen. Markets in Hong Kong and South Korea remained closed. In Europe, futures tracking all the major indices were flashing green, pointing to a higher open today amid rumors that Italy's coalition government may compromise on a budget deficit of less than 2%, avoiding a clash with the EU over fiscal rules.
COMMODITIES: Oil soared on Monday and is higher on Tuesday as well, with WTI gaining 0.35% to trade at $72.31, and Brent crude rising by 0.48% today to touch $81.59, a new four-year high. The surge came as major OPEC and non-OPEC producers including Russia appeared reluctant to raise their production in a meaningful manner, to offset supply outages stemming from Iran and Venezuela, among others. In precious metals, gold is up by a marginal 0.11% on Tuesday, trading just one dollar below the round figure of $1,200 per ounce, and remaining confined inside the narrow range it established over the past month.
Major movers: Euro inches higher on “confident” Draghi; pound rebounds
The highlight during Monday's trading session were some rather optimistic remarks by ECB President Mario Draghi, which triggered a spike higher in the euro. Striking a more confident tone than usual, Draghi said the ECB sees “a relatively vigorous pick-up in underlying inflation”, adding that the continued progress in the labor market and recent signs of shortages are likely to continue pushing wages higher.
Euro/dollar immediately surged to a three-month high of 1.1815 as markets brought forward the expected timing of the first ECB rate increase, though the pair later gave back nearly all its gains to end the session nearly flat, as the dollar recovered ground. The first 10bps ECB rate hike is now fully priced in for September 2019, with investors assigning another 79% probability for another one by December 2019, according to market-implied pricing derived from EONIA swaps and Euribor futures.
Strangely enough, sterling outperformed even in the absence of any fresh Brexit news, recovering some of the sizeable losses it recorded last week. The rebound came after the UK Brexit Secretary Raab downplayed fears of a no-deal scenario, maintaining an optimistic tone overall but delivering little of real substance. Overall, most pundits still appear to view the prospect of a deal as being much more probable than a no-deal, which helps explain much of the recovery in sterling lately. That said, there's still no realistic proposal on the table for the Irish border, and with the UK now “digging its heels” and waiting for the EU to make concessions, it may well be a case of markets overestimating the likelihood of a near-term breakthrough in the talks.
Day ahead: US consumer confidence coming up; trade, Brexit, eurozone politics in focus
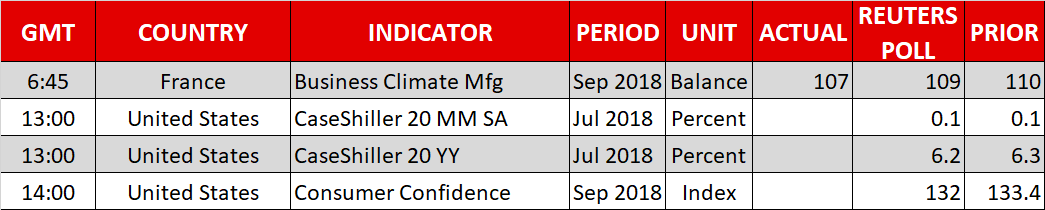
Tuesday's calendar is near empty, with the US Conference Board's consumer confidence index and some data on US house prices being on the agenda. Meanwhile, any updates on global trade, Brexit, or eurozone politics will be eyed.
On the data front, the CaseShiller indices gauging house prices in the US during July are due at 1300 GMT. Elsewhere, September's consumer confidence index will be made public at 1400 GMT. Upbeat views on the labor market by consumers pushed the index to a near 18-year high in August. The gauge is projected to ease a bit in September, though to still remain at elevated levels.
On trade, investor angst over Sino-US relations remains in the background. On Canada-US trade negotiations, reports suggest that informal talks may take place during the UN meeting in New York. Japanese PM Shinzo Abe will also be meeting US President Donald Trump in New York to discuss trade, with a summit being on the agenda tomorrow.
In eurozone politics, Italy's Five Star Movement and League ruling parties are pushing for a budget that will allow them to follow through with their campaign promises. This, though, may lead to a clash with the European Commission (as expressed above, there are rumors for a budget compromise). In Germany, it's unclear whether nerves have calmed after disagreements between the governing coalition parties that pointed to a fragile Merkel leadership.
Sterling is yet again expected to be sensitive to any Brexit news.
In terms of policymakers' appearances, ECB chief economist Peter Praet will be making public remarks at 0810 GMT, 1045 GMT, and 1330 GMT. Of note, the second of the three appearances will pertain to a discussion titled “Where next for the euro”. Other policymakers on the agenda are Bank of England MPC member Gertjan Vlieghe (0840 GMT) and ECB board member Benoit Coeure (1200 GMT).
In energy markets, weekly API data on US crude stocks are due at 2030 GMT.
Technical Analysis: AUDUSD touches 6-day low; possible shift in momentum to the upside
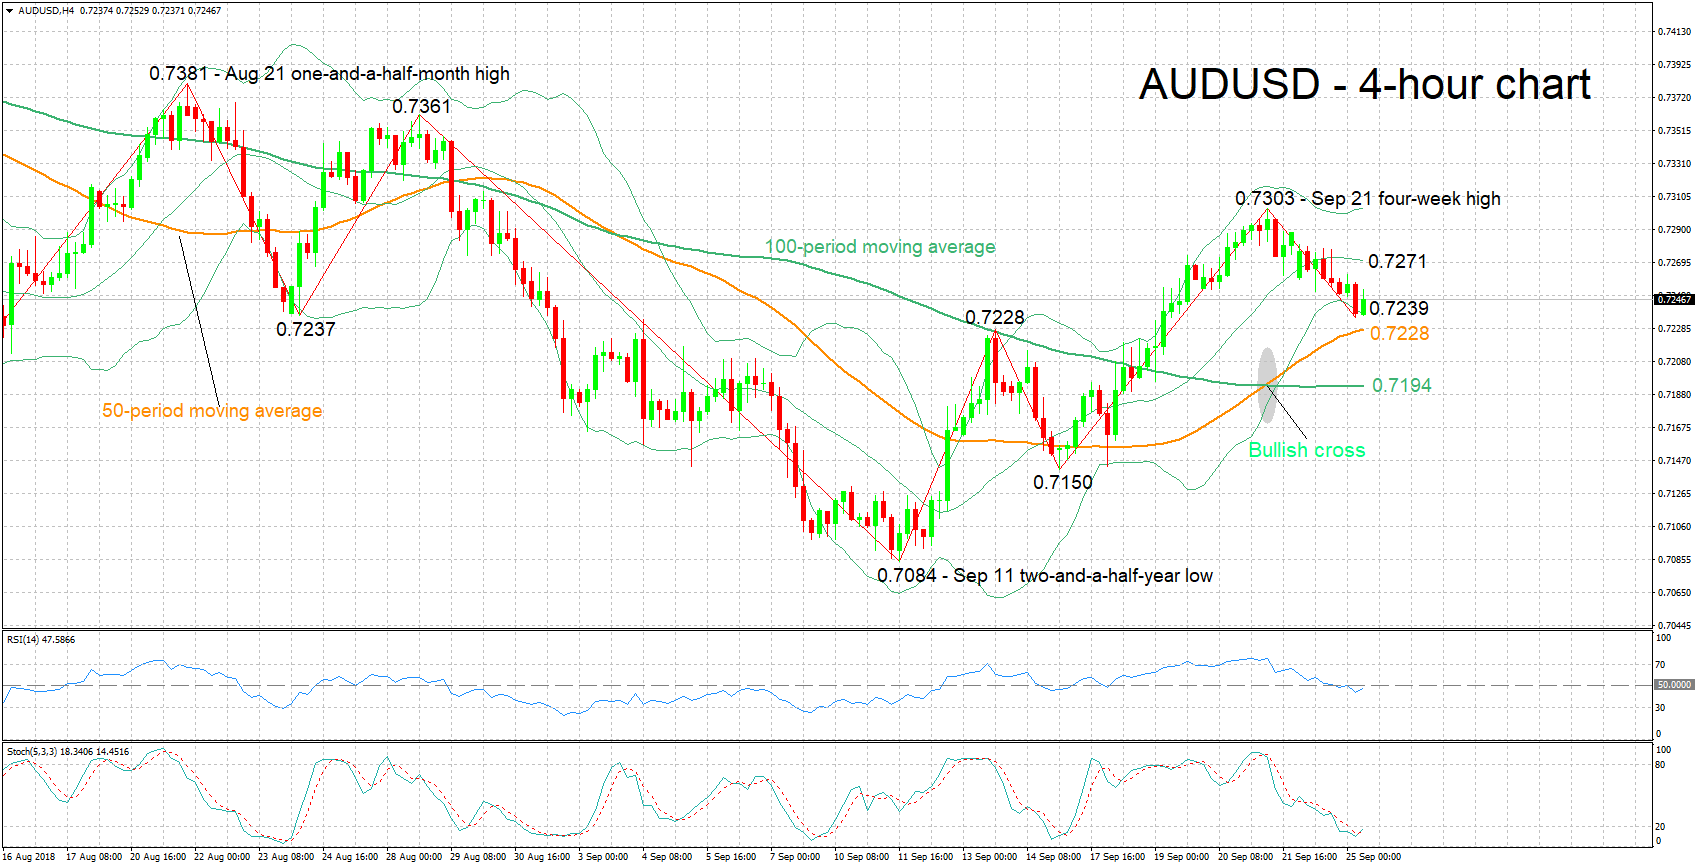
AUDUSD has lost ground after reaching a four-week high of 0.7303 on September 21. Earlier on Tuesday, it touched a six-day low of 0.7235. The RSI has been declining overall in recent days and after entering overbought levels, pointing to negative short-term momentum. However, the indicator is attempting a move higher at the moment; this may be an early indication of changing momentum. Also, the stochastics are giving a bullish signal in the very short-term, as the %K line has moved above the slow %D one.
Intensifying Sino-US trade tensions are likely to weigh on the export- and China-dependent aussie, pushing AUDUSD lower. Given a move below the lower Bollinger band at 0.7239 – the zone around this captures the current level of the 50-period moving average line at 0.7228 and the earlier low of 0.7235 – support may come around the 100-period MA at 0.7194, including the 0.72 handle. A previous low at 0.7150 would come into view in case of steeper losses, before September 11's two-and-a-half year nadir of 0.7084 is eyed next.
On the upside and in case of easing tensions, resistance may come around the middle Bollinger line – a 20-period MA line – at 0.7271. Not far above lies the four-week high of 0.7303 from September 21; the upper Bollinger band coincides with this peak, with the 0.73 round figure also being part of the area around this point. Further above, the region around the one-and-a-half-month high of 0.7381 from late August would come into focus.
GBPUSD Sellers Need To Break 1.3100 Level
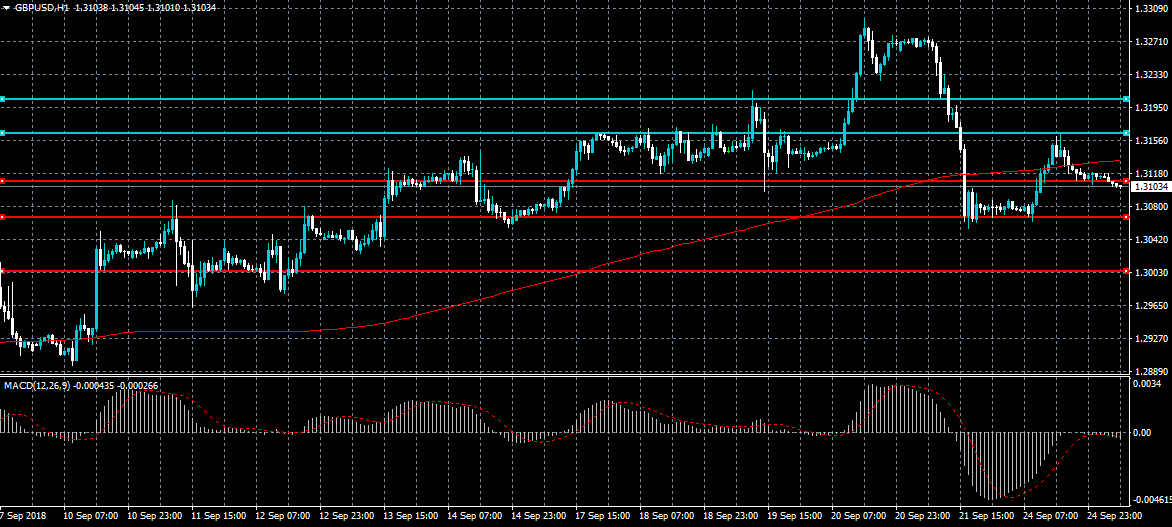
The British pound has moved back towards the 1.3100 support level against the US dollar after sterling found strong technical resistance from the 1.3160 region on Monday. The recent upside correction may be over if sellers can keep price below the pivotal 1.3113 level. With the lack of economic data today, Brexit news and moves in the U.S. Dollar Index are the key factors driving the GBPUSD pair.
The GBPUSD pair is only bearish while trading below the 1.3113 level, key support is found at the 1.3070 and 1.3030 levels.
If the GBPUSD pair holds above the 1.3113 level, buyers may force price towards the 1.3165 and 1.3200 levels.
EURUSD Continues To Struggle With The 1.1800 Handle
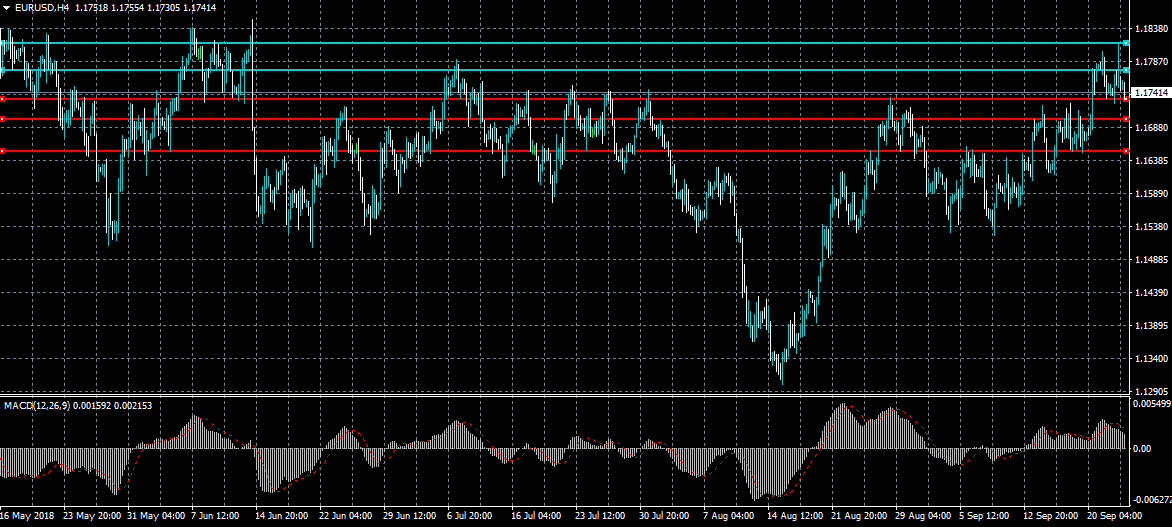
The euro is once at risk of losing its short-term bullish bias against the US dollar after the EURUSD pair was strongly rejected from the 1.1812 level on Monday. The EURUSD only retains its bullish bias while trading above the 1.1730 level, with the single currency now failing on two separate occasions to hold price above the 1.1800 resistance level.
The EURUSD pair is only intraday bullish while trading above the 1.1730 level, key resistance remains at the 1.1770 and 1.1812 levels.
If the EURUSD pair moves below the 1.1730 level, key support is then found at 1.1700 and 1.1650 levels.
Yen Falls Against Greenback After BoJ Minutes
US stocks ended the day lower after conflicting reports about Deputy Attorney General Rod Rosenstein’s future at the Department of Justice. Various reports suggested he had been fired while others suggested he had resigned following last week’s bombshell report about him secretly recording US President, Donald Trump. Investors were worried that his exit would leave the country in a constitutional crisis, which would affect the current growth. The Dow ended the day lower by 190 points.
The yen continued sliding against the US dollar after the BOJ released its minutes for the previous meeting. The minutes showed that a few officials are concerned about the dangers of the ongoing ultra-easy policies. The bank has retained negative interest rates for years in a bid to increase activity in the country. In all this, the biggest casualty has been the banks, which have been forced to offer loans at ultra-low interest rates. Others in the committee were worried that the bank could trigger a rise in long-term interest rates because of last month’s decision to allow the rates to move above 0.2%. Officials expect the inflation rate to rise slowly to the 2% target. With this talk, there is a likelihood that the BOJ will start tightening or talking about tightening in 2019.
The dollar index rose slightly during the Asian session as traders waited for the decision by the Federal Reserve. The bank will release its interest rate decision tomorrow. Many expect this to be a major event because it will send signals about a December rate hike. Previously, the probability of a rate hike in December was higher than 90%. This dropped after the previous meeting and after a series of underperforming data. Today, consumer confidence numbers from the Conference Board will be released. Traders expect the confidence to fall slightly to 132.2. In August, the confidence number was 133.4.
EUR/USD
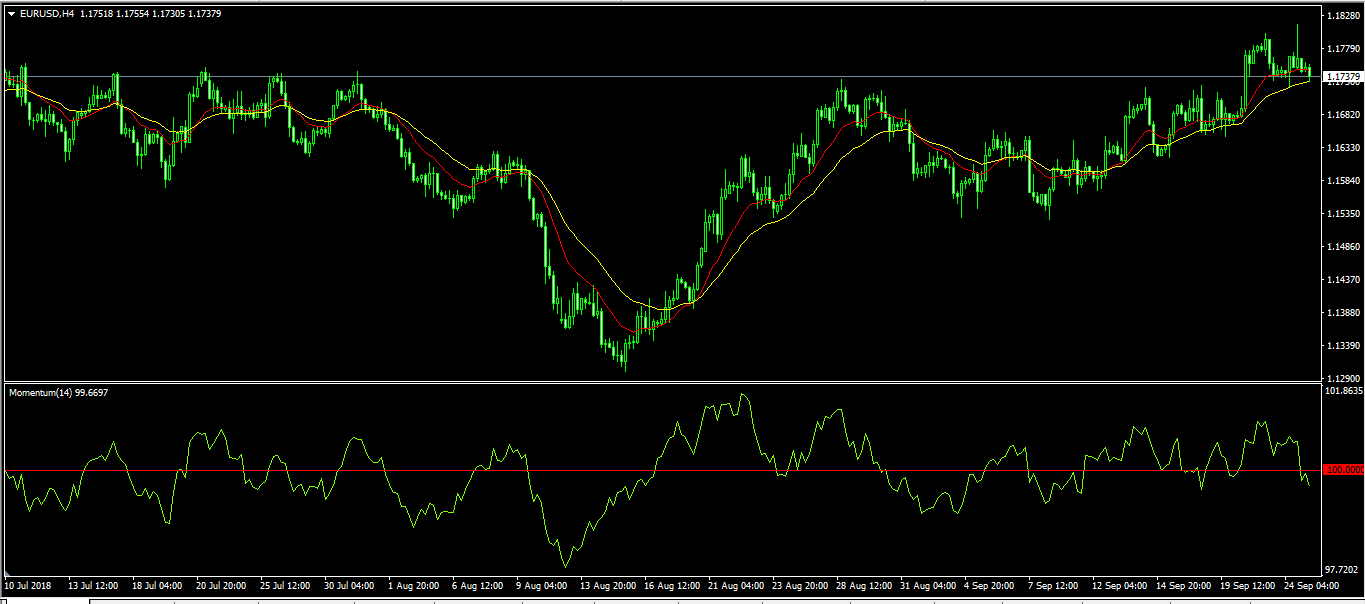
The EUR/USD pair is trading at 1.1736, which is slightly lower than the yesterday’s close of 1.1814. Nonetheless, the pair has continued the rally that started mid last month. The current price is along the 14 and 28-day EMA while the momentum indicator has crossed the 100 mark. This is an indication that the upward momentum is easing as traders wait for the Fed’s decision tomorrow. Today, it will likely trade between 1.1724 and 1.1815.
USD/JPY
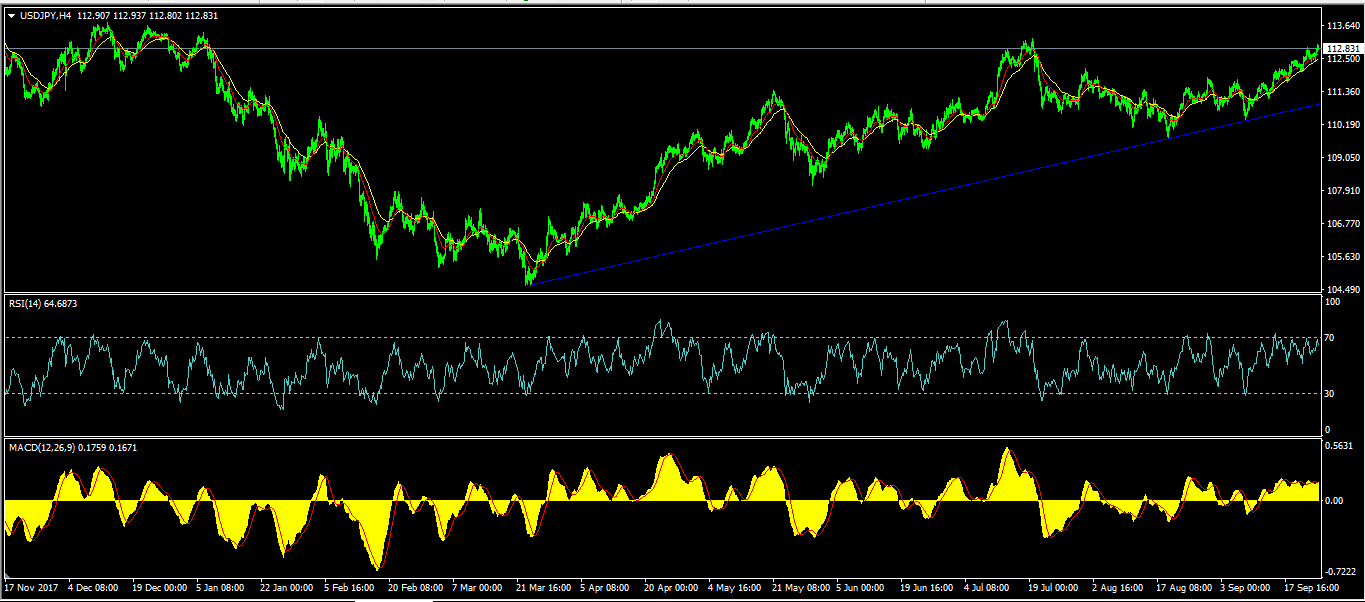
The USD/JPY pair moved higher during the Asian session after the BOJ minutes. In recent days, the pair has attempted to move above the multi-monthly high of 113.19. The current price of 112.81 is higher than yesterday’s close and above the important support shown below. The RSI has been above 65 in the past week and the price is slightly above the 28 and 14-day EMA, with the MACD moving sideways above the neutral line. This is an indication that traders will continue to wait and see what the Fed decision will be.
USD/CHF
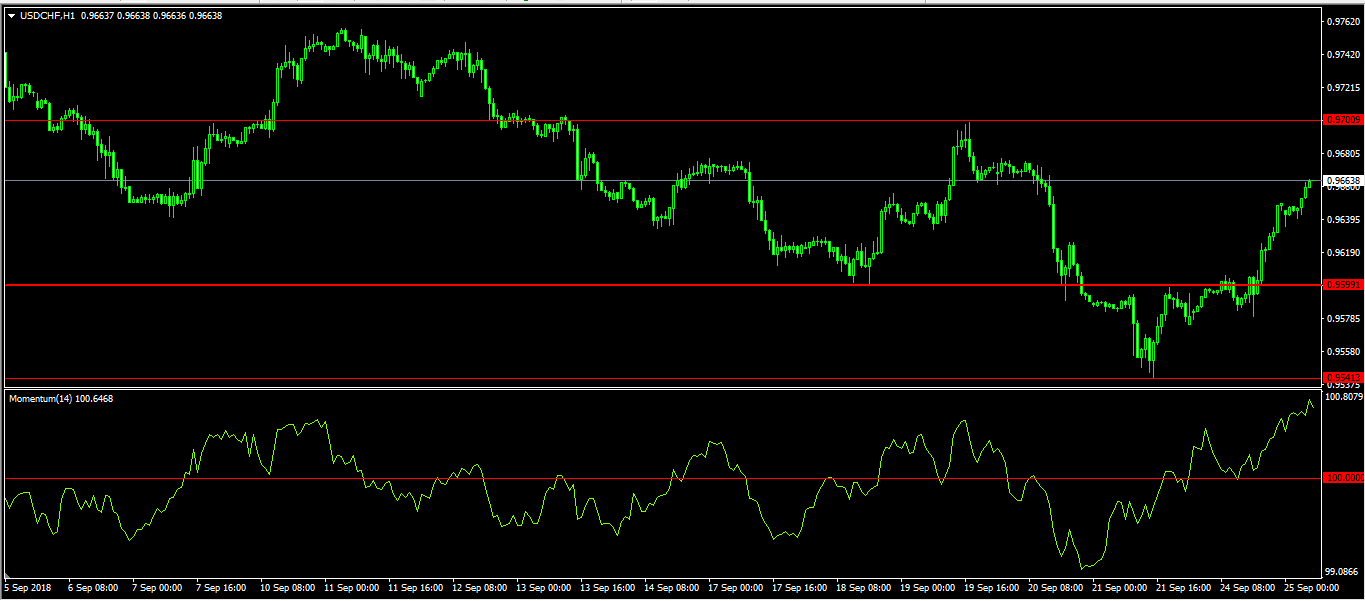
Last week, the USD/CHF pair fell to a multi-month low of 0.9540. After the decision by the Swiss National Bank, the pair started moving up and today, it reached an intraday high of 0.9664 during the Asian session. The upward movement is gaining momentum as shown by the momentum indicator below. This is an indication that the pair will likely continue the upward momentum until it tests the important resistance level of 0.9700.