Sample Category Title
Abe vs Trump, Motegi vs Lighthizer. Next week
Japan Prime Minister Shinzo Abe, just newly re-elected ruling LDP leader, has confirmed a formal summit with Trump on September 26. The meeting will be held on the sidelines of Abe's visit to New York to attend a United Nations General Assembly. Before that, Abe and Trump plan to have a dinner together on September 23.
In between, Japanese Economy Minister Toshimitsu Motegi will meet US Trade Representative Robert Lighthizer on September 24, as follow-up to their August meeting on trade. Motegi said "based on the common understanding we built in the first round of talks, we'll seek a 'win-win' outcome that benefits both countries." It's a known that the US is forcing Japan into bilateral free trade agreement but Motegi said "I don't think that will happen".
Japan PMI manufacturing rose to 52.9, international trade tensions weigh on sentiments
Japan PMI manufacturing rose to 52.9 in September, up from 52.5, but missed expectation of 53.1. Markit noted that input cost inflation accelerated at the fastest pace since March 2011. Also, geopolitical tensions weigh on sentiment, with Future Output Index dipping further.
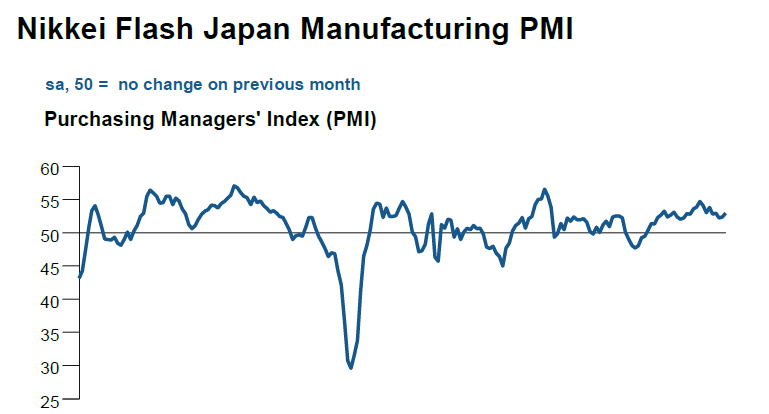
Joe Hayes, Economist at IHS Markit, said "manufacturing sector business cycle continued along its upward path". Also, "business conditions remained robust despite a number of natural disasters over the past month." "Recent demand pressures have been primarily driven by the domestic market, latest flash data pointed to the first rise in export sales since May amid ongoing global trade frictions." However, "business sentiment dipped further in September to a 22-month low as firms remain uncertain to how international trade tensions could impact the Japanese economy".
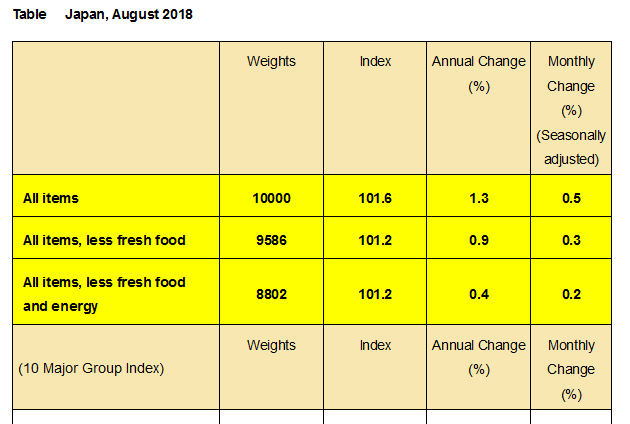
Japan core CPI ticked up to 0.9% yoy, core-core sluggish at 0.4% yoy
Japan all item CPI rose 0.5% mom 1.3% yoy in August. Core CPI (ex-fresh food) rose 0.3% mom, 0.9% yoy. Core-core CPI (ex-fresh food and energy) rose 0.2% mom, 0.4% yoy. While core CPI ticked up from 0.8% yoy in July, it's still way off BoJ's target of 2%. More importantly, the core-core continued to show sluggishness in underlying inflation.
Market Morning Briefing: Dollar Yen Is Breaking Resistance On Weekly Candles Near 112.5
STOCKS
Although the stock indices have risen sharply in the last few sessions, there are important resistances that need to be breached to establish a firm ground for further rally. We would be cautious at current levels, in spite of the stocks looking bullish in the longer run.
Dow (26656.98, +0.95%) has moved up sharply, breaking above 26500. It is likely that the index could continue its upward rally towards 27000. Also note interim resistance just above current levels on the daily chart.
Dax (12326.48, +0.88%) also moved up sharply and is just below the daily candle resistance near 12400. If the resistance holds, we could see a short dip back towards 12000. But while the other major equity indices look bullish, Dax could also possibly move up in the near term breaking above 12400. Weekly candle chart indicates bullishness towards 12500-12700 in the longer run.
Nikkei (23821.62, +0.62%) is likely to test previous high of 12130 and could see a short dip before resuming its uptrend towards 12130+ levels in the longer run. Near term could see some rejection at current levels.
Shanghai (2726.77, -0.091%) is stable just below 2750 and a failure to sustain a rise would make it vulnerable to a re-test of 2700 or lower in the medium term. Else a rise towards 2800-2850 is on the cards.
Nifty (11234.35, -0.39%) has decent supports at 11200 and 11100 respectively which could hold over today and early next week. A bounce in the coming week is preferred with a rise back towards 11400 and higher.
COMMODITIES
News states Trump to have called on OPEC to keep oil prices low. OPEC’s meeting in Algiers is due over the weekend to discuss future production policy which could keep crude prices stable today.
Brent (78.71) is trading a bit lower today. Trade in the 78-80 region is possible just now before a sharp move next week. It is important to see if Brent comes off from crucial resistance at 80 or manages to break above it. This would be a trigger for the medium term movement in the Brent prices.
WTI (70.21) would have to break above 72, to ensure a medium term upmove. Else a fall from 72 could take it down towards 68-67 levels again. While there is scope for rise in the crude prices in the longer run, there is a possibility of near term dips while resistances near 80 and 72 holds on Brent and WTI respectively.
Gold (1212.70) has immediate resistance on the upside near 1220. While this holds, we cannot be bullish on Gold just now. A sustained break above 1220 is required to take it higher towards 1240/50 levels in the near term. This could possibly take some time. While below 1220, the ongoing sideways consolidation is likely to continue in the 1220-1190 region.
Copper (2.7605) has moved up slightly. While above support at 2.70, Copper looks bullish for the near to medium term targeting 2.85. However, in the longer term, the price will have to break above 2.85 to ensure further rise.
FOREX
Dollar looks bearish against the Euro, Pound and Aussie in the near term. Rupee might also derive strength from the global Dollar weakness – if that happens, 72.81 and 72.98 might have been a double top.
Dollar Index (93.905): The break of the 21 weeks MA near 94.48 on weekly line chart makes the Dollar Index look bearish in the weeks ahead. There could be some support near 93.20 in the next week. However, a break below 93.2 could make it bearish towards support near 92.0-91.5 on 3 day line chart. Watch out for the FOMC on 26th Sep – a hawkish view could put a pause to Dollar weakness.
Euro (1.1778): Exactly as expected in our Morning Briefing on 19th Sep, Euro broke above crucial resistance near 1.17 yesterday and could now face some interim resistance between 1.180-1.185. In the next 3-4 weeks, Euro looks bullish towards trendline resistance near 1.200-1.205 on weekly candles.
Dollar Yen (112.64) is breaking resistance on weekly candles near 112.5. It could rise further towards its July ’18 high of 113.18 in the coming week – there could be some resistance in the 113.18-113.75 zone after that. Check out our Sep '18 monthly forecast report on Japanese Yen which discusses the next long term move in the narrowing contraction since 2016 : https://kshitij.com/usdjpy-forecast-payment-details-sep18
Euro Yen (132.67): On Wednesday we had said that Euro Yen could rise to 132 in the near term and a break above 132 would be very bullish. The break of 132 has indeed happened and the next target on the upside for Euro Yen now seems to be 135 (as seen on weekly line chart). A rise to 1.19 on the Euro and towards 113.2 on Dollar Yen could well take Euro Yen towards 1.15.
Pound (1.3265) has breached the 21 weeks MA near 1.3164 and now looks bullish towards 1.34 in the next 1-2 weeks.
Aussie (0.7288) is at resistance near 0.73 on daily and 3 day candles. A break above 0.73 will open up higher resistance near 0.7375-0.7400 (resistance trendline on daily line chart and the 21 weeks MA near 0.7398). It is likely to stay below 0.74 in the next 1-2 weeks.
Dollar Rupee (Closing Spot on 19th Sep: 72.375; Current Offshore NDF: 72.01)
Global Dollar weakness seems to have strengthened the Rupee in the offshore NDF markets. Crucial to see if it opens gap down below support at 72.20 today. The 2 tests of 72.81 and 72.98 point to the possibility that USDINR might have made a double top.
INTEREST RATES
US 10 Year yield (3.07%) almost tested 3.10% yesterday and came off from there. Important upside levels to watch out for are: 3.10%, 3.125% and 3.16%. Our preference is for the yield to not breach 3.16% (800 weeks MA). However, if it does so, then it could be very bullish for yields.
The 10 Year German-US spread (-2.59%) is close to support near -2.6%. Either it could bounce from here or else, if the support breaks, then it could target lower support on long term chart near -2.70% to -2.80%.
Meanwhile, the German 10 year yield (0.47%) looks like it could rise towards 0.6% if it crosses above 0.5%. On the long term chart, there is room for a rise till 0.75% for the German 10 year yield.
Combining the views from the long term chart of the German-US 10 year spread and the German 10 year yield, a rise to -2.75% and to 0.75% on them respectively is possible – which thereby suggests that we should not rule out a possibility of a rise in the US 10 year yield towards 3.50% in the next 2-3 months.
However, as mentioned above, the current preference in for 3.16% to hold.
Meanwhile, keep a watch on the FOMC on 26th Sep – a rate hike is almost certain.
GBPJPY – Bullish, Set To Close In On The 150.00 Area
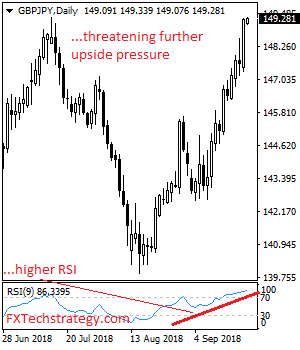
GBPJPY - The cross rallied strongly on Thursday opening the door for more price gain in the days ahead. On the downside, support comes in at the 149.00 level where a violation will aim at the 148.50 level. A break below here will target the 148.00 level followed by the 147.50 level. Conversely, resistance is seen at the 149.50 level followed by the 150.00 level. A cut through that level will set the stage for a move further higher towards the 150.50 level. Further out, resistance resides at the 151.50 level. Its daily RSI is pointing higher suggesting further upside pressure. All in all, GBPJPY faces further upside pressure.
US-China Trade War, Yesterday’s News?
US-China trade war, yesterday's news?
The US stock markets catapulted to a new record high on Thursday as investors continued to sidestep fears over the escalating global trade war and instead focused on a boomy American economy. And at least for today anyway, US-China trade war was yesterday's news.
Make no mistake the US economy is running on all cylinders, robust growth, soaring employment and rising capital investments. Suggesting the healthy US economy is more than just a short-term knock-on effect from the intravenous elixir of easy credit and fiscal glucose. The US economy is thriving.
Oil Markets
And when you thought the ducks were aligning for a significant push higher in oil prices, enter President Donald with yet another timely twitter castigation of OPEC. Which comes just days before OPEC, Russia and non-OPEC partners meet in Algiers this weekend to review the state of the oil market, with a focus on the likely supply impacts of US-led Iran sanctions. Another case of President Trump having his cake and trying to eat it also, as its those US imposed sanctions on Iran and Venezuela that are causing the spike in oil!!
The market had until that point been trading fluidly with the assumption that Saudi Arabia is now comfortable with Brent at $80 or even higher, which is challenging the markets long-held supposition that prompt Brent between $70 and $80 was OPEC sweet spot.
But with significant support levels holding firm and sentiment is securely buttressed by Iran sanction, politically inspired dips in a bullish market will undoubtedly be bought. The problem, however, is we're heading into a weekend where what was initially thought to be a meeting of OPEC steering committee to discuss Oil markets current affairs, has morphed into an unofficial OPEC meeting with 20 + nations at the table, which means traders were going to profit take and reduce risk anyway. I guess President Trump brought forward that decision for traders 20 hours earlier than expected and perhaps the follow through a little thicker than anticipated.
So why the 1.5 % sell-off?
And while Saudi Arabia is revelling in these Iran sanctions, they are also worried that any sanctions-related, oil prices spike will trigger fresh criticism from Trump, especially ahead of the November election where the blame for high energy prices will squarely fall on the Trump administration ramping up geopolitical risk, for the sake of a hawkish international policy mandate.
Indeed, Saudi Arabia does fear the' wrath of Trump' and are taking few chances with the longshot NOPEC bill lingering, but the real question is, even if they wanted to ramp up production, could they??
Gold Markets.
The precious complex is quiet while modestly reacting to the weaker dollar but surging US Bond yields are holding back speculators and not to mention there's nary a hedger insight with US equity markets rising above all-time high-water marks.
Currency Markets
So where are the dollar bulls ?? more comfortable to short bonds in this market than to go long dollars, so look over at the bond desk!!
Indeed, a tangled web of confusion as USD remains doughy and while US yields didn't lead overnight, they did hold stable support levels. Of course, the first discussion across our global trading desks was will the USD weakness linger. And the conclusion was a resounding maybe!! While the dollar was widely expected to wobble into the US midterm elections, I think that playbook trade has been brought forward by many factors that we will look at below. But ultimately USD should remain constructive post-midterms for no other reason than as the US economy is doing better than anyone else's and the Feds will continue to raise interest rates.
The dollar leak
So modern-day forex desks are staffed by a compliment of the brightest kids, grizzled veterans and machine learning algorithms using 3000 data points, and still, no one can predict the course of the USD beyond 24 hours, well 8 hours to be exact in this market. So, forget trying to play long ball (6-month conjectures) and let's look at some granularity that got us to the point this week where DXY/USGG10YR correlation has temporarily snapped.
EM markets have been catching the tailwind from CBT rate hike, CBR surprise rate hike, BI potential mandatory FX conversion for exporters and the RBI currency countermeasures. All of which contributed to taming the beast (USD) to various degrees. But a significant factor in adding to the current run of dollar weakness is the drop on safe-haven appeal after China suggested they won't weaponise yuan in a trade war.
Yesterday the RBI stepped up their game as USDINR NDF fell abruptly this afternoon on wire reports suggesting RBI is studying the efficacy of taking oil companies USD demand away from the market. The state-run oil companies were now sourcing their entire dollar demand in markets, and the RBI is now considering opening a swap window to alleviate the pressure, something they have baulked at in the past.
Indeed, desperate times lead to drastic measures.
The Yuan rallied further on news that Mainland authorities are reportedly cutting import tax from most of its trading partners as soon as next month. Of course, the breadth and the actual tax % will be the key. Current estimates are the tax cut will be applied to around 1,500 consumer products. This move triggered more unwinding of trade war hedges as China will get creative to counter the adverse economic effects of US tariffs.
Trump constant attempt to undermine the Feds is also a distraction, as the markets knowing full well the Administration is lobbying for lower interest rates and a weaker USD in this trade war environment. None the less USD has put itself in the centre of discussion regarding what Fed Chair Powell is up to with Congress. Markets are chatty about this article Bloomberg
And while the Forex markets have become a point for of frustration for some, overnights the price movements appear to be more related to USD haven hedge unwinds as opposed to any long-term structural adjustments on the USD as the markets remain within well-worn ranges.
G-10
The Euro
The EUR was toying with the market all week, and finally, the dollar bears got the bravado to take on the 1.1730 level which predictably triggered a cascading effect to 1.1780. So, with the USD bulls sidelined, short-term speculators seized the moment with the Euro Stoxx reaching a fresh all-time high and Bund yields moving higher pressed the 1.1730-50 zone and made a quick profit on the day.
The Japanese Yen
USDJPY is being carried higher by a higher NKY and higher USD rates
Asia FX
Regional Risk is very steady supported by thriving global equity markets a slightly weaker USD and a positive glean that North Korea's leader Kim Jung-un has asked for a second summit with President Trump and has reportedly agreed to ‘verifiable' dismantling of a missile testing site during the North/south summit.
Eco Data 9/21/18
[php_everywhere instance="1"]
GBP/JPY Clears Key Hurdles
Thanks to positive risk sentiment, consistent improvement in UK data and growing optimism over a Brexit deal, the GBP/JPY has risen about 900 pips from its low of just under 140 in mid-August.
As a result of the rally, several horizontal levels of resistance have broken down, including 145.50, 147.15 and today 148.50, while a couple of bearish trend lines and key moving averages have also been cleared.
Therefore, the path of least resistance remains to the upside and we consequently expect short-term dips to be supported until a distinct reversal pattern unfolds or price reverses due to some fundamental stimulus.
It is imperative that the bulls now defend the first level of support at 148.50 in order to maintain control over the short term trend. If this level were to break on a daily closing basis then we could see a deep retracement and potentially a reversal even.
In any case, the short-term bias would remain bullish for as long as rates remain above 147.40 – roughly today’s low. If this level were to give way then a drop back to 145.50 could be the outcome.
On the upside, resistance is between 149.00 and 149.30, an area which was being tested at the time of writing.
Should rates break above this area as well then the rally could strength significantly further over time, although in this case the next immediate bullish objective would be the 61.8% Fibonacci retracement level at 150.20 next.

Mid-US update: US stocks make record high, Dollar at critical juncture after steep selloff
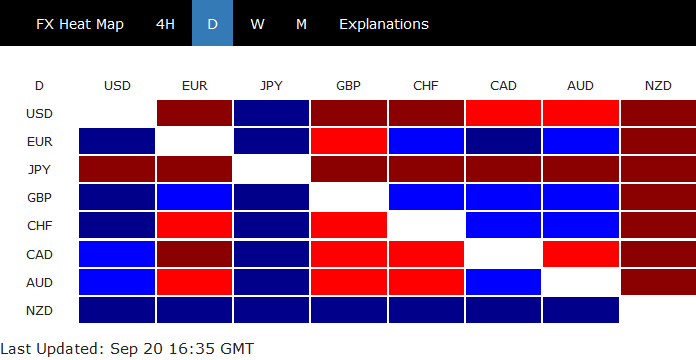
Dollar suffers steep selling today but it's trying to regain some ground at mid-US session. Currently it's trading as the second weakest currency, together with Canadian Dollar. Yen is the worst performing one as fresh selling is seen in US session even against Dollar. On the other hand, New Zealand Dollar was boosted by strongest quarterly GDP growth in two years and is the strongest one. Sterling was lifted by strong retail sales data even though there is no breakthrough in Brexit negotiation in the informal EU summit. Euro follows as the third strongest as German 10 year bund yield once breached 0.50%. But it's now back at 0.47, thus limiting the strength of Euro.
In other markets, DOW and S&P 500 make record highs today while NASDAQ lags behind. US treasury yield is having a notable pull back after this week's strong rally. It remains to be seen if 10 year yield could eventually breaks 3.115 key resistance. Major European indices ended in black with FTSE up 0.49%, DAX up 0.88% and CAC even stronger and up 1.07%. Gold is back above 1200 but struggles to ride on Dollar selloff to push through 1214.30 resistance.
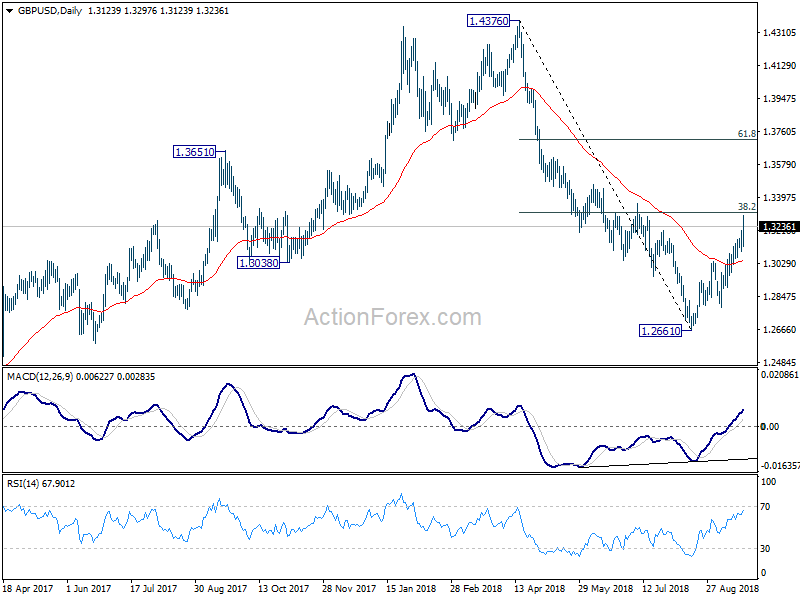
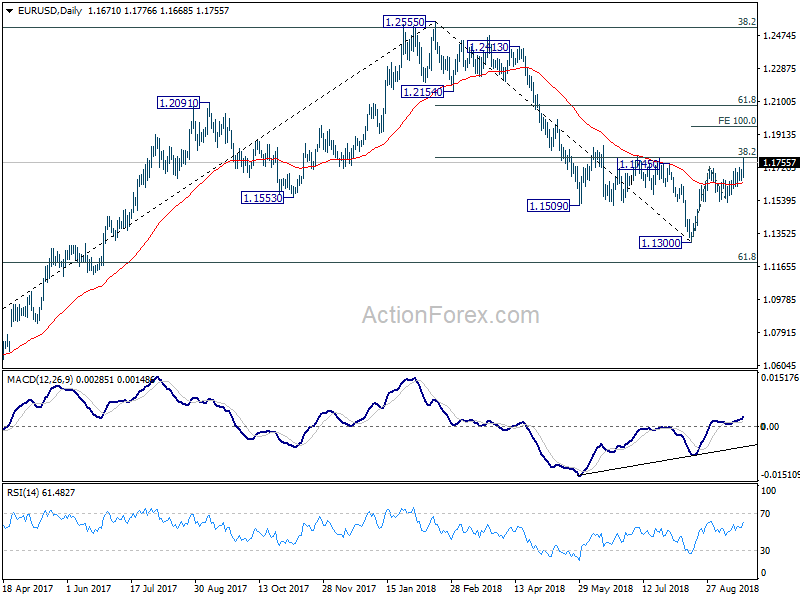
An important point to note is that Dollar is now at a rather critical juncture. EUR/USD is pressing 38.2% retracement of 1.2555 to 1.1300 at 1.1779. GBP/USD is also in proximity to 38.2% retracement of 1.4376 to 1.2661 at 1.3316. We've pointed out before that 1.1300 in EUR/USD and 1.2661 in GBP/USD are both medium term bottoms, considering bullish convergence condition in daily MACD. Subsequent rebounds are viewed as corrective in nature.
Ideally, we should see strong resistance from 1.1779 and 1.3316 fibonacci level to limit upside, at least on first attempts. This will firmly keep medium term outlook bearish. And then based on the structure of the subsequent fall, we could be able to the possible depth of the next down moves. However, firm break of these two fibonacci levels would open up the cases of trend reversals. Even though the chance of bullish reversal in the pair is still slim in that case, technical forecasts would become more difficult.
DOW hit record high, extends decade long up trend
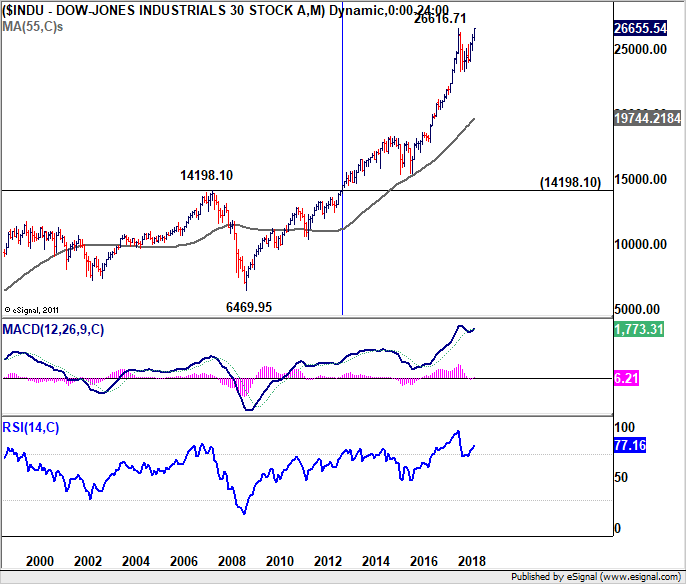
DOW surges sharply in early US session and finally catches up with S&P 500 in making new record highs. S&P 500 is also strong, gapping up and hit record high too. NASDAQ on the other hand, lags behind even though it's also trading in black.
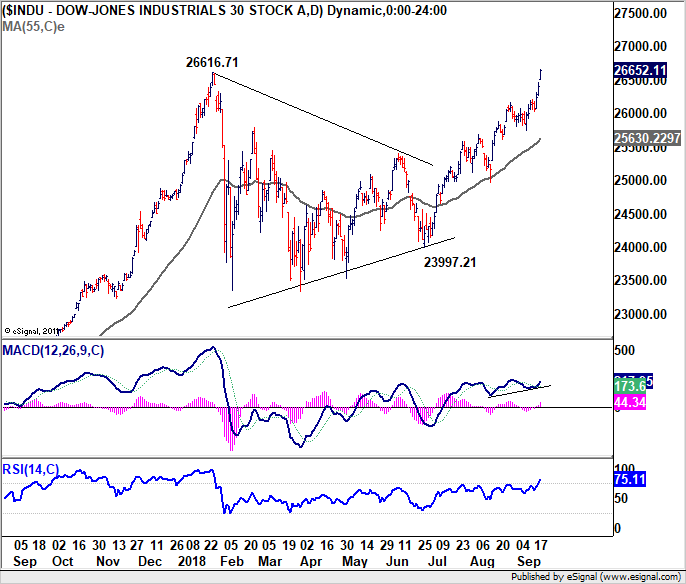
DOW's break of 26616.71 indicates resumption of the long term up trend. Such up trend didn't start last year, but way back at 6469.95 in 2009. The record run has indeed started in early 2013 when the US economy has finally come out of thew worst global financial crisis since the WWII, with all the hard work by the government back then and Fed.
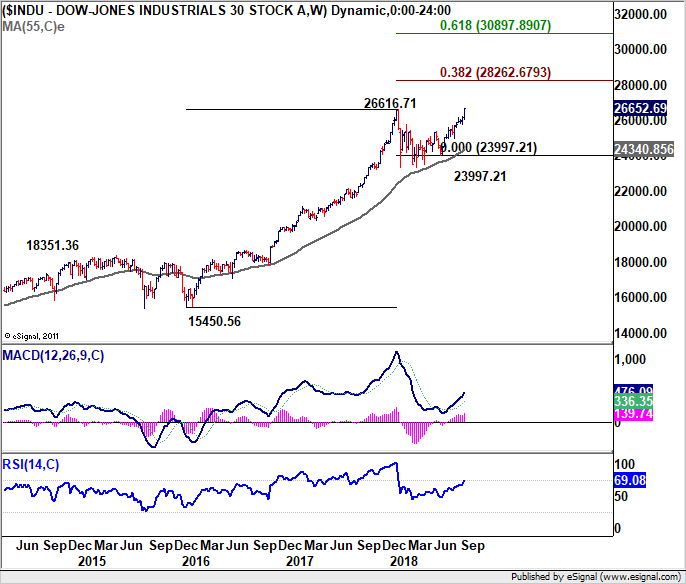
Anyway, technically, the next medium term target for DOW is 38.2% projection of 15450.56 to 26616.71 from 23997.21 at 28262.67. It's too early to tell if DOW could get through this level given that it's so late in the cycle. We'll see.