Sample Category Title
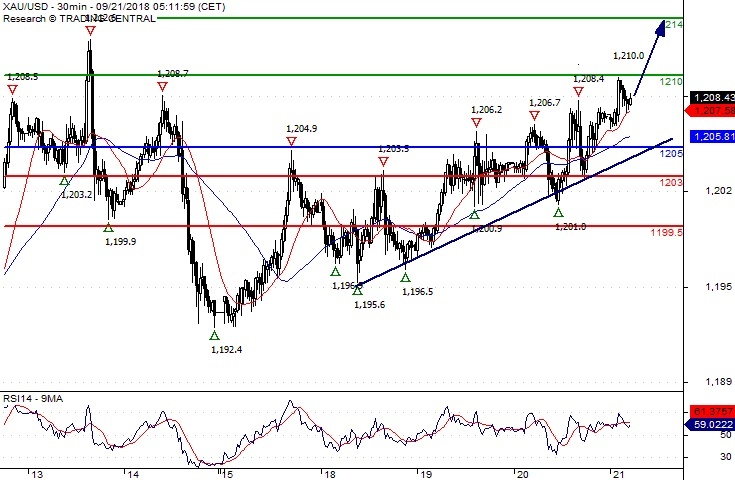
Gold Spot The Upside Prevails
Pivot (invalidation): 1205.00
Our preference Long positions above 1205.00 with targets at 1210.00 & 1214.00 in extension.
Alternative scenario Below 1205.00 look for further downside with 1203.00 & 1199.50 as targets.
Comment The RSI shows upside momentum.
Forex Technical Analysis: EUR/USD, USD/JPY, GBP/USD
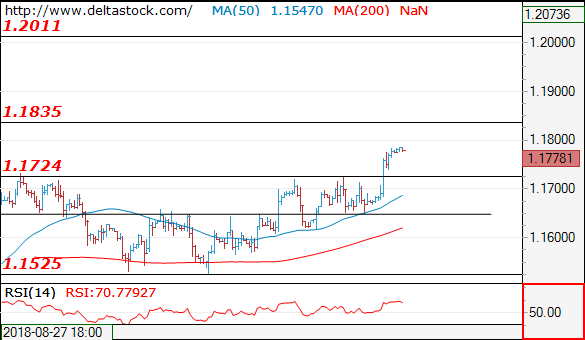
EUR/USD
Current level - 1.1778
Finally, the pair broke through 1.1730 hurdle and the outlook is positive, for a test of 1.1835, en route to 1.2010 zone. Initial intraday support lies at 1.1730, followed by the crucial low at 1.1650.
| Resistance | Support | ||
| intraday | intraweek | intraday | intraweek |
| 1.1835 | 1.1835 | 1.1730 | 1.1300 |
| 1.1920 | 1.2010 | 1.1650 | 1.1100 |
USD/JPY
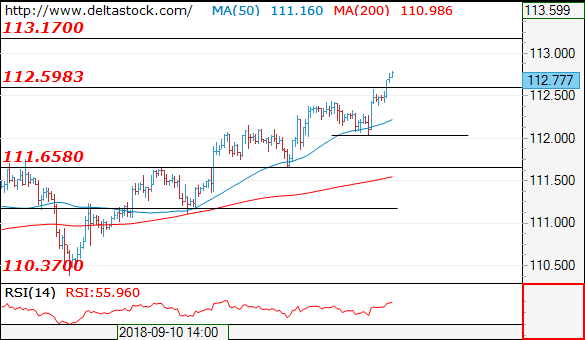
Current level - 112.77
The bias is positive above 112.60, for a rise towards 113.20 en route to 114.40 zone. Crucial on the downside is 112.00 area.
| Resistance | Support | ||
| intraday | intraweek | intraday | intraweek |
| 113.20 | 114.40 | 112.60 | 111.65 |
| 114.40 | 114.40 | 112.00 | 110.40 |
GBP/USD
Current level - 1.3259
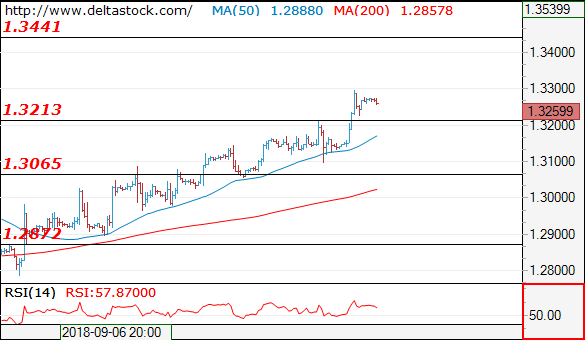
My outlook remains bullish above 1.3215 support, for a test of 1.3440 area. Crucial on the downside is 1.3100 low.
| Resistance | Support | ||
| intraday | intraweek | intraday | intraweek |
| 1.3300 | 1.3440 | 1.3215 | 1.2570 |
| 1.3440 | 1.3440 | 1.3100 | 1.2570 |
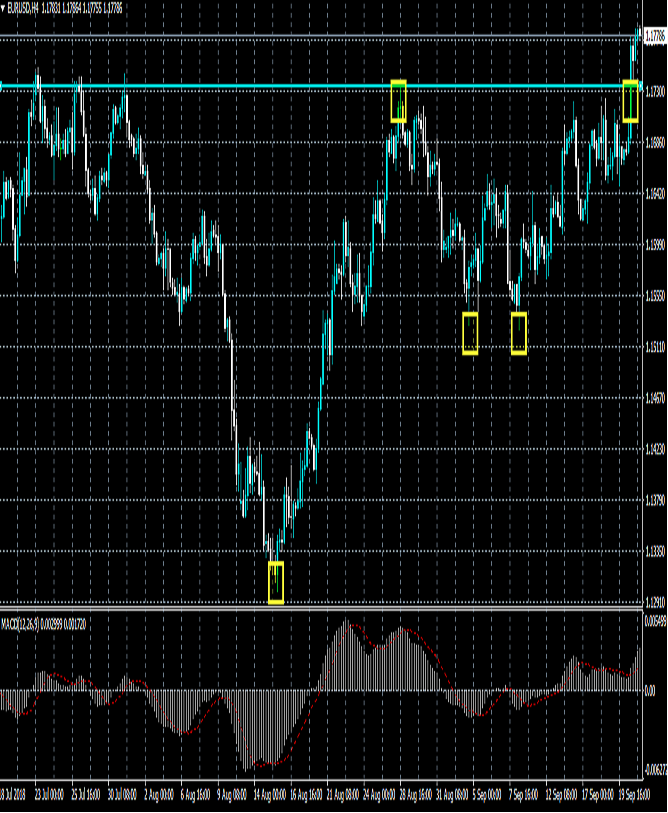
EURUSD Now Bullish Above 1.1730 Level
The euro has performed a major technical breakout against the US dollar, with buyers finally breaking through the 1.1730 resistance level. Further upside gains remain likely while price trades above the 1.1730 level, with the 1.1800 level the next major technical hurdle for euro buyers. The bullish inverted head and shoulders pattern has been triggered, with an upside projection that would take the EURUSD close to the 1.1950 level.
The EURUSD pair strongly bullish while trading above the 1.1730 level, key resistance is found at the 1.1800 and 1.1850 levels.
If the EURUSD pair moves below the 1.1730 level, key support is found at 1.1700 and 1.1650 levels
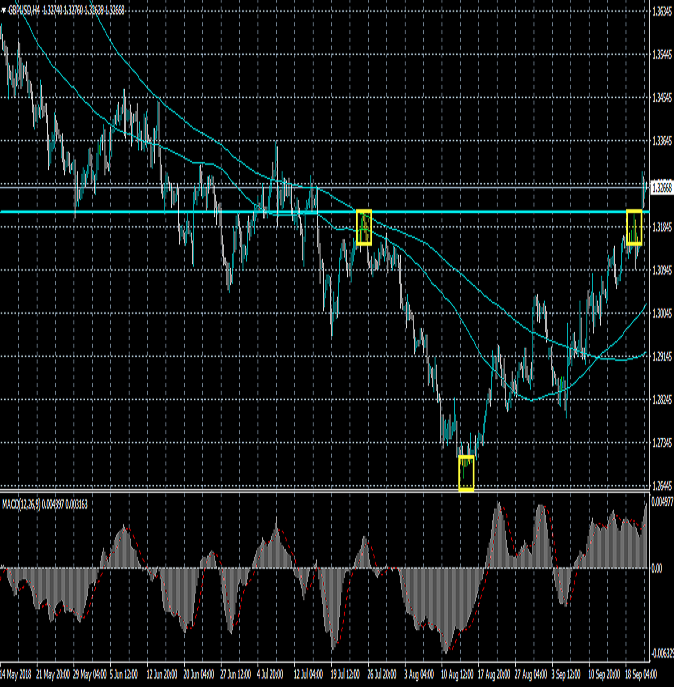
GBPUSD Short Term Bullish Target Reached
The British pound has moved to its highest trading level against the greenback since July 16th, hitting 1.3297, as the US dollar tumbles across the board. The GBPUSD pair has now pulled back slightly after reaching the initial upside target of the lower time frame inverse head and should. Price-action still remains bullish, with price now trading above the neckline of a much larger bullish pattern.
The GBPUSD pair is strongly bullish while trading above the 1.3205 level, key resistance is found at the 1.3300 and 1.3350 levels.
If the GBPUSD pair moves below the 1.3205 level, key support is found at the 1.3170 and 1.3140 levels.
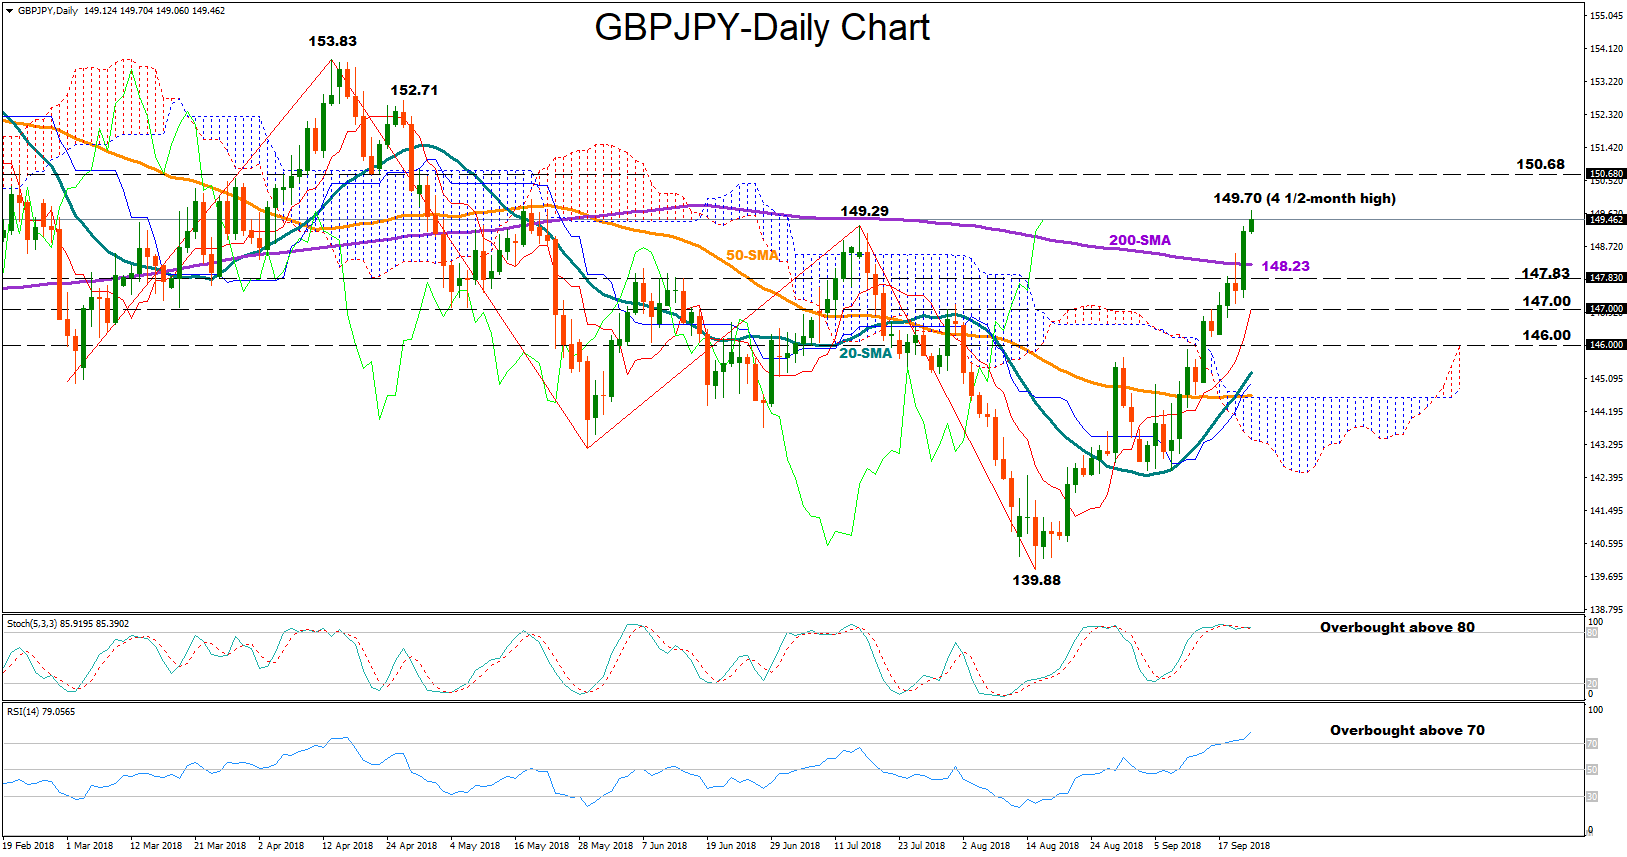
GBPJPY Bullish But Overbought Above 200-SMA
GBPJPY recorded an impressive rally on Thursday, closing above the 200-day (simple) moving average (MA) for the first time since May. The pair continues its bullish run today, printing fresh highs above the previous peak of 149.29. An indication that the rebound off 139.88 could hold for longer in case the price manages to finish the day substantially above the aforementioned peak.
Technically, the market is located in overbought territory given that the RSI has climbed above 70 and the Stochastics are in a sideline move above 80. While these are warning signals that a price reversal may be around the corner, the red Tenkan-sen line has increased its positive momentum above the blue-Kijun-sen line supporting that the upside is not likely to end at least in the near term.
Should the pair extend gains, the 4 ½ -month high of 149.70 marked early on Friday could come into view again. Slightly higher the 150 round-level may be another resistance point to keep in mind before attention turns to 150.68, the low on April 20. If the latter proves to be a weak obstacle as well, eyes could turn to 152.71, taken from the high on April 26.
In the alternative scenario, a reversal to the downside and particularly a break beneath the previous peak of 149.29 could find support between 147.83 and 148.23 formed by June’s peaks and the 200-day MA. The area offered some support back in March as well. Even lower, bears could try to cross below 147.00 which formed a strong barrier to downside movements several times in the past, while steeper declines may target the area around 146.00 too.
In the medium-term picture, GBPJPY has traded neutral over the past three months, though as long as the 50-day MA shows no appetite to reverse the bearish cross with the 200-day MA, chances for the negative outlook to reemerge are high.
XAUUSD Intraday Analysis
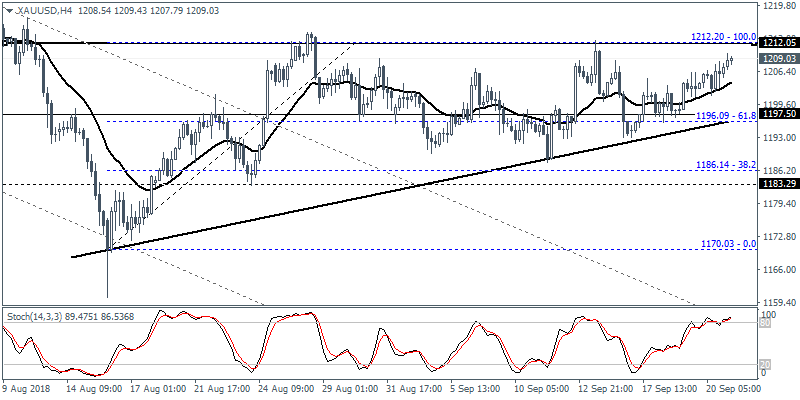
XAUUSD (1209.03): Gold prices were seen gradually inching higher. However, price action continues to remain trading subdued for the most part. The long-time consolidation at the current levels likely indicates a potential breakout to the upside. The resistance area of 1212.20 remains a key price level. A breakout above this level will trigger the ascending triangle pattern. The minimum upside target is seen at 1238.00.
GBPUSD Intraday Analysis
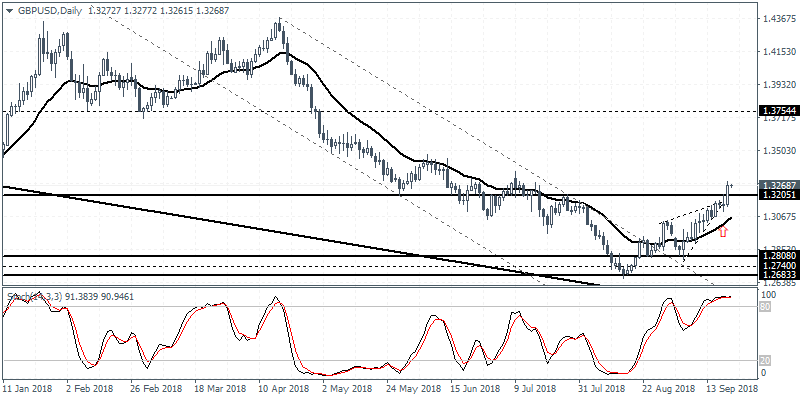
GBPUSD (1.3268): The GBPUSD currency pair breached past the resistance level of 1.3205. The breakout above this level is likely to see price action continue to extend the gains further. Support is likely to be established at 1.3205 following which further gains could be expected. The next main target is seen at 1.3754 which marks a retest of the support level that previously gave way to the declines. To the downside, a decline below 1.3205 could still keep GBPUSD biased to the upside.
EURUSD Intraday Analysis
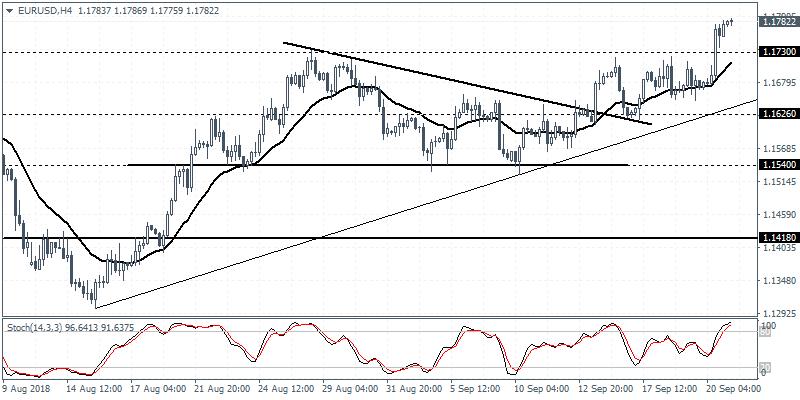
EURUSD (1.1782): The EURUSD currency pair posted gains on Thursday. Price action broke past the resistance level at 1.1730 with a strong bullish candlestick. However, the gains are unlikely to hold unless there is a follow through. In the near term, the EURUSD is at risk of dipping back to 1.1730. Establishing support at this level is crucial for price action to extend gains toward 1.1960 - 1.1920 level of resistance. This is most likely going to be the next target. To the downside, failure to hold near 1.1730 could push EURUSD back to trading in its range.
SNB Leaves Monetary Policy Unchanged
The European trading session saw the Swiss National Bank leaving its monetary policy unchanged. The SNB's decision to leave interest rates unchanged was widely expected.
The Norges bank monetary policy meeting saw interest rates being hiked. Norway’s key interest rates now stand at 0.75% from 0.50% which marked a record low in interest rates history for Norway.
Retail sales data in the UK rose 0.3% on the month. This beat estimates of a 0.2% decline. Previous month’s retail sales were also revised higher to show a 0.9% increase.
Data from the U.S. showed existing home sales increased by 5.34 million. The data was slightly below the median estimates.
The economic calendar today will see the release of the flash manufacturing and services PMI reports from the Eurozone. Data is expected to show no major changes to the business activity in the sectors.
The NY trading session is relatively quiet. Canada's inflation data will be the major event of the day. Headline inflation is forecast to decline by 0.1% on the month. This follows a 0.5% increase in inflation during the month before.
Retail sales reports are also due. Headline retail sales in Canada are expected to rise 0.3% following a 0.2% decline in the previous month. Core retail sales are expected to rise 0.6% after a 0.1% decline previously.
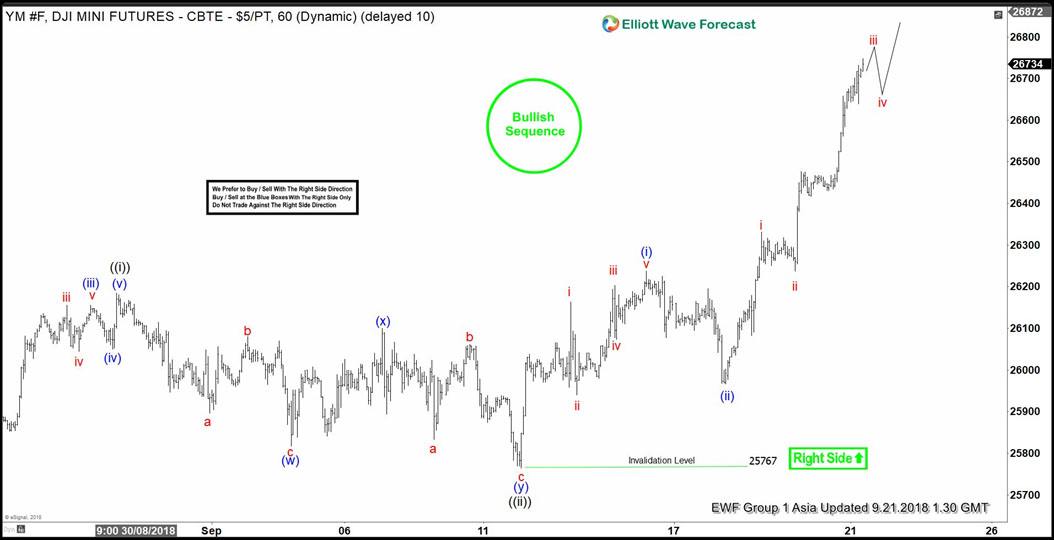
Elliott Wave: DJIA Mini Futures Nesting Higher Within Wave 3
DJIA Mini Futures mid-term Elliott wave view suggests that the cycle from 2/05/2018 low is nesting higher as impulse structure & already managed to make new all-time highs. While shorter-cycles suggests that index should be extending higher in lesser degree wave ((iii)) of 3 still looking for more upside extension. The initial rally in index to $26185 high ended Minute degree wave ((i)) in 5 waves structure. Down from there, the pullback to 25767 low ended intermediate wave ((ii)) pullback.
The internals of Minute wave ((ii)) pullback unfolded as double three structure where Minutte wave (w) ended in 3 swings at 25819 low. Minutte wave (x) ended at 26092 and Minutte wave (y) of ((ii)) ended in 3 swings at 25767. Up from there, Minute wave ((iii)) remain in progress as impulse with lesser degree cycles showing 5 waves structure in each leg higher i.e Minutte wave (i) showed 5 waves rally up to 26237 high. Minutte wave (ii) ended at 25991 low & Minutte wave (iii) is extending higher in another 5 waves. Near-term, while dips remain above 25767 low the index is expected to see more upside. We don’t like selling it as the right side tag is up and having a bullish sequence. Therefore, expect buyers to appear on any dip in 3, 7 or 11 swings against 25767 low.
DJIA Mini Futures 1 Hour Elliott Wave Chart