

Sample Category Title
CAD Rallies On Nafta Optimism
Wednesday September 12: Five things the markets are talking about
It's 'hump' day and despite the contained trading ranges across the various asset classes, investors have a lot to contend with, and strategize for, as we head towards the Autumn months which are expected to bring heightened volatility and risk aversion to financial markets.
China and EM crisis risk – can they both be pushed deeper at the same time?
U.K and E.U are preparing for a “special” summit in November – will the Irish be blamed for a “hard” Brexit and can PM Theresa May survive a leadership challenge?
Telegraphed Fed rate hikes – is the market willing to accept two more Fed hikes by year-end?
Trump, tariffs and trade – will the President go too far and hurt the U.S economy?
U.S Midterms – pro-Democratic November election results?
This morning across the asset classes, global equities mostly see red as investors' assesse the outlook for global growth amidst heightened trade tensions. Oil prices are well supported as dealers try to get a handle on Hurricane Florence potential impact.
U.S two-year yields trade atop a decade high as dealers nail down two more Fed rate hikes to close out this year. U.S 10's have stalled their advance towards +3%, which is providing for a steady U.S dollar against G-10 currency pairs.
On tap: The next three-days are busy on the data front. Today, it's the release of U.S PPI (08:30 am EDT) and Aussie employment numbers (09:30 pm). Tomorrow, both the ECB and BoE deliver their monetary policy rate announcement and on Friday, both China and the U.S release their industrial production (IP) and retail sales prints.
1. Stocks see mostly red
Market worries about escalation in the Sino-U.S trade war and the outcome of U.S-Japan trade talks negatively impacted Asian regional bourses in the overnight session.
In Japan, the Nikkei fell -0.3% as chip-stocks followed the weakness of their U.S counterparts' performance yesterday. Not helping was agriculture equipment maker Kubota plummeting after admitting falsifying data. The index closed out the previous session +1.3% higher. The broader Topix lost –0.7%.
Down-under, Aussie shares ended lower on financials and miners. The S&P/ASX 200 index fell -0.1% at the close of trade, having risen +0.6% Tuesday. The index has now fallen for nine of the last 10 sessions. In S. Korea, the KOSPI stock index closed steady (-0.02%) overnight amid investor concerns about EM and the latest round of verbal threats in the Sino-U.S trade conflict.
In China, stocks fell Wednesday morning, dragging the Shanghai Composite and the blue-chip CSI300 indexes down to new multi-year lows, on Sino-U.S trade worries, with China seeking WTO sanctions. The Shanghai Composite index was down -0.33%, while China's blue-chip CSI300 index was down -0.61%.
The declines continued for Hong Kong equities. The Hang Seng Index was off a further -0.5% as it officially entered bear-market territory.
In Europe, regional bourses opened higher, in contrast to Asia, mostly supported by some positive Brexit comments from E.U's Juncker, who welcomes PM Theresa May's Brexit proposal and on robust oil and mining stocks
U.S stocks are set to open in the 'black' (+0.2%).
Indices: Stoxx600 +0.5% at 373.6, FTSE +0.12% 7282, DAX +0.% at 12030, CAC-40 -0.8% at 5326, IBEX-35 +0.2% at 9285, FTSE MIB +0.27% at 20909, SMI +0.6% at 8970, S&P 500 Futures +0.2%
2. Oil prices rally on falling stockpiles, looming sanctions and Florence
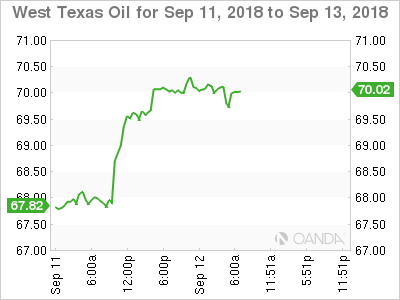
Oil prices have rallied overnight after a report of a decline in U.S crude inventories and pending sanctions against Iran raised expectations of tightening supply, while top Russia warned of a fragile global market. U.S oil prices also found support from hurricane Florence that is threatening U.S East Coast fuel markets.
U.S West Texas Intermediate (WTI) crude futures are at +$69.93 per barrel, up +68c, or +1% from Tuesday's close – WTI futures gained +2.5% yesterday. Brent crude futures have climbed +30c, or +0.4%, to +$79.36 a barrel – Brent gained +2.2% yesterday.
Also providing support is U.S inventories. API data Tuesday showed a large drawdown in inventories. Stocks fell by -8.6m barrels in the week to Sept. 7 to +395.9M.
Expect dealers to take their cue from today's EIA inventory report.
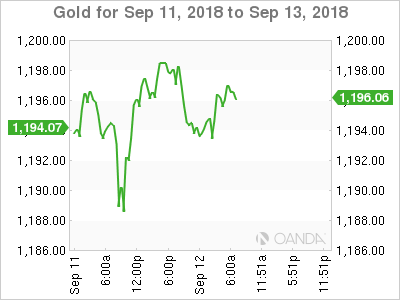
Ahead of the U.S open, gold prices have edged a tad lower as the key technical resistance level (+$1,200) continues to act as a deterrent for the 'yellow' metal and as the Yuan weakened outright on fears the U.S-China trade war could escalate. Spot gold is down -0.3% at +$1,194.08 an ounce, after hitting its lowest since Aug. 24 at +$1,187.21 yesterday. U.S gold futures are down -0.3% at +$1,198.90 an ounce.
3. German Bund yield steadies above +0.40%
Both the ECB and BoE will hold their respective policy meetings tomorrow. Neither CB is expected to make any major policy changes.
The demand for safe-haven government debt has also been weak this month by declining fears about the political situation in Italy, where a new populist government is working on its first budget proposal. They expect to adhere to the E.U rules and regulations.
Overnight, the selling of high-grade sovereign bonds was led by Europe, with the 10-year German Bund yield backing up to +0.431% from Tuesday's +0.404%. In the U.K, the 10-year Gilt yield increased to +1.498% from +1.470%.
Stateside, U.S government bond prices are also lower as the market braces for the possibility of tighter monetary policy – a further two rate hikes are been priced in by Fed by the end of 2018. U.S 10's are trading just shy of the psychological +3% level at +2.97%.
4. CAD rallies on Nafta optimism
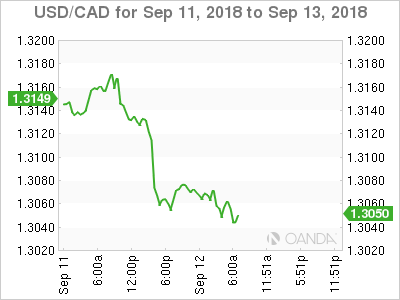
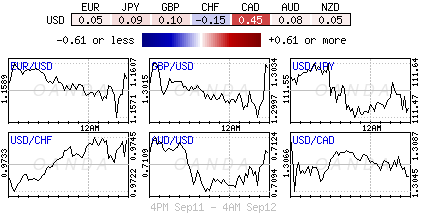
Late yesterday afternoon, USD/CAD (C$1.3048) encountered a heavy sell-off on Nafta optimism comments by President Trump. Currently, the pair remains under pressure with the 20-period moving average standing below the 50-period one. According to the techies, the RSI has broken below the 'over-sold' area of 30, showing a strong downside momentum.
Investors should expect key resistance to be located just north of C$1.3100 and as long as this key resistance is not penetrated, intraday “bearishness” should remain in vogue.
Sterling (£1.2998) briefly penetrated the £1.3000 support level after the BBC reported a group of about 50 lawmakers in PM Theresa May's government had met to discuss “how and when” they could force her out of her job. The pound (£1.3040) was able to rebound and recoup all of its Euro-session losses on favourable Brexit comments E.U's Juncker.
Finally, SEK (€10.4848) remains in 'no man's land' after last Sunday's inconclusive general election, which witnessed the rise of 'right.' As Sweden requires political clarity and if the parliamentary deadlock cannot be broken and new elections are announced, some of the political risk premium in the run-up to the vote could easily return.
5. Aussie consumer confidence weakest in 10-months
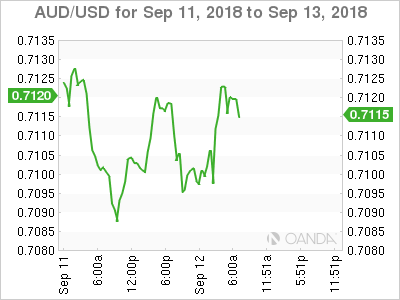
Data down-under overnight showed that Australian consumer confidence plummeted -3% in September in the wake of the political row among the ruling conservatives.
Digging deeper and politics aside, rising Aussie mortgage rates and household-budget pressures are also weighing on consumer optimism. All index components fell versus last months prints, while the reading for the next five-years' economic outlook slid the most at -5.8%.
Apple Bounced From Its Upward Trend Line|Amazon: Testing The Strength Of 100-Day Moving Average
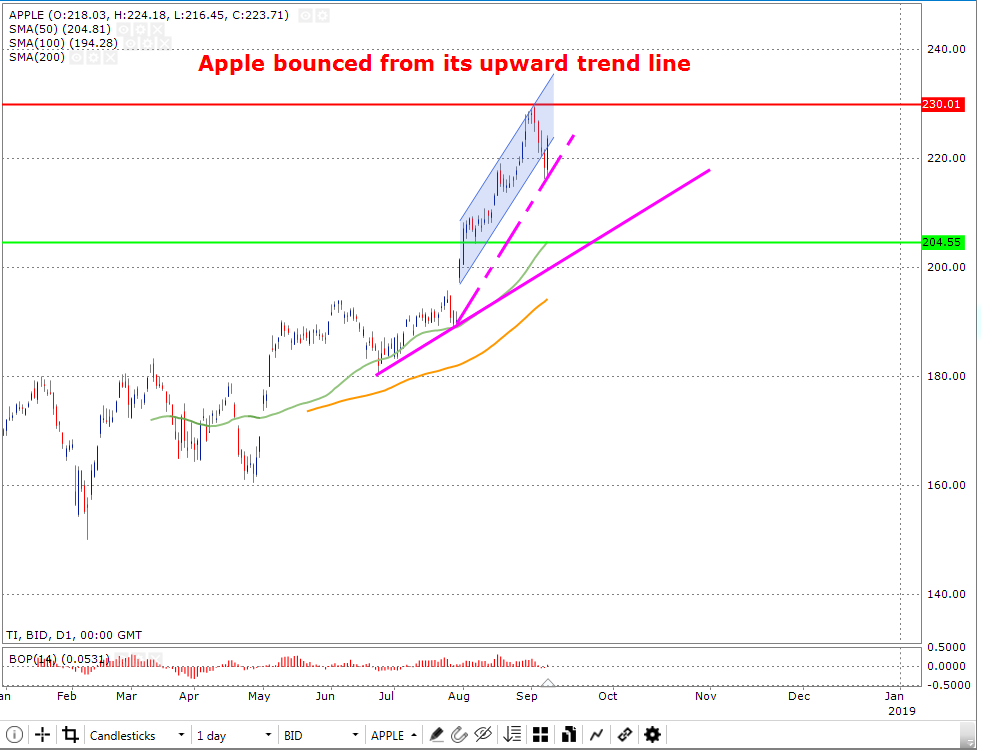
The chart below on a daily time-frame shows Apple trading on an upward trend line (shown in dotted pink). However, the price is close to the border of the dotted line. Therefore, there is an understanding from this that the price could maybe break below the first upward trend line. If this is the case, it will most likely lead to the bulls losing momentum. On the other hand, if the breakout takes place the price could possibly find its support zone (horizontal green line) which is priced at $204.55 near the 50-day moving average (colored in green line) or the second upward trend line (shown in solid pink).
Nevertheless, if the price does not break below the first upward trend line (shown in dotted pink) and the bullish momentum remains valid then the price may trade towards the resistance zone (colored in red) which is priced at $230.01.
The Balance of Power chart below shows that the power is in the bulls region. However, it seems that the momentum has only just started. Therefore, if the breakout below the first upward trend line takes place then the bears may hold power.
Major support: 204.55
Major resistance: 230.01
Amazon: Testing the strength of 100-day moving average
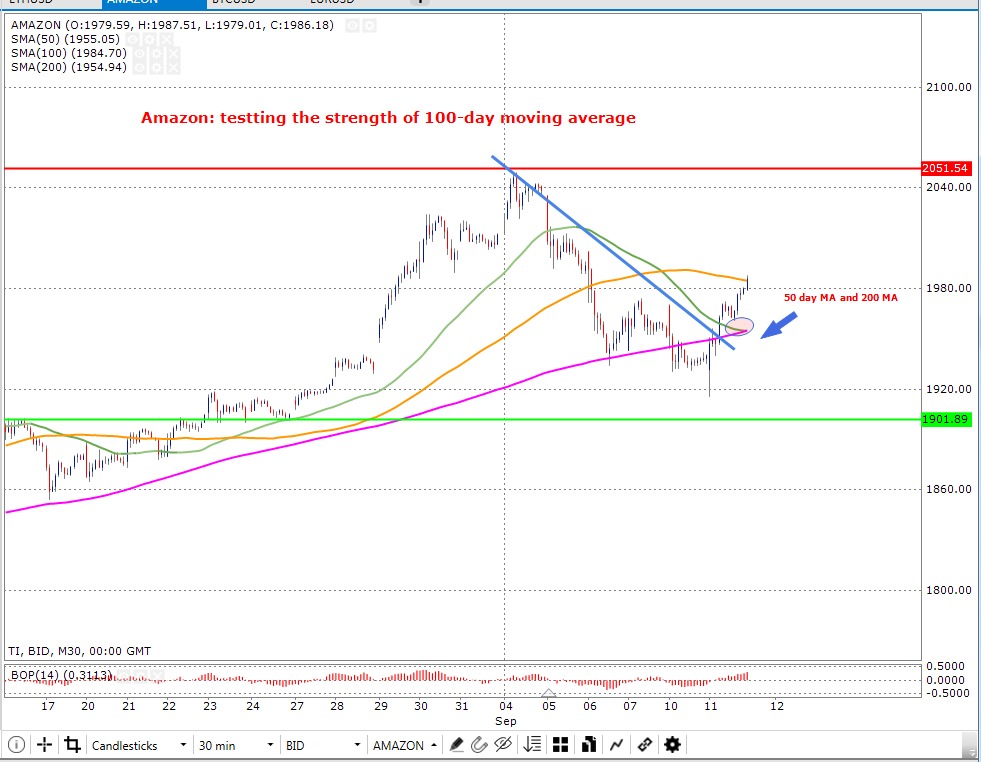
The chart below on an intra-day time frame (30 min) shows the Amazon market price trading in an uptrend where the bulls hold strong dominance. Moreover, it displays that the price had broken above its downward trend line and since then has experienced a gradual increase in price.
In addition, the current price seems to be testing the strength of the 100-day moving average (colored in yellow). Additionally, it can be seen below that the 50-day moving average (colored in green) and the 200-day moving average (colored in pink) are on the verge of merging together in the form of a cross over.
If this is the case and the 50-day travels below the 200-day then this could bring about a bearish momentum for the Amazon market price. This could possibly force the price to trade in the direction of the support zone (shown in horizontal green line) which is priced at $1901.89.
The Balance of Power chart below informs that the bulls hold power and control the price. If this continues and the bulls remain to hold dominance, the price may then continue to trade towards the resistance zone (shown in horizontal red line) which is priced at $2051.54.
Major support: 1901.89
Major resistance: 2051.54
US Futures: Trade War Making Investors Nervous
Trump is making investors more cautious and nerves are wrecking what China will do next. The country has asked for sanction on the US from the WTO
US futures and European markets are trading lower following the track of Asian markets. Not much has changed when it comes to markets, the focus is still on trade war and China is at the forefront of this. It is another risk off day today and traders are worried about the consequence of the news that China will be making a complain to the World trade Organisation to impose sanctions on the U.S.
U.S has strengthen its position when it comes to the complains outcome with the WTO but this time the complain is coming from China and the WTO would have to listen to this more carefully. It will be really intriguing how the WTO handle this complain because Donald Trump has already threatened many times to withdraw US from the WTO.
The net effect of this is on the dollar index which is picking up more momentum and gained more strength. The strength in the dollar index would become troublesome for the US economy if this continues at this pace, the country's economy will suffer and there will be no easy way out of this mess. Trump would up the ante by blaming other countries that they are manipulating their currencies.
The current trade war is making the US's closed ally to rebel against the country. We have seen this wave picking up more momentum and other major countries like China, Germany, France are busy in strengthening their relationship with Russia. President Xi Jinping, already said during his speech at Eastern Economic Forum in Russia that the country's relationship with Russia is at all-time high. His message was clear that his country is ready to study other relationship and work on different projects with them. Putin just added more fuel on the fire during the conference and criticised those countries who favour protectionism- a direct hint to US.
Trump needs to change his attitude or the US will become the biggest loser of this trad war. This ready to go kind of behaviour, which is a threat that the US is ready to impose more sanctions on China because it is not agreeing the way that the US wants to have the deal will not work. In fact, we think that we are moving fast toward a moment when the US will lose all of its control because other countries will have much stronger position because working together.
AUD In The Doldrums, CAD Grinds Higher
AUD falls to 3.5 year low
On Tuesday, the Australian dollar has slid to its lowest level since February 2016, reaching 0.7085 against the greenback. Even though the intensifying U.S.-China trade conflict has been weighting significantly on the Aussie, it is not the only factor. Indeed, as highlighted by September’s Westpac consumer confidence index that slid 3% from last month, Australian are turning more and more pessimistic. The recent decision from three of the four largest lenders to increase mortgage rate, persistent pressure on household budgets as well as political instability.
On the political side, the centre-right movement could lose its parliamentary majority, as it will face a by-election on October 20 following Malcom Turnbull’s resignation from parliament last month. Given the mounting popular dissatisfaction generated by the political turmoil, voters will be tempted to punish the ruling conservative coalition.
With the interest rate differential between the US and Australia that continues to narrow and Trump’s strong tendency to add fuel to the fire, which could only make negotiations with China more difficult, the Australian dollar is not out of the wood yet.
Loonie likes NAFTA
Canadian dollar bulls are celebrating. Renewed optimism on NAFTA has pushed USD/CAD lower, as US-Canada trade talks resumed yesterday. Both US President Trump and Canadian Foreign Minister Chrystia Freeland confirmed that negotiations are on track, with both ready to make concessions. USD/CAD continues to weaken amid stronger loonie against major currency pairs. The pair is heading along 1.3035 in the short-term.
Canadian negotiators appear willing to provide restricted access to its domestic dairy market in exchange for a broadening of the trade dispute settlement mechanism, along with cultural protection of Canadian media firms and finally steel and aluminium tariffs. Time is short: an agreement must be reached by end September, as the Trump administration will have to deliver a finalized agreement to Congress, including bilateral (with Mexico only) or trilateral terms, if agreement is found. Political support is at stake. Canadian PM Trudeau’s party strongly relies on Ontario and Quebec, where most dairy farmers are. Trump’s Republicans could face a reversal in November elections if no deal is settled.
EUR/USD Analysis: Most Likely Going Down
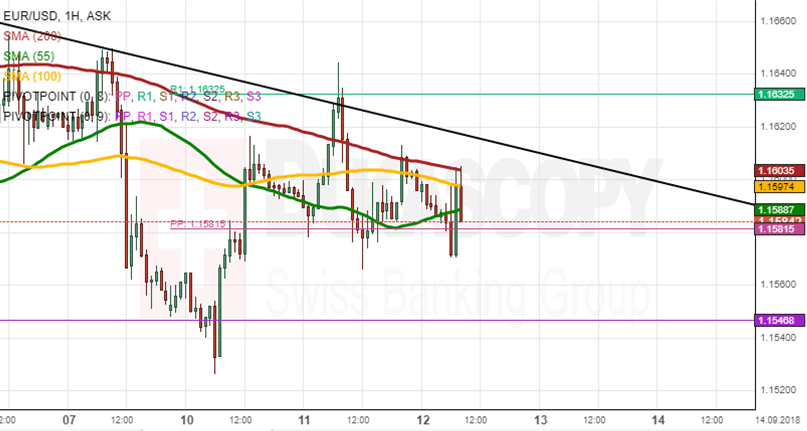
The European Single Currency depreciated 0.16% since Tuesday's trading session. On Wednesday morning, the rate passed the support of the weekly PP at the 1.1581 mark.
In regards to the near future, most likely, the rate should go downwards due to the resistance of the simple moving averages, which are located above 1.1580 and will not allow the rate to move upwards during the day. The rate might decline down to the 1.1540 level near the monthly PP during Wednesday's session.
In another scenario, the EUR/USD could remain without momentum and remain near the weekly PP at the 1.1581 mark.
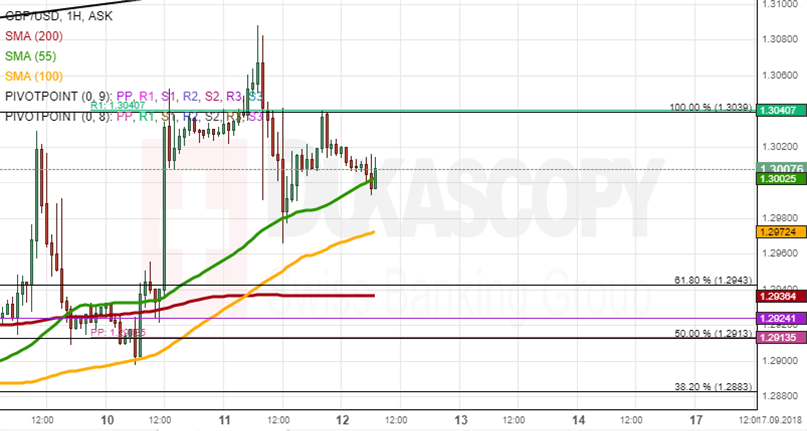
GBP/USD Analysis: Trades At 1.3020
The British pound depreciated 0.23 % against the US Dollar. The 55-hour simple moving average supported the currency exchange rate during Wednesday's morning hours.
In regards to the near future, most likely the rate will move downwards to trade near the 1.2960 mark due to the resistance of the weekly R1 at the 1.3040 level, which together with the August high has provided strong resistance in the past.
Be careful, any fundamental Brexit news may break most technical indicators and can ignore all the rules to push the rate to go in any direction. Watch out for news!
USD/JPY Analysis: Breaks Large Channel
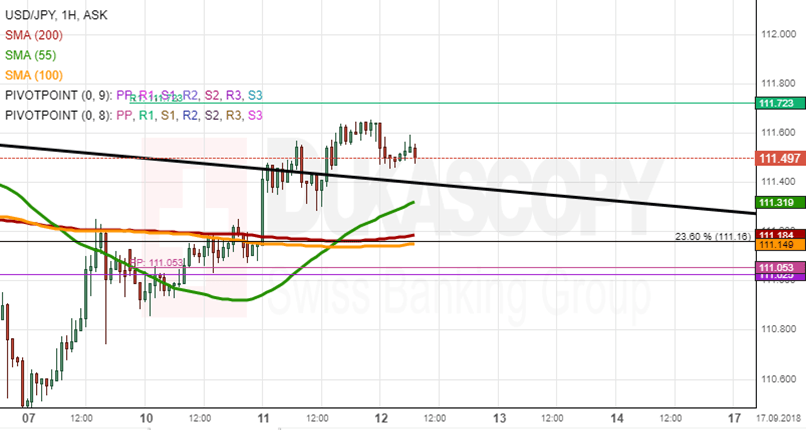
The US Dollar appreciated 0.37% against the Japanese Yen since Tuesday's session. The currency exchange broke the upper boundary of the large descending channel during the previous trading session.
In regards to the near-term future, the rate will go upwards to the weekly R1 at the 111.72 mark, which should stop the rate and retrace it back to the pattern during the day. The simple moving averages will try to catch up to the rate to give support.
Afterwards, the 55-hour SMA and the upper boundary of the large descending channel may play a role of support to push the rate upwards to pass the weekly R1 at the 111.72 mark or be passed and give way for a fall down to 111.20.
XAU/USD Analysis: Is Located Between The SMAs
The gold price appreciated 0.19% since Tuesday's trading session. The yellow metal was located between the simple moving averages during the Wednesday's morning hours.
In regards to the near future, most likely, the XAU/USD will move downwards due to the 200-hour and the 100-hour SMAs resistance's. Moreover, if the rate will go below the weekly PP, the rate will lose support until the 1,1547 level.
However, the monthly PP at the 1,1956 mark may give support to the currency to push it upwards passing through the SMAs to meet the bottom boundary of the ascending medium channel at the 1,2020 level.

EURJPY Stands Above SMAs But Turns Negative In Near Term
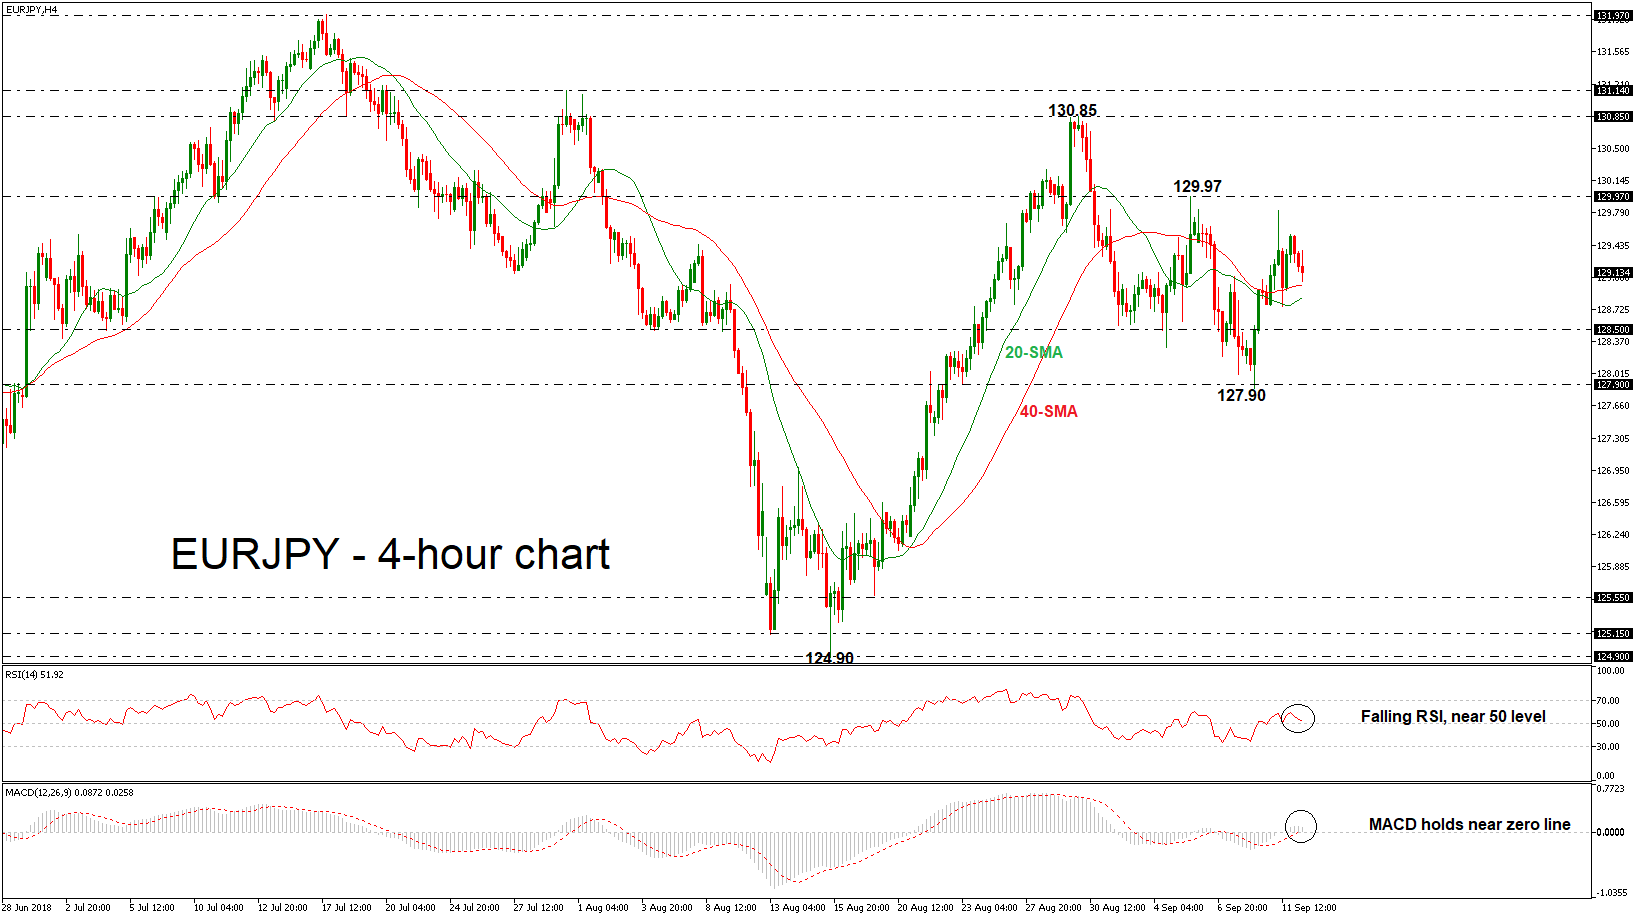
EURJPY has been trading sideways after the drop below the 129.97 resistance level, which currently acts as a major obstacle for the bulls. Currently, the price is moving above the 20- and 40-simple moving averages (SMAs) in the 4-hour chart, indicating a possible upside extension. Moreover, the RSI is pointing south above 50 level, while the MACD is moving lower in the positive zone.
A move to the upside may meet resistance around the 129.97 resistance barrier, this being a top recorded on September 5. In case of further upside extensions, the price could re-challenge the 138.85 level, taken from the high on August 30.
On the flip side, if there is a slip below the 20- and 40-SMAs there is an expectation to hit the 128.50 support barrier. Further declines below this level, could then target the area around the 127.90 hurdle, identified by the lows on September 10, which had successfully halted movements during the previous three weeks.
To sum up, the market is expected to hold neutral in the short-term and bearish in the medium-term.
Upcoming Employment Data Unlikely To Place A Floor On The Aussie’s Retreat
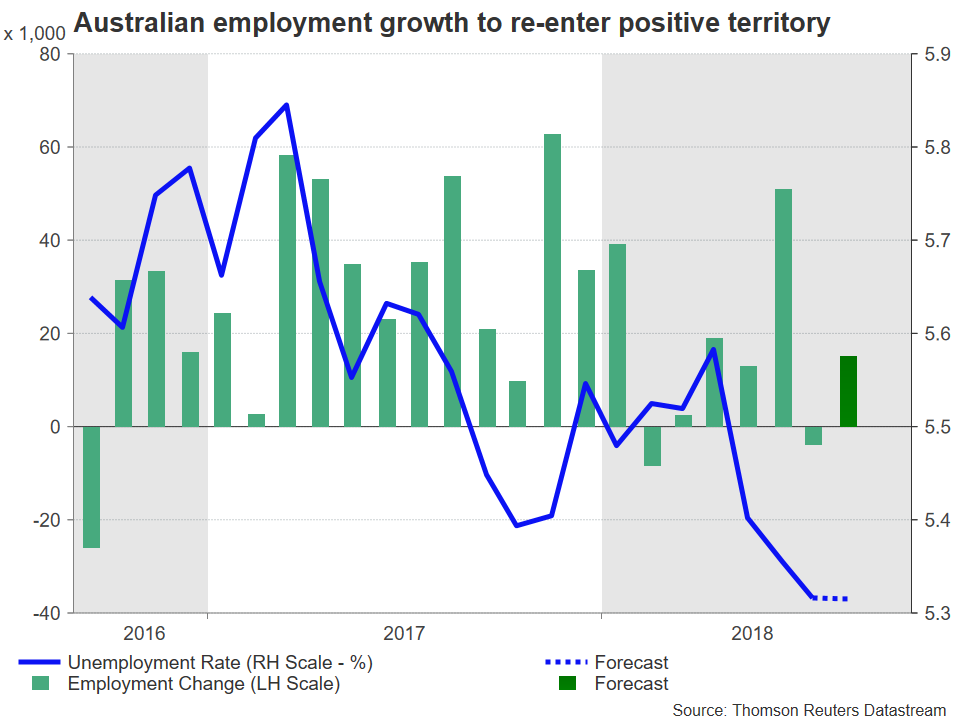
Australian employment figures for August are due on Thursday at 0130 GMT, with the economy expected to be a net creator of jobs following July's negative employment growth. The Aussie is on the receiving end of considerable pressure stemming from growing concerns for a full-blown trade war between the US and China, as well as on the back of domestic drivers. Strong data later in the week may provide some short-term relief to the battered currency, but unless the trade narrative turns rosier they are unlikely to offer a lasting boost to the Aussie.
The Australian economy is anticipated to have created 15.0k jobs in August after losing 3.9k in the previously reported month. Still, July's headline loss of jobs may be deceiving, given that the data were accompanied by a jump in full-time positions which are seen as having the greatest potential to revive stubbornly low wage growth; in other words, July's loss was fueled by a decline in part-time positions. Moreover, the unemployment rate matched a low last experienced in November 2012 in the previously tracked month and is forecast to remain at the same 5.3% level in August. This is positive, given that the participation rate is predicted to tick higher to 65.6%, from 65.5% in July.
Robust prints later on Thursday may provide a lift to the Aussie which is trading around two-and-a-half year low levels versus the greenback, though much like last week's Q2 GDP beat, a resulting rise in aussie/dollar may well be short-lived. Moreover, the data are unlikely to alter expectations pertaining to the Reserve Bank of Australia's rate outlook much; market participants effectively see zero odds for a move by the Bank over the remainder of 2018, according to Australian overnight index swaps.
What is perhaps needed for a sustained rally in the Aussie is a clear sign of a pick up in wages and/or an easing of trade tensions between the US and China. The latter holds true due to Australia's export- and China-dependency; indicatively, readings out of Australia last week showed the nation enjoying a record trade surplus with China year-to-date. Thus, a brighter outlook on the Chinese economy, as well as on global growth & trade, are seen as supportive for as stronger Australian currency. So far developments are not encouraging though, with a fresh round of US tariffs on $200 billion worth of Chinese imports possibly being implemented soon. In the meantime, President Trump expressed readiness on Friday to proceed with levies on virtually all Chinese imports to the US.
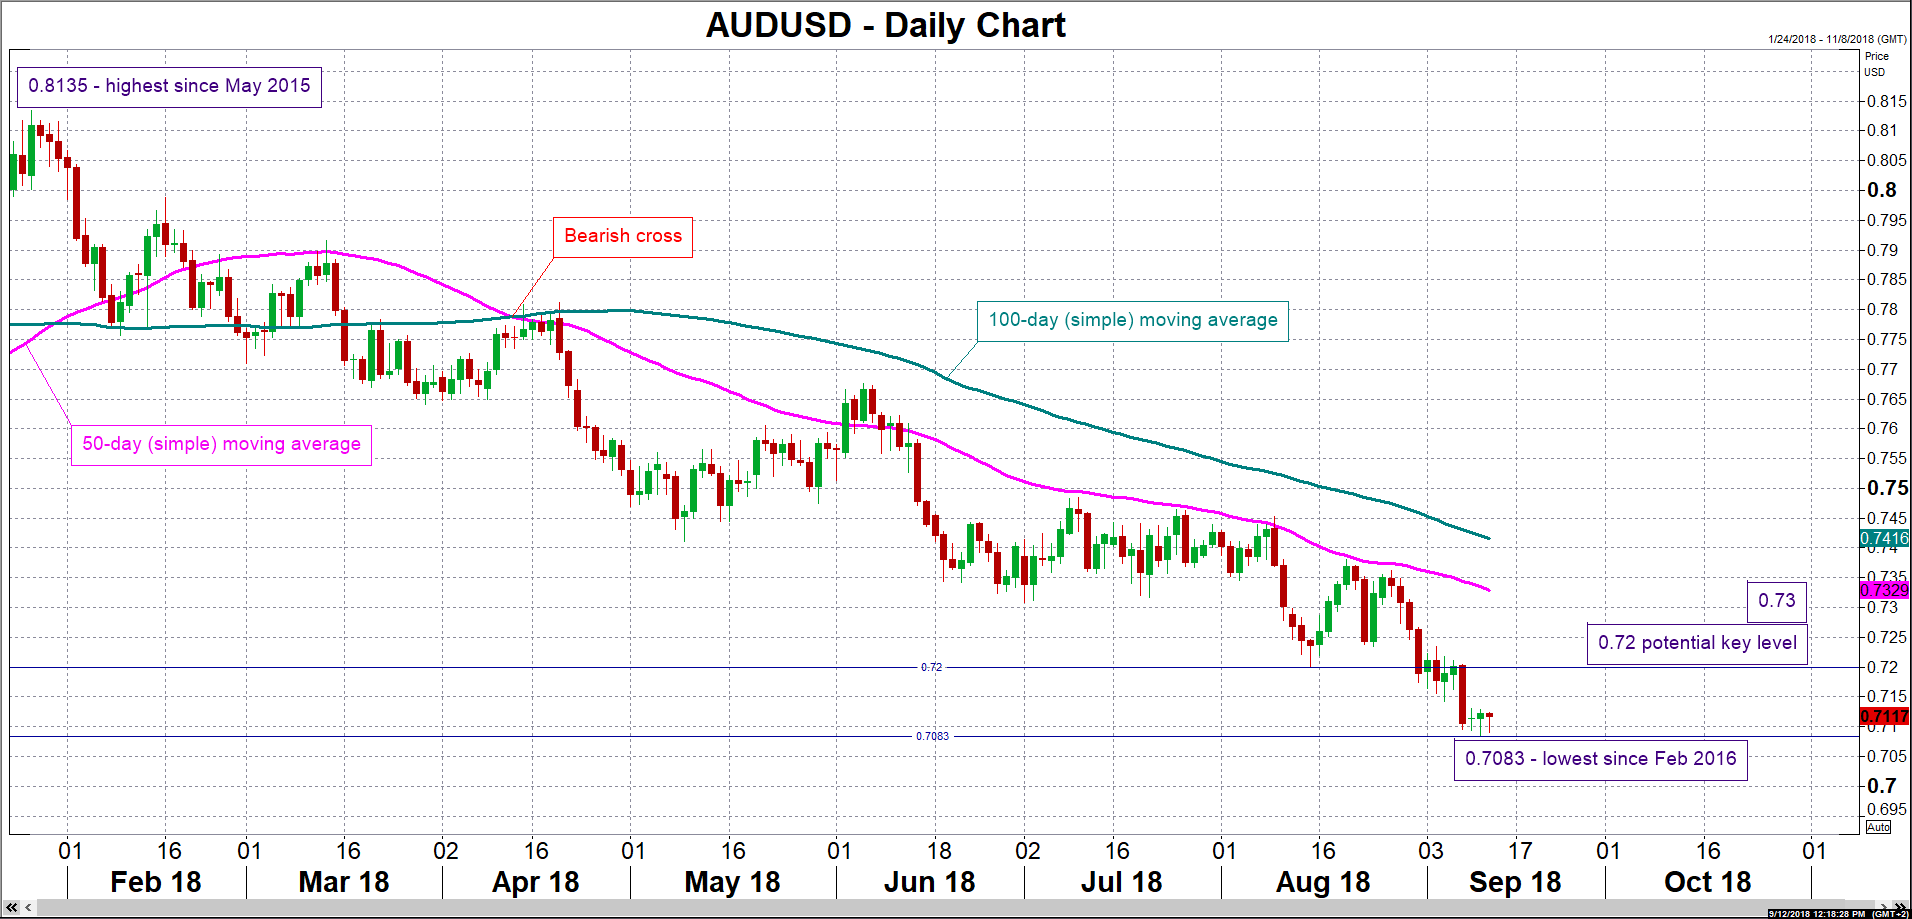
Upbeat numbers on employment or, more importantly, signs of abating trade tensions between the US and China are likely to propel AUDUSD higher. Resistance to a rising pair may take place around the 0.72 round figure. More bullish movement would shift the focus to the region around the current level of the 50-day moving average line at 0.7329 which was relatively congested from late June to early August, assuming that the 0.73 handle is broken first.
On the downside and in case of disappointing figures or rising trade risks, price action is likely to challenge Tuesday's two-and-a-half-year nadir of 0.7083. A drop below would bring the 0.70 mark into scope. It is of note that a double top from September last year and January-February of the current year on the weekly chart projects towards the 0.69 handle.
Lastly, another factor weighing on the Australian currency that bears mention is the decision by a number of commercial banks within the country to raise their mortgage rates. In essence, this has similar effects to an RBA rate hike and is therefore seen as further squeezing indebted households' ability to spend.