Sample Category Title
Markets Under Pressure Before The Busy Week
Asian markets have been declining for a third consecutive trading session on the fears of the Chinese-U.S. trade tensions escalating. The odds are that Trump will announce the expansion of tariffs for Chinese goods worth from $50 to $200 bln. on this coming Thursday.
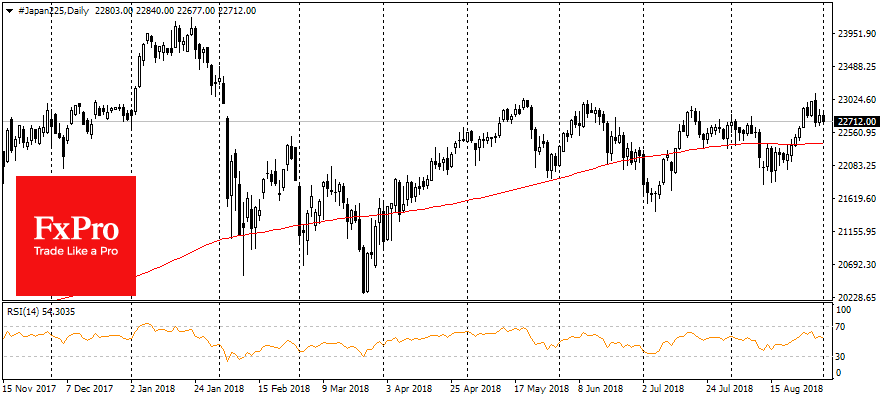
Already introduced tariffs significantly suppress investors’ sentiment. India’s companies are gaining an advantage in the production of goods that have already been tariffed, and Russia’s role as an LNG importer for China is growing. The escalation of the trade war risks further disrupting the habitual trade flows in the long term. In the short-term, it risks putting serious pressure on the stock markets. The Shanghai index is traded near the lows of 2.5 years. MSCI Asia-Pacific region without Japan has lost 0.7% this morning; Nikkei225 has decreases by 0.5%
The demand for protective assets supports the dollar. The dollar index has begun the trading the week at 95.10 – week highs. The EURUSD pair is once again testing support for 1.1600. The Australian dollar at the start of the new week has fallen to 0.7160, the lows since January 2017. The New Zealand dollar sank to 0.66, returning to a decline after a rebound in the previous two weeks. The demand for the protective yen and the dollar can remain the predominant theme of this week in anticipation of important news on the labour market and the announcement of Trump tariffs. 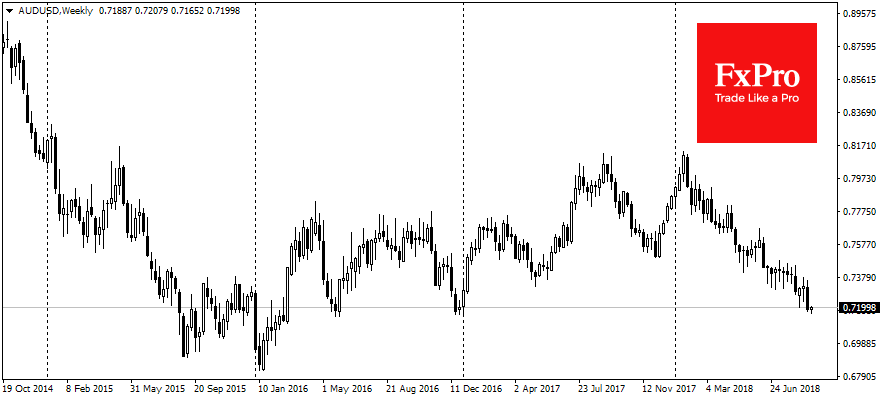
The dollar index in the second half of the week returned to the area above 95 on the turbulence of emerging market currencies, including Argentina and Turkey. These levels of the dollar index continue to act as a strong level of support and attract interest to buying on the dips strategy amid the rising tensions around traditional high-yielding currencies. 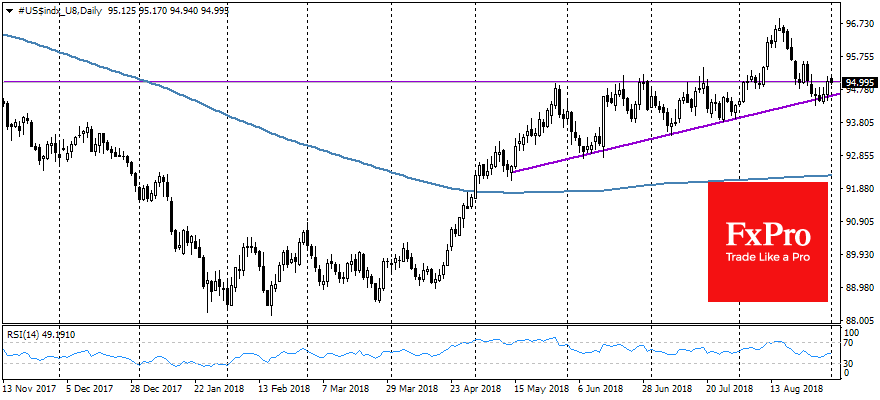
The British pound has fallen under 1.29 this morning, giving back more than 60% of the last week splash, when the EU claimed that they were ready to offer a deal to Britain. From the technical analysis side, the British currency has compensated a short-term overbought, and could be under moderate pressure following the global markets.
The Analytical Overview Of The Main Currency Pairs
The EUR/USD currency pair
Technical indicators of the currency pair:
Prev Open: 1.16639
Open: 1.15958
% chg. over the last day: -0.60
Day's range: 1.15889 – 1.16155
52 wk range: 1.0571 – 1.2557
The EUR/USD currency pair is decreasing. On Friday, August 31, the drop in quotes exceeded 70 points. The trading instrument has updated local extremes. At the moment, the EUR/USD currency pair is consolidating near the local support of 1.15900. The key resistance is a mark of 1.16300. The trade conflict between the United States and China is in the focus of attention. The EUR/USD quotes have the potential for further correction. We recommend opening positions from the key levels.
The news feed on 2018.09.03:
The index of economic activity in the manufacturing sector in Germany at 10:55 (GMT+3:00).
The US financial markets are closed due to the holiday.
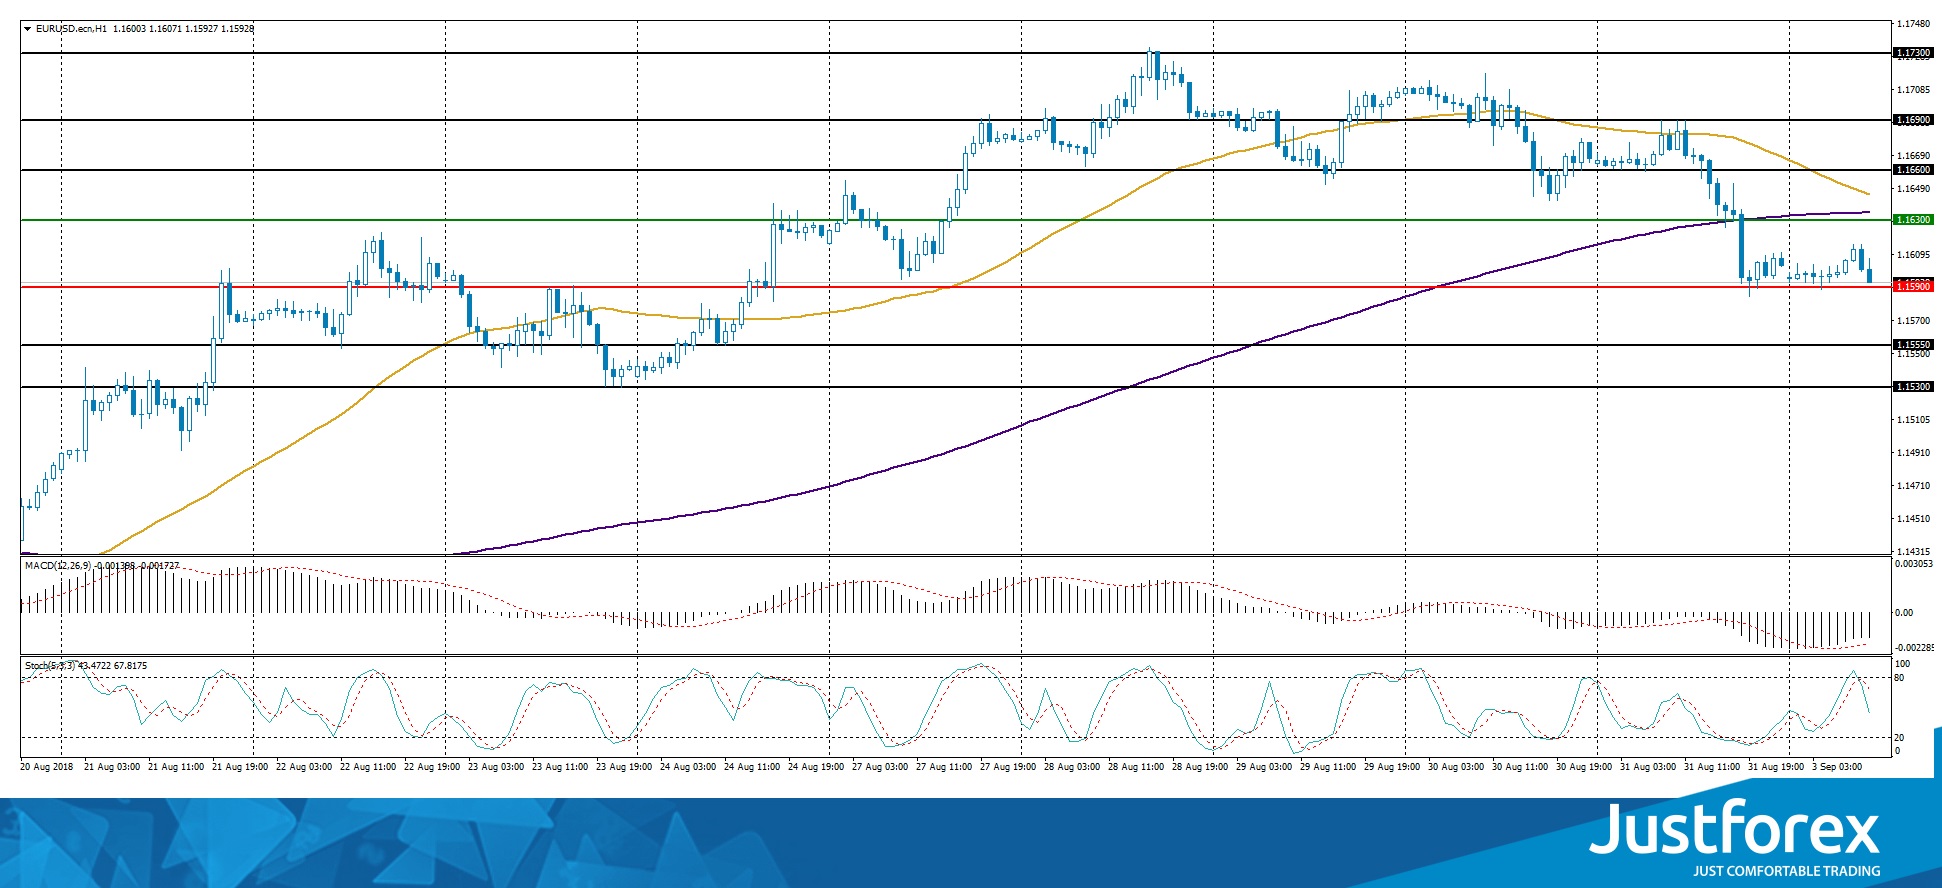
Indicators point to the power of sellers: the price has fixed below 50 MA and 200 MA.
The MACD histogram is located in the negative zone, but above the signal line, which gives a weak signal to sell EUR/USD.
Stochastic Oscillator is in the neutral zone, the %K line is below the %D line, which indicates the bearish sentiment.
Trading recommendations
Support levels: 1.15900, 1.15550, 1.15300
Resistance levels: 1.16300, 1.16600, 1.16900
If the price fixes below the local support of 1.15900, further correction of the EUR/USD currency pair is expected. The movement is tending to 1.15550-1.15300.
Alternative option. If the price fixes above 1.16300, we recommend considering purchases of EUR/USD. The movement is tending to 1.16600-1.16900.
The GBP/USD currency pair
Technical indicators of the currency pair:
Prev Open: 1.30053
Open: 1.29131
% chg. over the last day: -0.36
Day's range: 1.29032 – 1.29335
52 wk range: 1.2361 – 1.4345
The bearish sentiment prevails on the GBP/USD currency pair. Today, the trading instrument has opened with gap down more than 40 points. At the moment, quotes are consolidating in the range of 1.29000-1.29350. We do not rule out a further decline in the GBP/USD currency pair. We recommend following the current news regarding Brexit. Positions should be opened from the key levels.
Important economic reports on 2018.09.03:
The index of economic activity in the UK manufacturing sector at 11:30 (GMT+3:00).
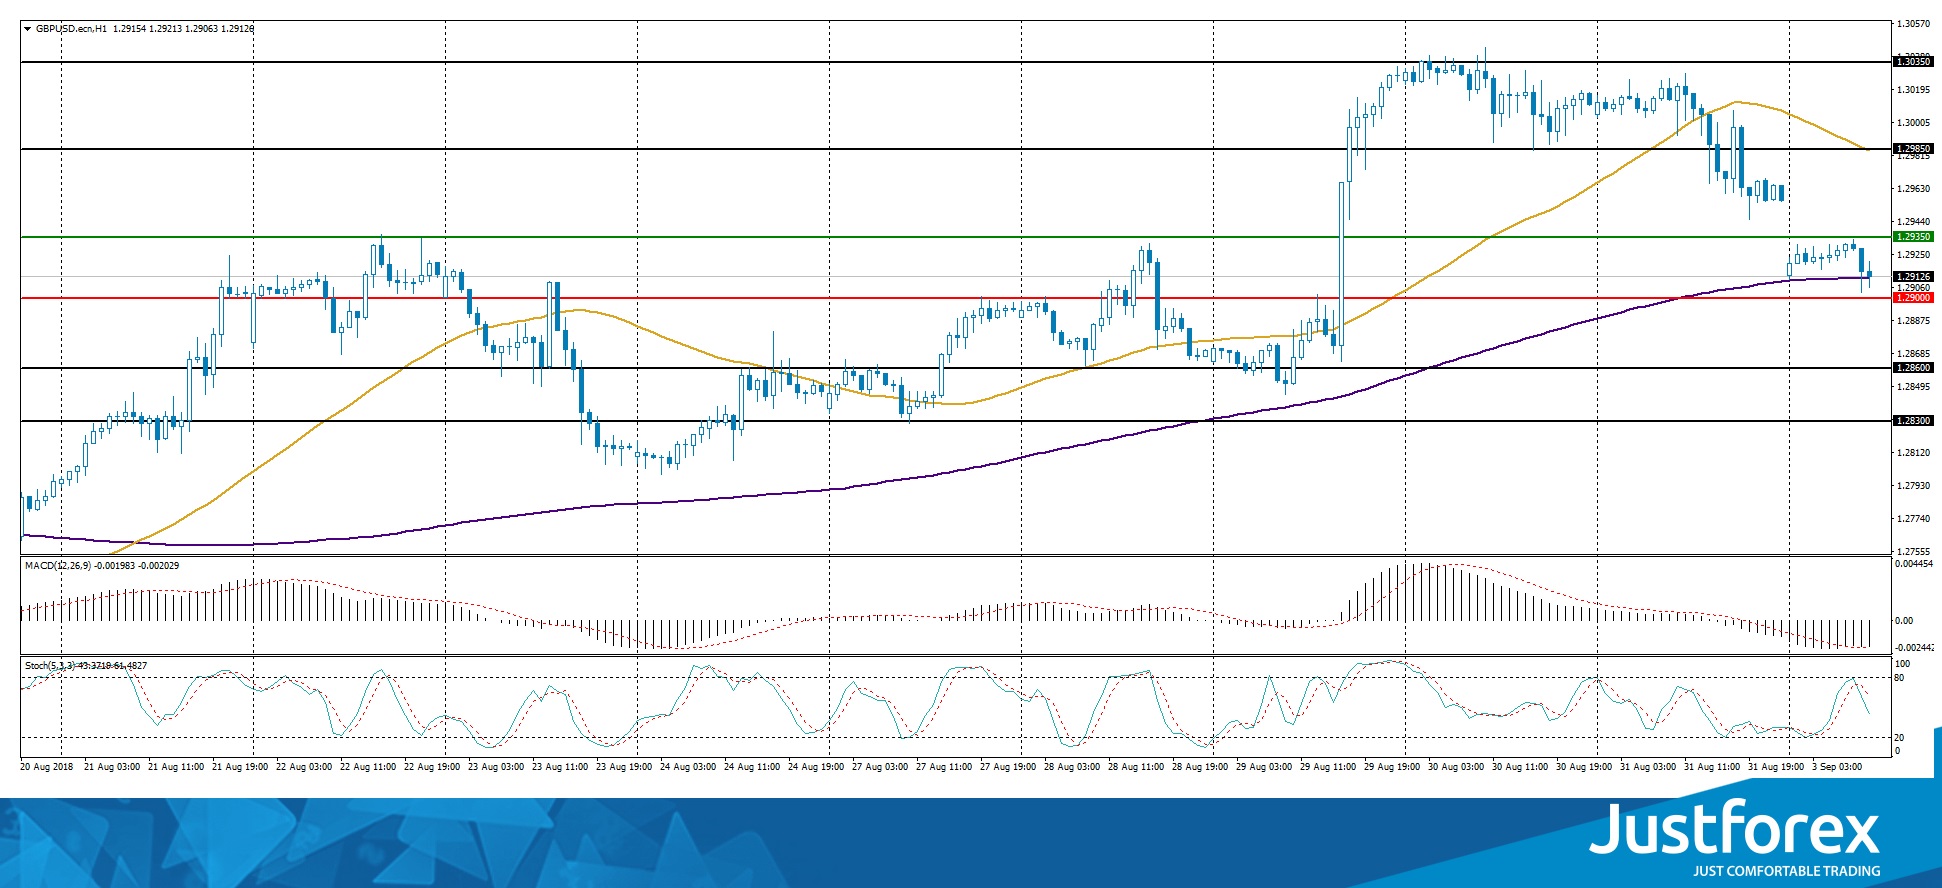
Indicators do not send accurate signals. The price is testing 200 MA.
The MACD histogram is in the negative zone and continues to decline, which signals a further drop in the GBP/USD quotes.
Stochastic Oscillator is located in the neutral zone, the %K line is below the %D line, which signals to sell GBP/USD.
Trading recommendations
Support levels: 1.29000, 1.28600, 1.28300
Resistance levels: 1.29350, 1.29850, 1.30350
If the price fixes below the round level of 1.29000, further fall of the GBP/USD currency pair is expected. The target movement level is 1.28600-1.28300.
Alternative option. If the price fixes above 1.29350, we recommend considering purchases of GBP/USD. The target movement level is 1.29750-1.29900.
The USD/CAD currency pair
Technical indicators of the currency pair:
Prev Open: 1.29708
Open: 1.30722
% chg. over the last day: +0.45
Day's range: 1.30464 – 1.30759
52 wk range: 1.2059 – 1.3795
The technical pattern on the USD/CAD currency pair is ambiguous. At the moment, quotes are consolidating. The key support and resistance levels are 1.30500 and 1.30850, respectively. We recommend opening positions from these marks. Investors expect new information regarding the NAFTA negotiations.
Financial markets of Canada are closed due to the holiday.
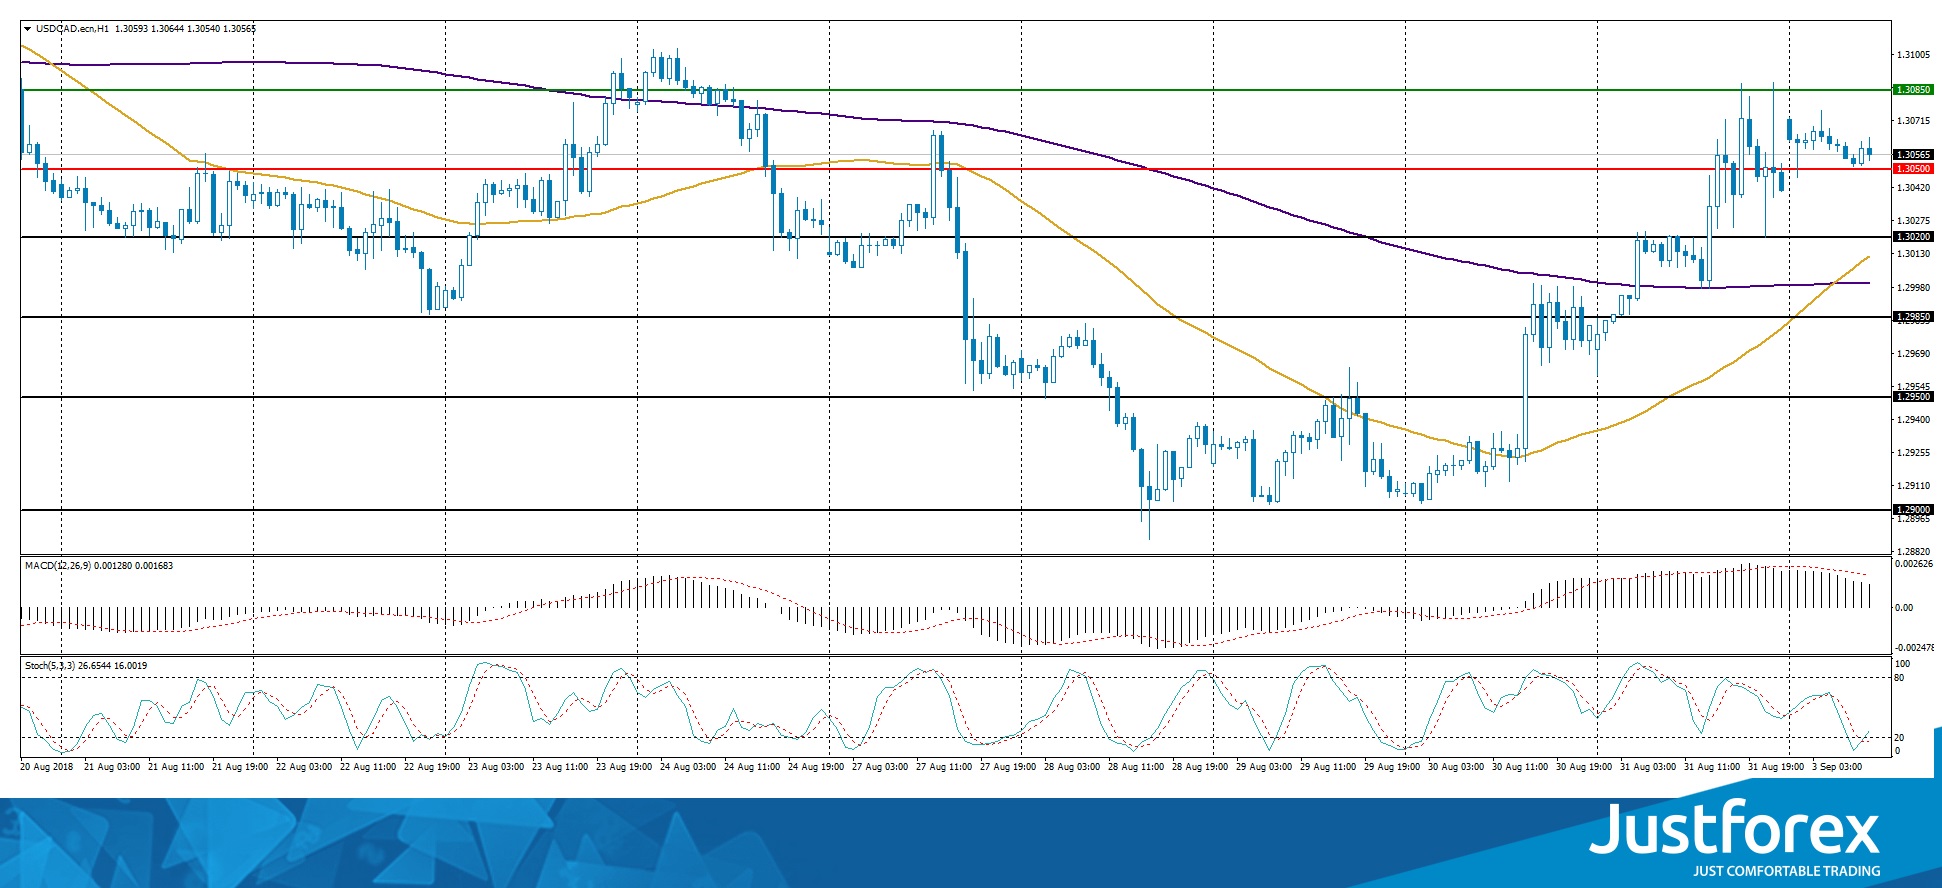
The price has fixed above 50 MA and 200 MA, which signals the power of buyers.
The MACD histogram is in the positive zone, but below the signal line, which gives a weak signal to buy USD/CAD.
Stochastic Oscillator is located near the oversold zone, the %K line is crossing the %D line. There are no signals at the moment.
Trading recommendations
Support levels: 1.30500, 1.30200, 1.29850
Resistance levels: 1.30850, 1.31000
If the price fixes above the resistance level of 1.30850, the USD/CAD quotes are expected to grow. The movement is tending to 1.31200-1.31400.
Alternative option. If the price fixes below 1.30500, it is necessary to consider sales of USD/CAD. The movement is tending to 1.30200-1.29850.
The USD/JPY currency pair
Technical indicators of the currency pair:
Prev Open: 110.965
Open: 111.051
% chg. over the last day: +0.05
Day's range: 110.850 – 111.118
52 wk range: 104.56 – 114.74
The USD/JPY currency pair is in a sideways trend. The technical pattern is ambiguous. At the moment, local support and resistance levels are 110.750 and 111.000, respectively. The trading instrument has the potential for further reduce. We recommend opening positions from the key levels.
Today, the news feed on the economy of Japan is calm.
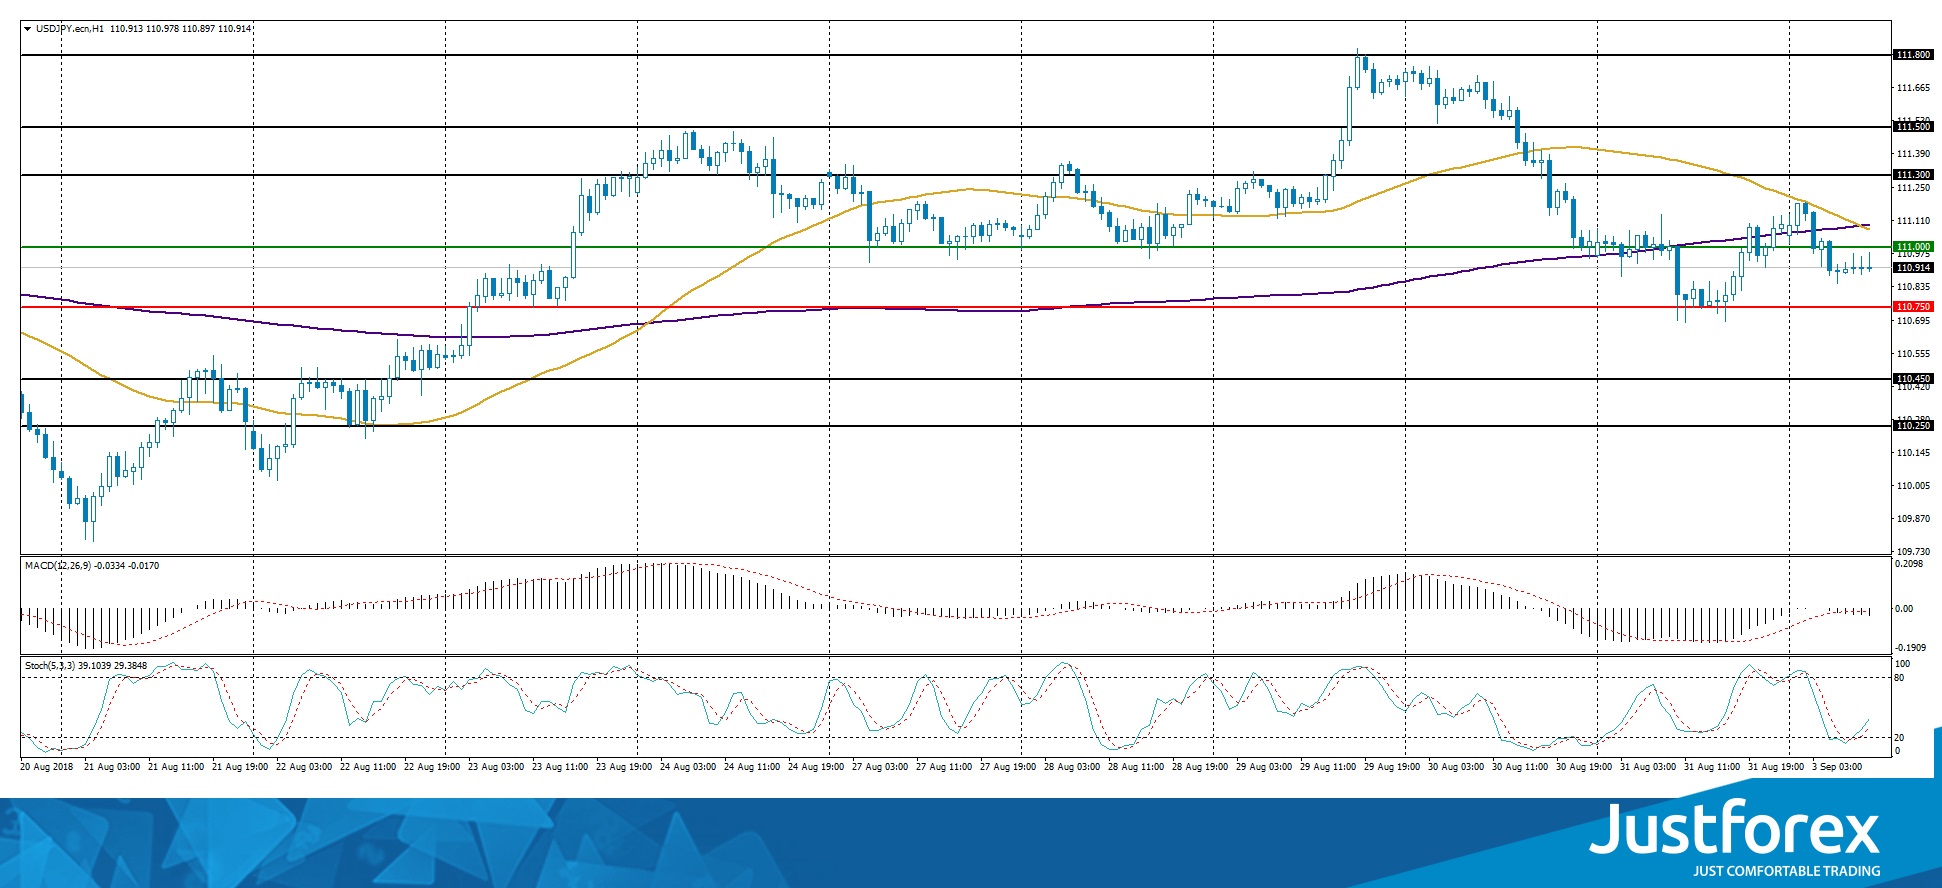
Indicators do not send accurate signals: 50 MA has crossed 200 MA.
The MACD histogram has moved to the negative zone, which indicates the bearish sentiment.
Stochastic Oscillator is located in the neutral zone, the %K line is above the %D line, which gives a signal to buy USD/JPY.
Trading recommendations
Support levels: 110.750, 110.450, 110.250
Resistance levels: 111.000, 111.300, 111.500
If the price fixes below the support level of 110.750, the USD/JPY quotes are expected to fall further. The movement is tending to 110.450-110.250.
Alternative option. If the price fixes above the round level of 111.000, it is necessary to consider purchases of USD/JPY. The movement is tending to 111.300-111.500.
Currency Majors Are Consolidating
ast week, trading on currency majors was very active. However, a unidirectional trend was not observed. On Friday, August 31, the dollar index (#DX) moved away from local lows and closed the trading session in the positive zone (+0.42%). Investors continue to assess the risks of trade conflict between the US and China. The United States and Mexico reached an agreement on the North American Free Trade Area (NAFTA). However, negotiations with Canada were fruitless.
Today, trading activity may be reduced due to holidays in the US and Canada. Financial market participants expect meetings of the Reserve Bank of Australia and the Bank of Canada. It is expected that regulators will keep key interest rates at the previous level of 1.50%. On Friday, September 7, the US will publish a report on the labor market, which may have a significant impact on the dynamics of major currency pairs.
Oil quotes are moderately declining. At the moment, futures for the WTI crude oil are testing a mark of $69.75 per barrel.
Market Indicators
On Friday, the major US stock indices showed mixed results: #SPY (0.00%), #DIA (-0.06%), #QQQ (+0.13%).
At the moment, the 10-year US government bonds yield is at the level of 2.86-2.87%.
The news feed on 03.09.2018:
The index of economic activity in the manufacturing sector in Germany at 10:55 (GMT+3:00);
The index of economic activity in the UK manufacturing sector at 11:30 (GMT+3:00).
Gold Retouches 1200 Key Level, Upward Correction In Near Term
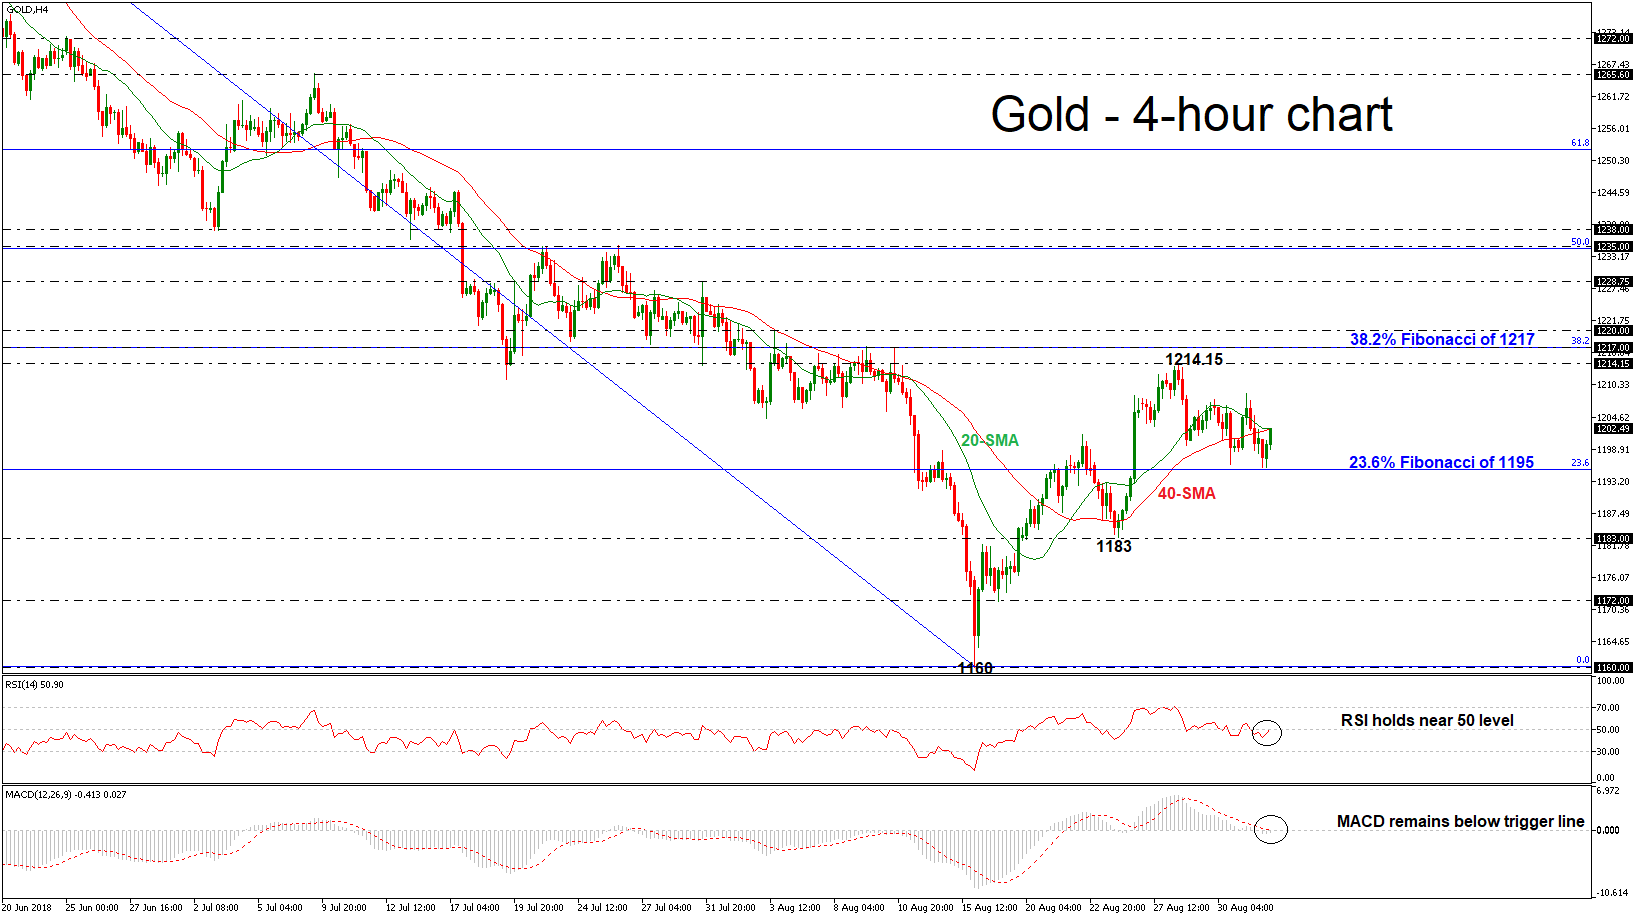
Gold has found significant support on the 23.6% Fibonacci retracement level of the downleg from 1309 to 1160, around 1195, while it started an upward correction after the rebound on 19-month low of 1160. The technical indicators in the 4-hour chart are holding near its neutral levels. The RSI is moving north below the 50 level but the MACD has dropped below its trigger line.
If price action jumps above the 20- and 40-simple moving averages (SMAs), there is scope to test the 1214.15 resistance level, taken from the high on August 28. Clearing this key level would see additional gains towards 38.2% Fibonacci of 1217 and then at the 1220 barrier.
If the 38.2% Fibonacci fails, then the focus would shift to the downside towards the 1183 support level, identified by the low on August 24. If this level is breached, it would increase downside pressures and bring about a continuation of the bearish tendency. From here, the precious metal would be on the path towards the 1172 low.
To conclude, in the daily timeframe the price is hovering within the moving averages, which are creating a negatively aligned channel, while looking at the bigger picture gold recorded five consecutive negative months.
Sterling Gaps Down Amid Brexit Rhetoric, UK Manufacturing PMI Due With Trade Angst In The Background
Here are the latest developments in global markets:
FOREX: The dollar was nearly flat against a basket of six major currencies on Monday (-0.03%), after posting considerable gains in the previous session. Meanwhile, the British pound opened with a negative gap following some not-so-encouraging Brexit signals over the weekend from both the EU and the UK.
STOCKS: Wall Street closed mixed on Friday, as trade negotiations between the US and Canada ended without an accord. The S&P 500 was practically flat (+0.01%), the Dow Jones pulled back slightly (-0.09%), while the Nasdaq Composite edged higher (+0.26%) – flirting with its record highs. US markets will remain closed today in celebration of the Labor Day holiday. Meanwhile, Asia was a sea of red on Monday, with sentiment appearing fragile amid concerns the US-China trade standoff may escalate further this week. In Japan, the Nikkei 225 and the Topix fell by 0.69% and 0.87% respectively, while in Hong Kong, the Hang Seng dropped by 0.80%. In Europe, futures tracking the major indices were mixed, though most were close to neutral territory. The exception was the UK's FTSE 100, which was set to open higher amid a drop in the pound.
COMMODITIES: Oil prices were mixed on Monday. While WTI was lower by 0.24% at $69.67 per barrel, Brent was up by 0.17%, trading at $77.80/barrel. Both benchmarks ended lower on Friday, albeit only modestly so. The Baker Hughes oil rig count showed its first increase in three weeks on Friday, bringing back to the forefront the narrative that US production is increasing. Meanwhile, worries around the impact of a potential US-China trade war continued to cloud the outlook for oil demand. In precious metals, gold prices were little changed on Monday, trading marginally above the $1,200 per troy ounce handle.
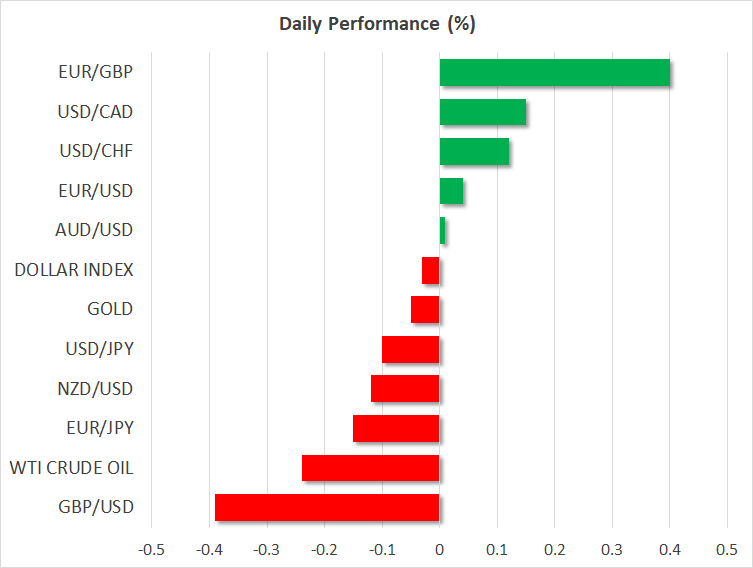
Major movers: Sterling gaps lower on Brexit worries; dollar bounces
The British pound opened with a gap lower this week amid renewed Brexit worries, following some remarks over the weekend from EU chief negotiator Michel Barnier, as well as UK PM Theresa May. Barnier, who was responsible for the pound's surge last week after he said the EU is willing to provide the UK with a special deal, toughened his rhetoric – indicating on Sunday that he is 'strongly opposed” to May's proposals on trade. Separately, writing in the Telegraph, PM May ruled out the prospect of a second Brexit referendum.
To be fair, this was hardly a surprise, as she has repeatedly rejected such calls in the past. Still, combined with Barnier's apparent reversal and the continued lack of progress in the talks, it was enough to dispel some optimism and push sterling lower. The road for the pound will probably remain bumpy as the negotiations enter their final stretch in the coming weeks, with any sustained rallies appearing unlikely until – and if – a deal is seen as being near its completion.
Meanwhile, the dollar edged up on Friday, without any clear catalyst behind the move. Instead, the currency's gains appear to have been driven by month-end flows as the European trading session was drawing to a close. Elsewhere, NAFTA talks between the US and Canada ended without an agreement on Friday, sending the loonie lower. Talks will resume on Wednesday, with the loonie's short-term direction likely to hang in the balance.
Staying on trade, the US-China standoff seems set to heat up again later this week. The Trump administration may proceed with imposing tariffs on $200bn worth of Chinese goods it has threatened as early as on Thursday, potentially escalating the situation further. China has previously said it would retaliate to such a move, and if so, risk appetite may take a hit, leading investors to divert funds away from 'risky” assets and into safer ones, such as the Japanese yen.
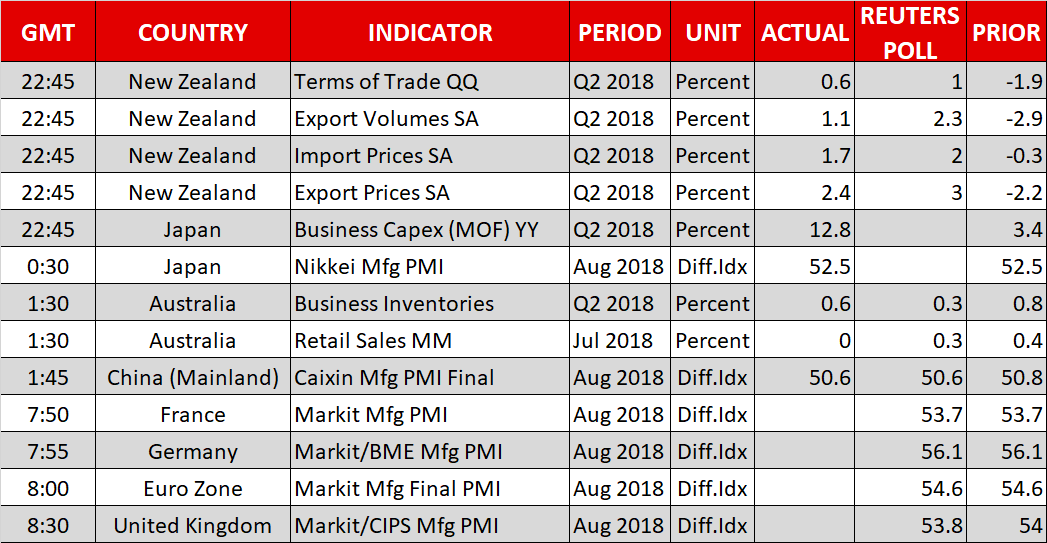
Day ahead: Eurozone and UK on receiving end of manufacturing PMI numbers; trade remains in focus
Monday's calendar is relatively light, with US markets being closed for Labor Day. Among the few data points are manufacturing PMI figures out of the eurozone and the UK. Most attention though, is expected to remain on issues such as trade rather than on any releases.
The eurozone's final manufacturing PMI print for August is due at 0800 GMT, with the reading anticipated to be confirmed at 54.6, its lowest since November 2016; trade fears are partially to blame for the fall in the measure. Germany and France, the eurozone's two largest economies, will see the release of their respective manufacturing PMI numbers at 0755 GMT and 0750 GMT correspondingly.
At 0830 GMT, the UK's manufacturing PMI for August will be hitting the markets. The gauge is projected to ease to 53.8 from July's 54.0. If expectations materialize, this would be the lowest since late 2016; the index touched the same multi-month low level in April this year. Unlike the eurozone, the UK sees only one and final PMI release, something which might render the British currency more sensitive to the data. Lastly, the nation's PMI figures for construction and the all-important services sector are due on Tuesday and Wednesday respectively.
Meanwhile, trade remains a dominant theme in markets, with the odds for further escalation in Sino-US relationships on the front being on the rise, especially after last week's comments by President Trump signaling readiness to push forward with additional tariffs as soon as the current week. Additionally, last week's discussions between Canada and the US on forging a new North American trade pact weren't fruitful. As a result, Trump notified Congress that he intends to proceed with a bilateral deal with Mexico.
Brexit also looms large in the background, with sterling expected to be sensitive on any updates and commentary on the issue.
Chicago Fed President Charles Evans – a non-voting FOMC member in 2018 – will be participating in a panel discussion before the Central Bank of Argentina's 'Dealing with Monetary Policy Normalization” Money and Banking Conference at 1830 GMT.
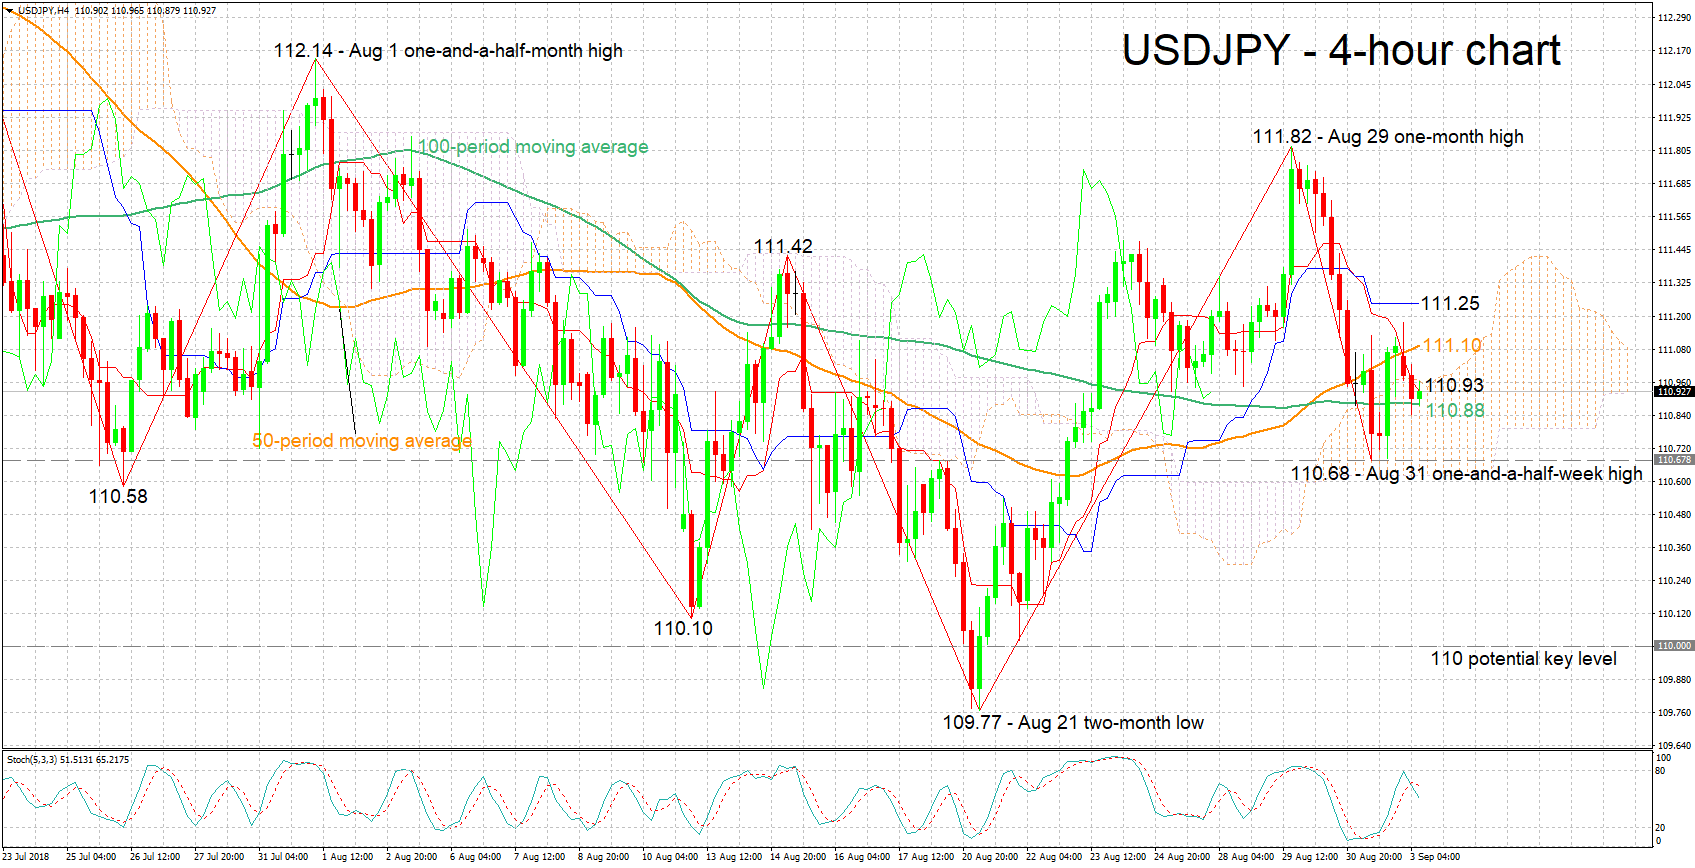
Technical Analysis: USDJPY looking bearish in short-term with negative momentum easing
USDJPY is trading roughly 90 pips below last week's one-month high of 111.82. The Tenkan-sen and Kijun-sen lines are negatively aligned in support of a bearish short-term picture. Notice though that the Kijun-sen has flatlined, the implication being that negative momentum is weakening. The stochastics, however, are giving a bearish signal in the very short-term as the %K line has moved below the slow %D one.
Rising trade tensions are likely to divert funds to the safe-haven perceived yen, pushing USDJPY lower. Given a move below the 100-period moving average at 110.88, support to declines may come around Friday's one-and-a-half-week low of 110.68, including the Ichimoku cloud bottom at 110.62. Further below, the 110 round figure would increasingly come into scope.
Conversely, easing trade fears may push the pair higher. Immediate resistance seems to be taking place around the current level of the Tenkan-sen at 110.93 and the Ichimoku cloud top at 110.97. Not far above lies the 50-period MA at 111.10 and the Kijun-sen at 111.25. Steeper gains would turn the attention to the zone around the one-month high of 111.82 from last week, including the 112 handle.
UK PMI manufacturing dropped to 25-month low, no support to economy in Q3
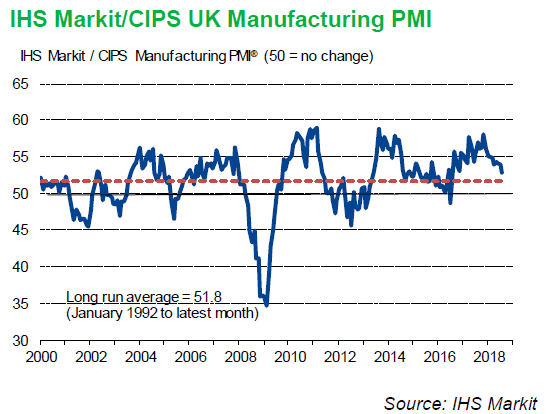
UK PMI manufacturing dropped to 52.8 in August, down from 53.8 and missed expectation of 53.9. That's also the lowest level in 25 months. Markit noted that job creation slowed to "near-stagnation" and business optimism dipped to 22-month low.
Rob Dobson, Director at IHS Markit, which compiles the survey:
"The performance of the UK manufacturing sector looked increasingly lacklustre in August. The headline PMI fell to its lowest level for over two years, as growth of output and new orders slowed and the pace of job creation slumped to near-stagnation. Based on its historical relationship with official ONS data, the latest PMI report is broadly consistent with zero growth in manufacturing production, meaning the sector will likely fail to provide any support to the wider UK economy in the third quarter.
"Although slower growth of domestic demand contributed to manufacturing's weak performance, the main constraint was the trend in new export business. Foreign demand declined for the first time since April 2016, despite the weakness of sterling, amid reports of slower global economic growth and the increasingly uncertain trading environment. Inflows of new work from both domestic and overseas sources will need to strengthen if manufacturing is to show renewed vigour in the coming months.
"Looking ahead, manufacturers' optimism about the outlook for the year ahead has been receding in recent months and is now at a 22-month low. While a hoped-for improvement in new export order growth and new product launches are forecast to stimulate future expansion, manufacturers are also expressing rising concerns about the uncertain backdrop of Brexit."
Eurozone PMI manufacturing: Business optimism dampened by trade war, tariffs and Brexit
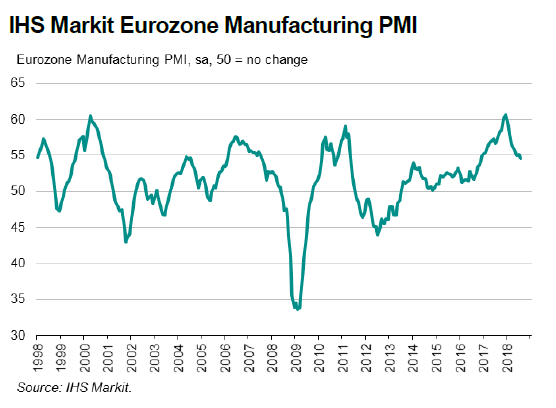
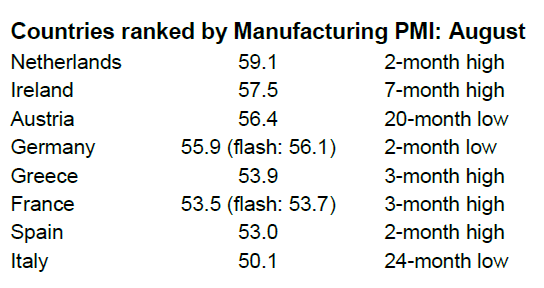
Eurozone PMI manufacturing was finalized at 54.6 in August, unrevised. It's -0.5 lower than July's final reading at 55.1. Among the countries, the Netherlands scored 59.1 and hit a 2-month high. Ireland record 57.5 and hit a 7-month high. German PMI manufacturing was revised down by -0.2 to 55.9 and hit a 2-month low. France PMI manufacturing was revised down by -0.2 to 53.5 but still hit a 3 month high. Italy PMI manufacturing dropped to 50.1, down by -1.4 and hit 24-month low.
Commenting on the final Manufacturing PMI data, Chris Williamson, Chief Business Economist at IHS Markit said:
"Eurozone factories reported a further solid production gain in August, but prospects dimmed further as growth of new orders hit a two-year low and worries about the outlook deepened.
"The slowdown in demand compared to the surging pace of expansion seen earlier in the year is being driven primarily by export orders rising at the slowest rate for nearly two years. Some of the slowdown in exports can be attributed to the appreciation of the euro since earlier in the year, but companies are also reporting signs of demand cooling and risk aversion intensifying.
"Worries about trade wars and the damaging impact of tariffs, as well as Brexit and other political worries, all contributed to a dampening of business optimism about the year ahead. Business expectations were the second-lowest since November 2015.
"In this environment, it was not surprising to see job creation slip to the lowest for one and-a-half years, albeit remaining relatively robust.
"One positive was a cooling of price pressures, which fed through to the smallest rise in factory selling prices for a year and could help bring consumer inflation down in coming months."
EUR/JPY Daily Outlook
Daily Pivots: (S1) 128.39; (P) 129.11; (R1) 129.67; More....
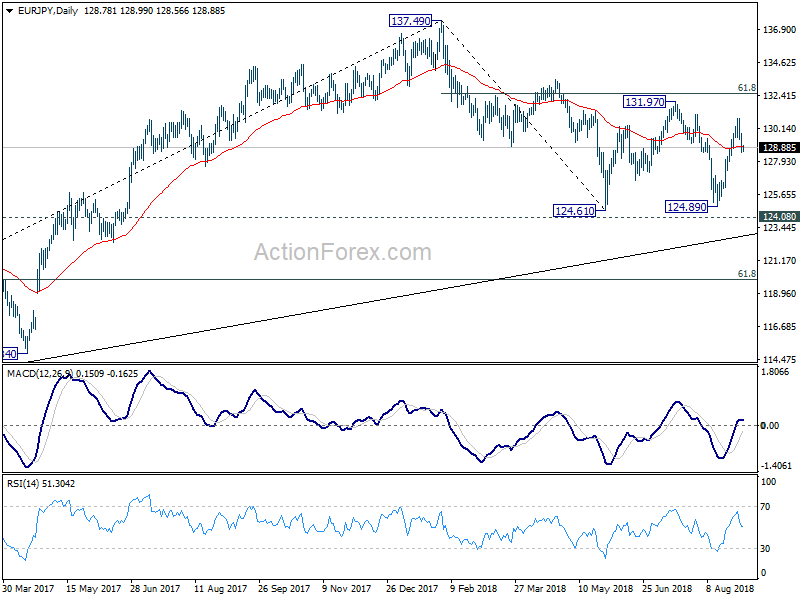
Focus in EUR/JPY remains on 38.2% retracement of 124.89 to 130.86 at 128.57. As long as 128.57 holds, another rise is still mildly in favor. On the upside, above 129.83 minor resistance will turn bias back to the upside for 130.86 first and then resistance zone between 131.97 and 61.8% retracement of 137.49 to 124.61 at 132.56. However, firm break of 128.57 will argue that rebound from 124.89 has completed, and it's the third leg of consolidation pattern from 124.61. In that case, intraday bias will be turned back to the downside for 124.61/89.
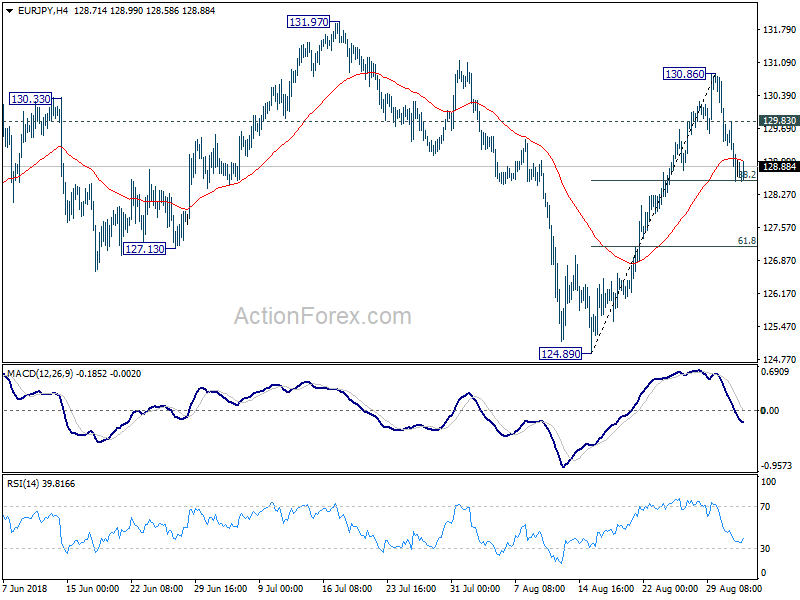
In the bigger picture, EUR/JPY once again rebounded ahead of 124.08 key resistance turned support. It's also held well above long term trend line from 109.03 (2016 low). The development argues that such rise from 109.03 might not be over yet. Decisive break of 61.8% retracement of 137.49 to 124.61 at 132.56 will pave the way to retest 137.49 high. But, firm break of 124.08 will argue that whole rise from 109.03 (2016 low) has completed at 137.49. Deeper decline would be seen to 61.8% retracement of 109.03 to 137.49 at 119.90 next.
GBPUSD Outlook: Risk Of Deeper Pullback On Break Below 1.2897 Fibo Support
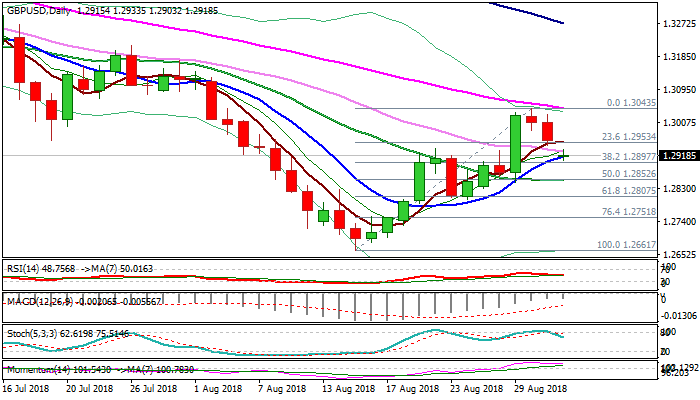
Cable stands at the back foot and pressures key support at 1.2897 (Fibo 38.2% of 1.2661/1.3043 rally), following two-day pullback from last week's recovery high at 1.3043 and Monday's gap-lower opening. Near-term bulls are running out of steam as strong bullish momentum started to ease and slow stochastic continues to trend lower following reversal from overbought territory. Confirmation of reversal needs close below Fibo support at 1.2897 to trigger deeper pullback and expose next strong support at 1.2852 (20SMA/50% retracement). The pair looks for further signals from today's release of UK Manufacturing PMI (Aug f/c 53.9 vs 54.0 prev).
Res: 1.2928, 1.3000, 1.3028, 1.3045
Sup: 1.2897, 1.2852, 1.2807, 1.2751
EUR/AUD Daily Outlook
Daily Pivots: (S1) 1.6065; (P) 1.6115; (R1) 1.6180; More....
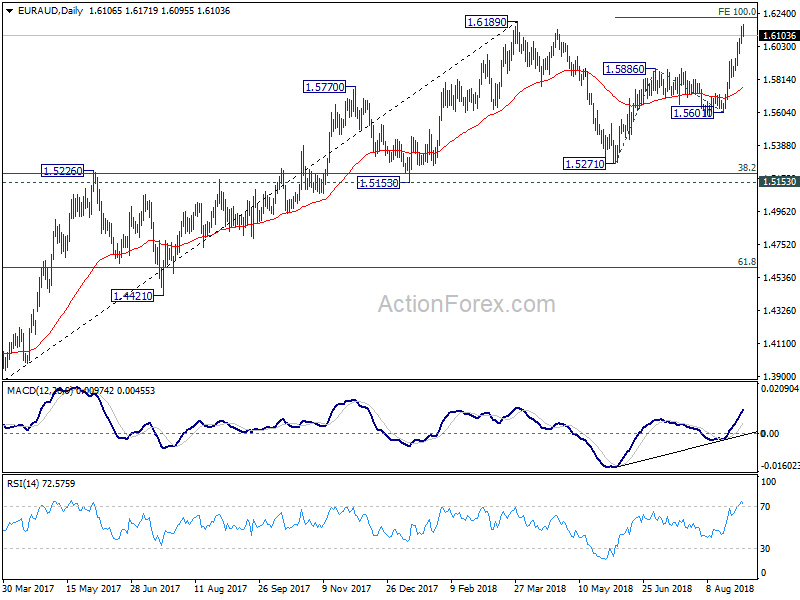
EUR/AUD is losing some upside momentum as seen in 4 hour MACD. But further rise is still expected as long as 1.5983 minor support holds. Current rally should target 100% projection of 1.5271 to 1.5886 from 1.5601 at 1.6216, which is close to 1.6189 high. Upside could be limited there on initial attempt to bring consolidation. On the downside, break of 1.5983 support is needed to indicate short term topping. Otherwise, further rise will remain in favor in case of retreat.
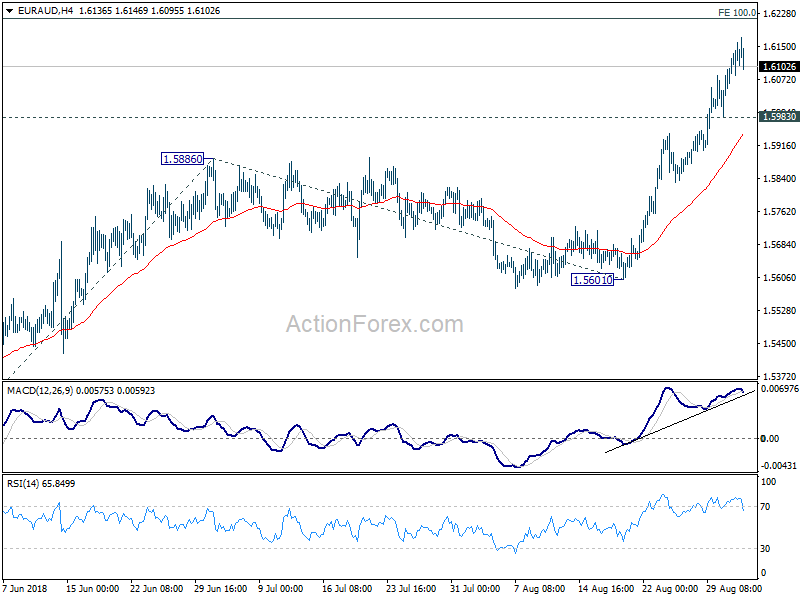
In the bigger picture, EUR/AUD drew strong support from 55 week EMA and rebounded. And the development argues that medium term rally from 1.3624 (2017 low) is still in progress. Firm break of 1.6189 will target a test on 1.6587 (2015 high). On the downside, break of 1.5601 support will now be the first sign of medium term reversal, and will bring a test on 1.5271 key support for confirmation.