Sample Category Title
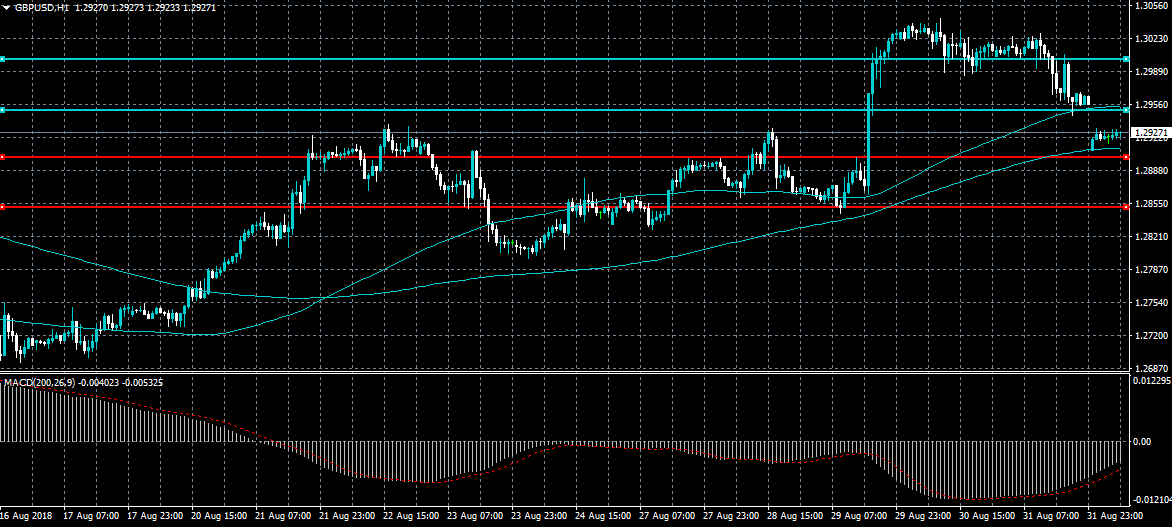
USD/CAD The Bias Remains Bullish
Pivot (invalidation): 1.3030
Our preference Long positions above 1.3030 with targets at 1.3090 & 1.3125 in extension.
Alternative scenario Below 1.3030 look for further downside with 1.2990 & 1.2965 as targets.
Comment A support base at 1.3030 has formed and has allowed for a temporary stabilisation.
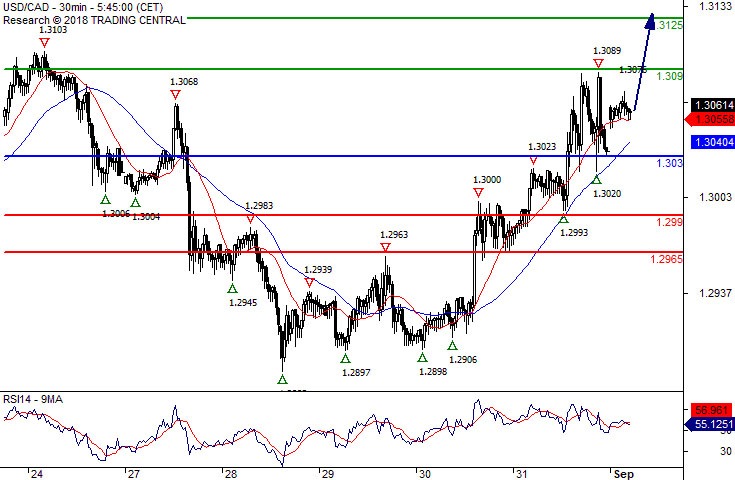
USD/CHF The Upside Prevails
Pivot (invalidation): 0.9675
Our preference Long positions above 0.9675 with targets at 0.9715 & 0.9740 in extension.
Alternative scenario Below 0.9675 look for further downside with 0.9655 & 0.9640 as targets.
Comment The RSI is bullish and calls for further upside.
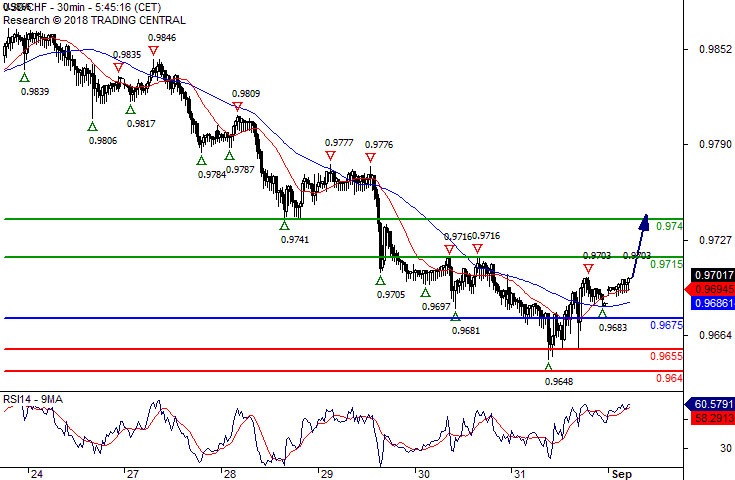
USD/JPY Turning Down
Pivot (invalidation): 111.05
Our preference Short positions below 111.05 with targets at 110.85 & 110.65 in extension.
Alternative scenario Above 111.05 look for further upside with 111.20 & 111.35 as targets.
Comment A break below 110.85 would trigger a drop towards 110.65.
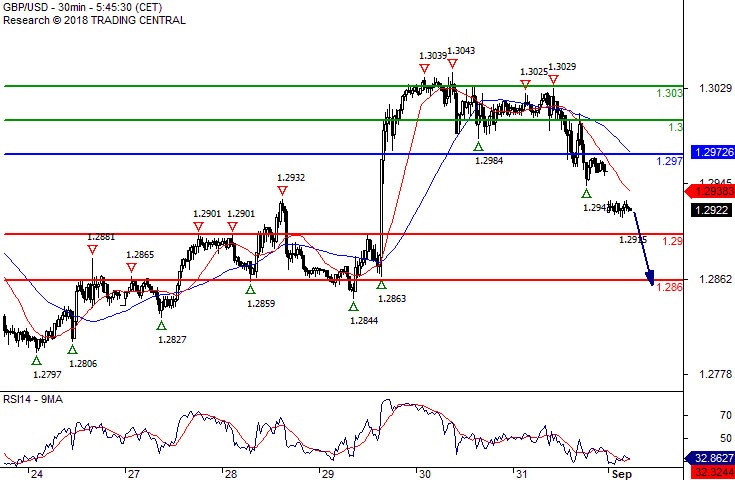
GBP/USD The Downside Prevails
Pivot (invalidation): 1.2970
Our preference Short positions below 1.2970 with targets at 1.2900 & 1.2860 in extension.
Alternative scenario Above 1.2970 look for further upside with 1.3000 & 1.3030 as targets.
Comment The RSI is bearish and calls for further decline.
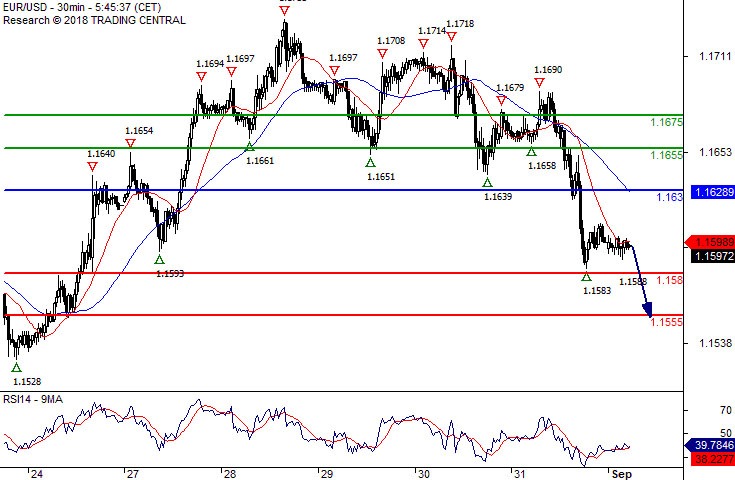
EUR/USD 1.1580 Expected
Pivot (invalidation): 1.1630
Our preference Short positions below 1.1630 with targets at 1.1580 & 1.1555 in extension.
Alternative scenario Above 1.1630 look for further upside with 1.1655 & 1.1675 as targets.
Comment A break below 1.1580 would trigger a drop towards 1.1555.
USDTRY Outlook: Soaring Inflation Keeps Lira Under Pressure, CBRT Policy Meeting In Focus
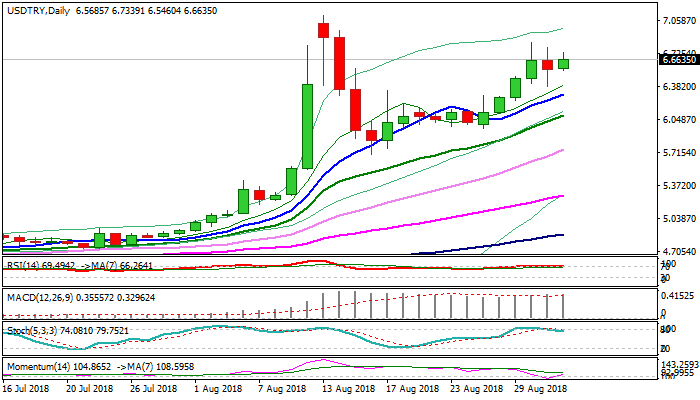
Turkish lira hit session low at 6.7339 in early Monday's trading as release of CPI data showed Turkish inflation rose further in August and hit the highest in 15 years at 17.9%, overshooting forecast at 15.85%.
Lira managed to recover part of post-data losses on subsequent bounce to 6.60, but remains under strong pressure on surging inflation and concerns about the action of the CBRT which meets on 13 Sep.
The central bank needs to make significant rate hike in order to tackle soaring inflation and stabilize the national currency.
Otherwise, the lira may fall to Fibo projection at 7.4425 and psychological 7.50 level, if the central bank fails to act accordingly.
Technical studies remain supportive, as weeklies maintain strong momentum and previous week's strong bullish close completed reversal pattern of 7.1043/5.6875 pullback, while fresh bullish momentum is building on daily chart.
However, reversal of daily slow stochastic / RSI from overbought territory suggest the USDTRY pair may hold in consolidative mode for some time, awaiting fresh signals from the CB's policy meeting.
Sideways-moving daily Tenkan-sen marks initial support at 6.3993, followed by rising 10SMA 6.30, which is expected to contain dips and guard pivots at 6.0833 (rising 20SMA) and 5.9607 (27 Aug trough).
Res: 6.7339, 6.7837, 6.8379, 6.9577
Sup: 6.6033, 6.5460, 6.3993, 6.3000
GBP/USD Regular Or A Runaway Gap?
The GBP/USD has formed a retail gap after some Brexit comments during the weekend. The problem is that the gap is still open and we don’t know if it is the regular or a runaway gap. However, the channel is still inclined to the upside and 1.2890-96 zone is crucial. A close below should target 1.2837, while the rejection from the zone could close the gap. Bullish continuation is possible only above 1.3015 while bearish should be dominating below 1.2837.
W L3 - Weekly Camarilla Pivot (Weekly Interim Support)
W H3 - Weekly Camarilla Pivot (Weekly Interim Resistance)
W H4 - Weekly Camarilla Pivot (Strong Weekly Resistance)
M H4 - Monthly Camarilla Pivot (Very Strong Monthly Resistance)
M L3 – Monthly Camarilla Pivot (Monthly Support)
M L4 – Monthly H4 Camarilla (Very Strong Monthly Support)
POC - Point Of Confluence (The zone where we expect the price to react - aka the entry zone)

EURUSD Fails To Post Strong Bullish Correction, Stands Around 40-SMA
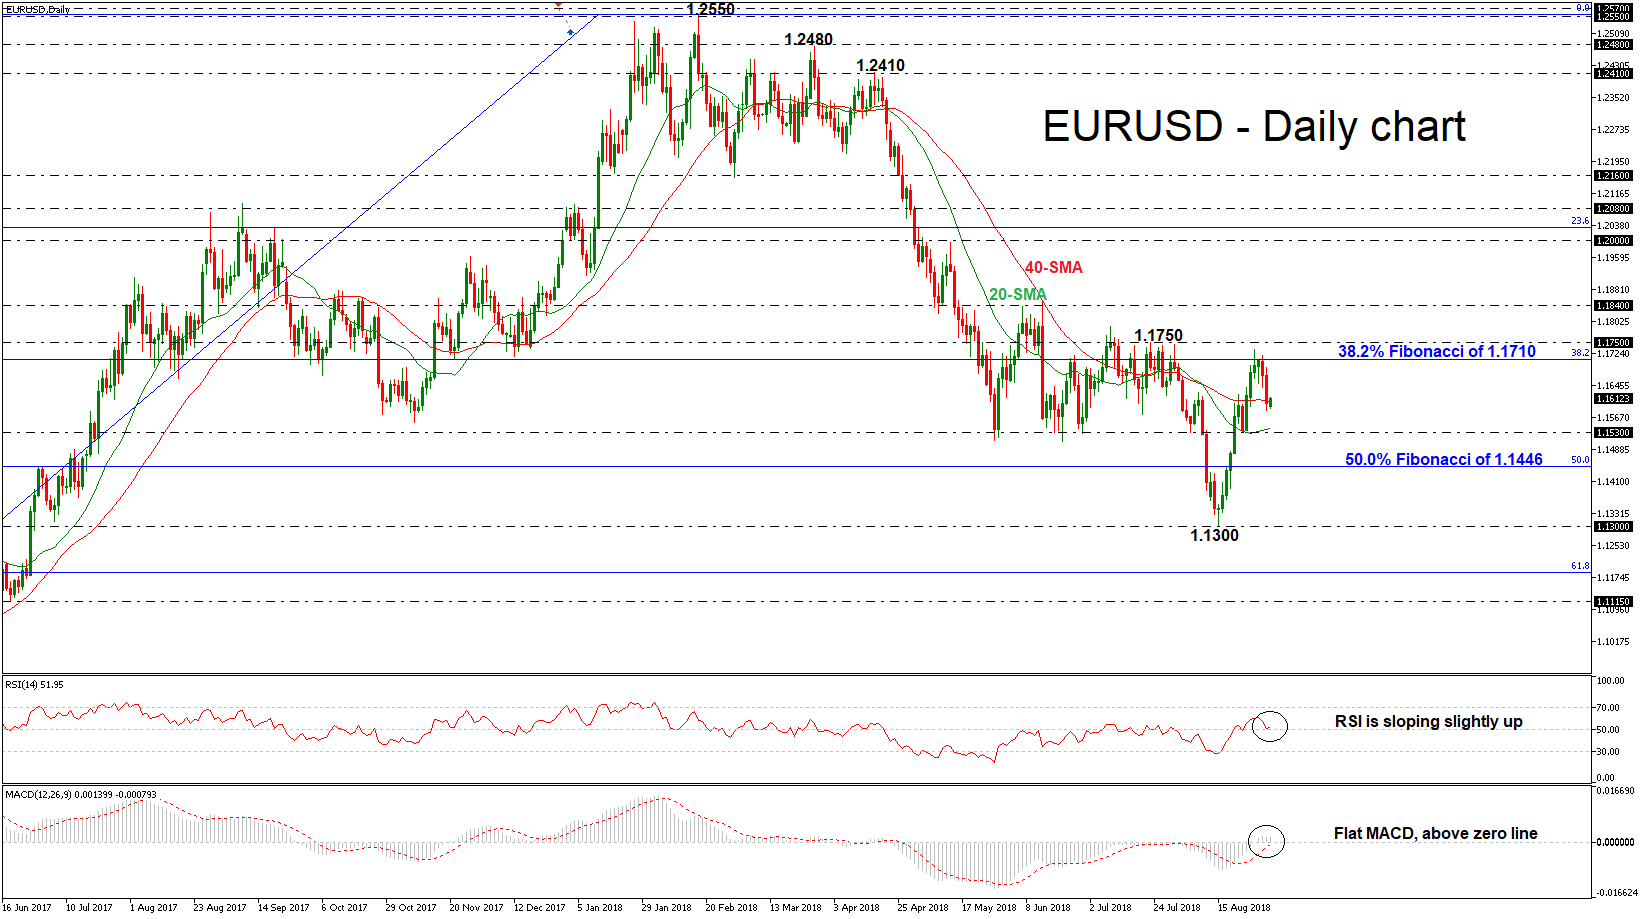
EURUSD lost significant momentum over the previous couple of days after the pullback on the 38.2% Fibonacci retracement level of the upleg from 1.0340 to 1.2550, around 1.1710. The world’s most traded currency is hovering near the 40-day simple moving average (SMA), while the technical indicators are still holding in the positive territory.
In the short-term the RSI indicator is sloping slightly to the upside with weak momentum and the MACD oscillator is moving sideways above the zero and trigger lines.
In case of further downside pressures, the next level for investors to have in mind is the 1.1530 support level, which stands near the 20-day SMA. Further losses could drive the price until the 50.0% Fibonacci of 1.1446. Moreover, falling below this area there is a stronger barrier at 1.1300, taken from the low on August 15.
However, upside moves are likely to find resistance at the 38.2% Fibonacci of 1.1710 before being able to touch again the 1.1750 hurdle. A jump above this barrier would see a resumption of the bullish correction until the 1.1840 obstacle, where it topped on June 14.
Overall, EURUSD remains under pressure in the longer timeframe as it holds below the moving averages in the weekly chart and failed to surpass the 1.1750 resistance once again.
EURUSD Under Technical Pressure
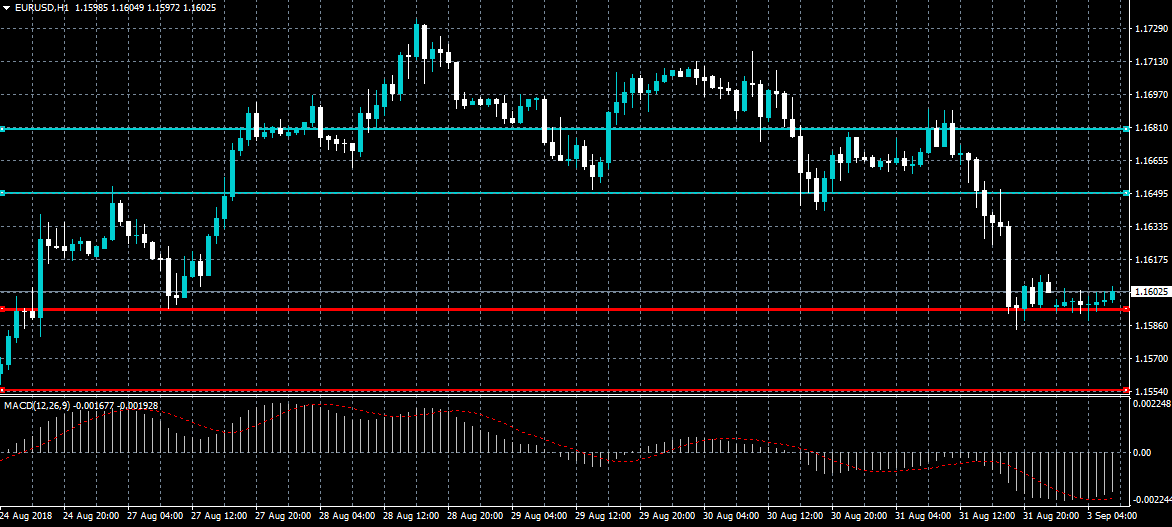
The euro remains under technical selling pressure against the US dollar after the price fell below the 1.1650 level on Friday, triggering the bearish head and shoulders pattern. The EURUSD pair is likely to remain under selling pressure while trading below the neckline of the bearish pattern, at 1.1650. Sellers may now target the 1.1553 level, while buyers will need to stabilize price above the 1.1681 level.
The EURUSD pair is intraday bearish while trading below the 1.1650 level, key support is found at the 1.1553 and 1.1500 levels.
If the EURUSD pair moves above the 1.1650 level, buyers are will likely to test towards the 1.1681 and 1.1713 resistance levels.
GBPUSD On The Defensive Ahead Of Manufaturing Data
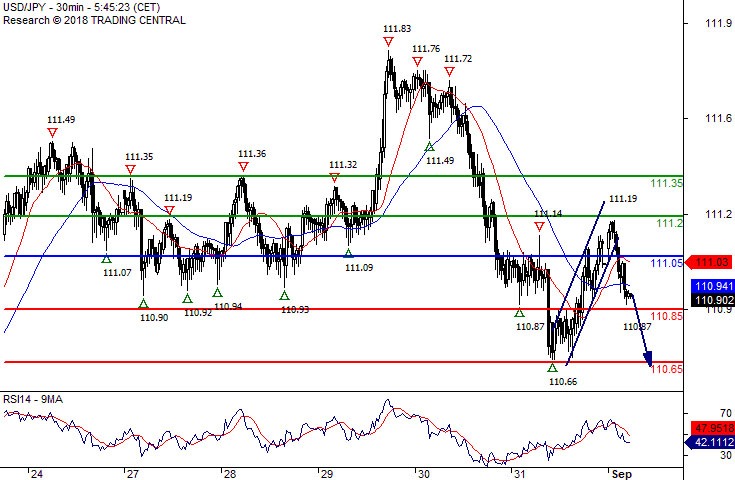
The British pound has dropped towards key support against the US dollar after buyers failed to hold onto the psychological 1.3000 level on Friday. Negative MACD divergence on the daily time frame and reports of a possible leadership challenge to British PM Theresa May are weighing on the GBPUSD pairs intraday sentiment. Sterling traders now await the release of the United Kingdom Manufacturing PMI for the month of August.
The GBPUSD pair is only intraday bullish while trading above the 1.2930 level, key resistance is found at the 1.2950 and 1.3000 levels.
If the GBPUSD pair moves below the 1.2930 level, sellers may test towards the 1.2900 and 1.2850 support levels.