Sample Category Title
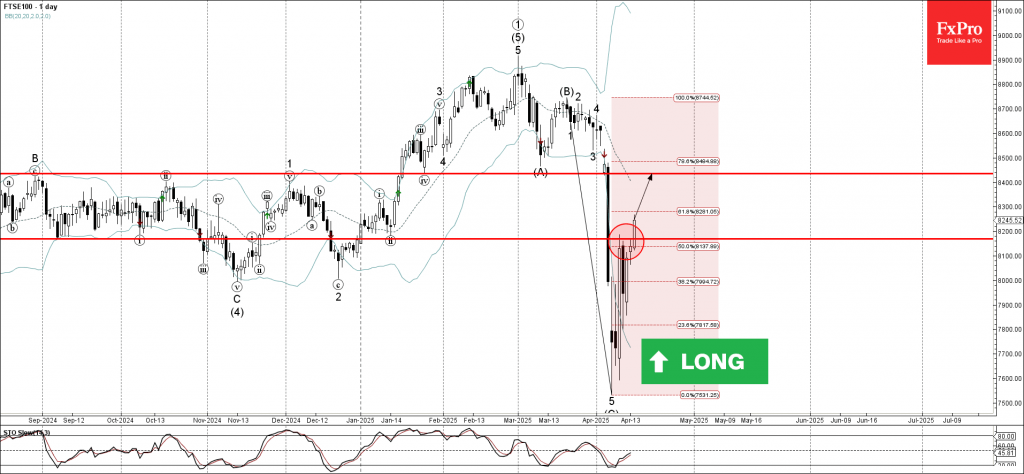
FTSE 100 Wave Analysis
FTSE 100: ⬆️ Buy
- FTSE 100 index broke the resistance zone
- Likely to rise to resistance level 8450.00
FTSE 100 index today broke the resistance zone between the resistance level 8170.00 (which stopped the previous sharp upward correction at the start of this month) and the 50% Fibonacci correction of the sharp downward impulse (C) from March.
The breakout of this resistance zone should accelerate the active primary impulse wave 3 from the start of April.
Given the improving sentiment across the equity markets, FTSE 100 index can be expected to rise to the next resistance level 8450.00, the former support from January and March.
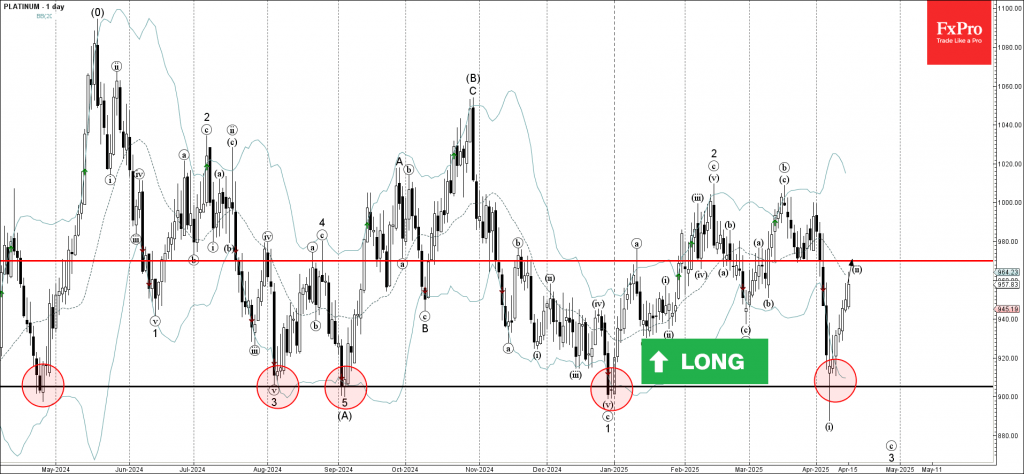
Platinum Wave Analysis
Platinum: ⬆️ Buy
- Platinum reversed from support level 905.00
- Likely to rise to the resistance level 970.00
Platinum recently reversed up from the strong long-term support level 905.00 (which has been reversing the price since April of 2024), standing near the lower daily Bollinger Band.
The upward reversal from the support level 905.00 created the daily Japanese candlesticks reversal pattern Long-legged Doji which stopped the previous impulse wave i.
Platinum can be expected to rise to the next resistance level 970.00 (former support from the end of March, the target price for the completion of the active wave ii).
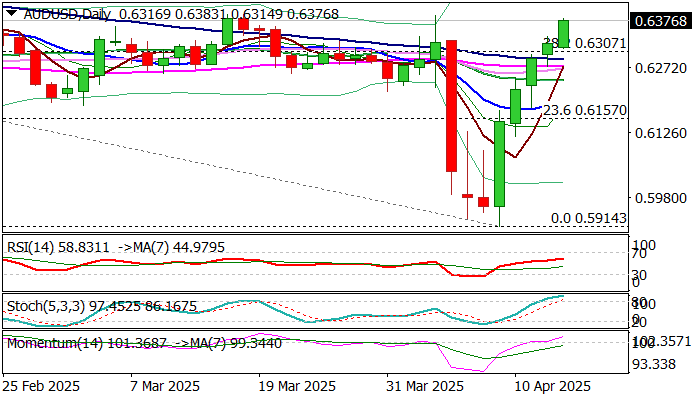
AUD/USD Rallies for the Fifth Straight Day, Eyes Key Barriers
AUDUSD extends steep upleg into fifth straight day and hit two-week high on Tuesday, as weakening US dollar and higher commodity prices continue to underpin Aussie dollar.
Improving technical pictures on daily and weekly charts contribute to bullish outlook (daily MA’s mainly turned to bullish setup and positive momentum is strengthening, while last week’s massive bullish candle formed bullish engulfing pattern and contribute to reversal signal).
Bulls near pivotal barriers at 0.6400 zone (former tops) and Fibo level at 0.6428 (50% retracement of 0.6942/0.5914 bear-leg) break of which to validate signa and open way for further advance.
Caution on overbought daily studies which may slow the rally for consolidation.
Broken Fibo 38.2% and 10DMA (0.6307/0.6290 respectively should contain dips and keep bulls intact.
Res: 0.6400; 0.6428; 0.6481; 0.6500.
Sup: 0.6350; 0.6307; 0.6290; 0.6248.
USDJPY: Japan-U.S Tariff Tensions Persist
JPY Volatility Likely to Stay Elevated
- Japan's top negotiator, Ryosei Akazawa, is heading to Washington to push for the complete removal of U.S. tariffs, especially the 25% auto tariff, which affects a significant pillar of Japan's exports.
- These tariffs have already dented profits for Japanese firms, threatening Japan's growth outlook.
- USDJPY may stay under pressure as:
- Economic uncertainty reduces the likelihood of a BOJ rate hike from April 30th to May 1st.
- The BOJ's dovish tone and stronger U.S. inflation expectations could widen the rate differential again—unless U.S. growth also slows due to trade retaliation.
- Potential play: If tariffs escalate or no progress is made, the JPY could strengthen as risk sentiment sours (safe-haven flows). Conversely, signs of a deal could weaken the JPY as the BOJ stays dovish and growth stabilizes.
USD Outlook Clouded by Tariff Retaliation
- Trump's tariffs on China (145%) and Japan (25% on autos) have sparked retaliation — China raised its tariffs on U.S. goods to 125%.
- Global risk sentiment is fragile; safe-haven USD demand may rise short-term, but long-term confidence in the USD as a store of value is wobbling.
- DXY's reaction will depend on whether trade tensions escalate or de-escalate.
Risk Sentiment & Crosses
- Due to rising global protectionism, broad risk-off moves have hurt AUDUSD, NZDUSD, and emerging market FX.
- Any surprise BOJ rate cut or signs of U.S.-Japan trade progress could create short-term buying opportunities in JPY crosses like AUDJPY and EURJPY.
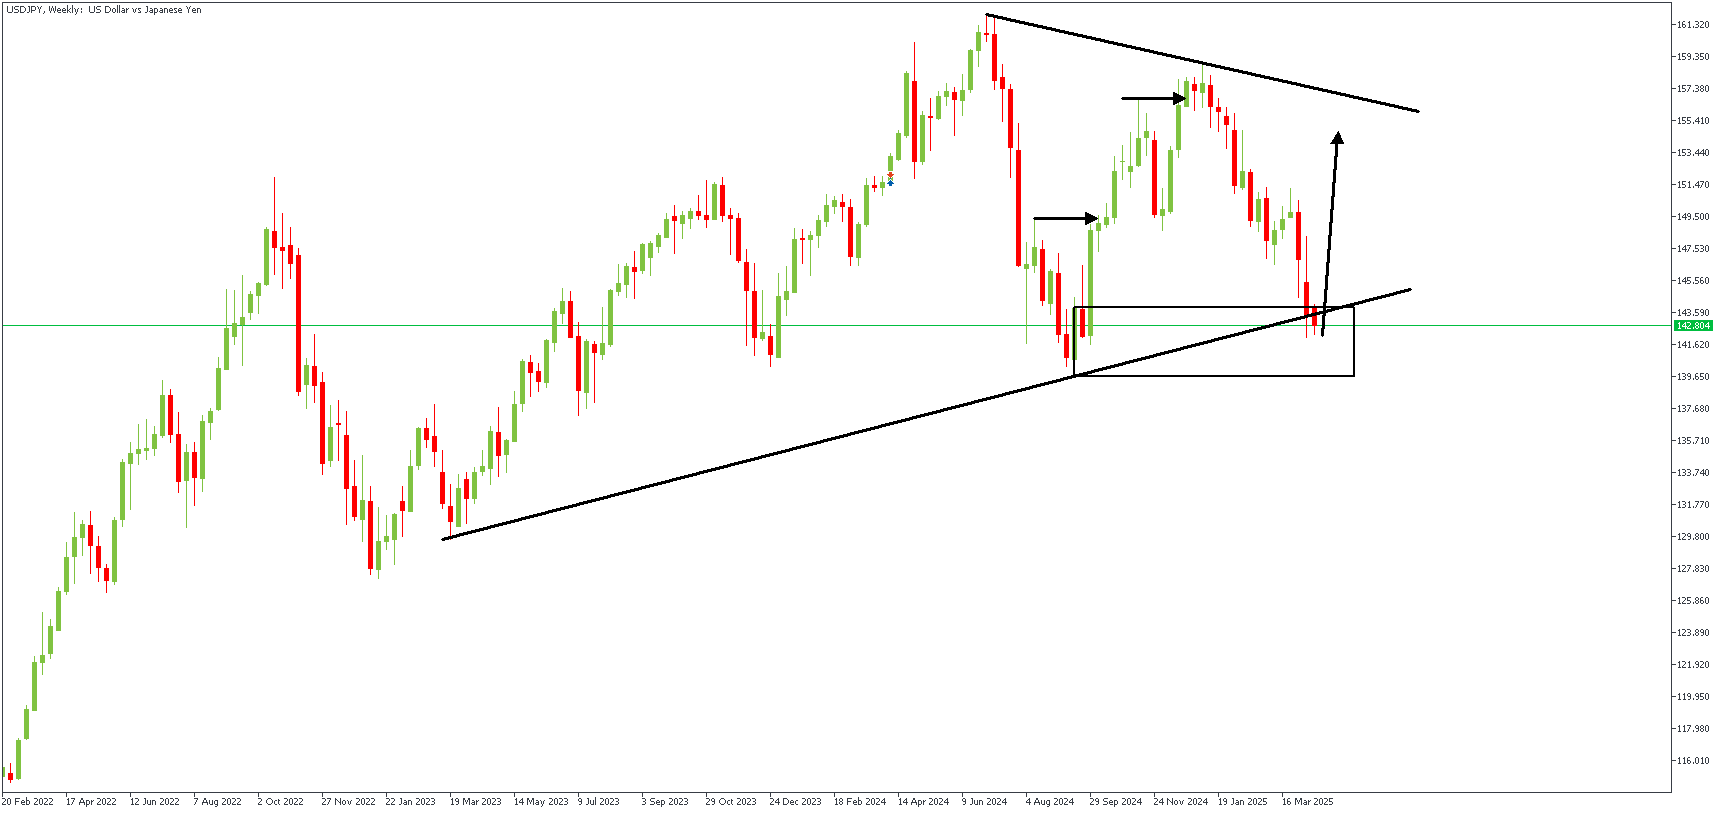
USDJPY – W1 Timeframe
Despite being confined within the wedge pattern, the price action on the weekly timeframe of USDJPY shows signs of a potential reversal from the highlighted demand area. The additional confluence from the trendline support and the internal bullish break of the structure provide a considerable argument in favor of the bullish sentiment.
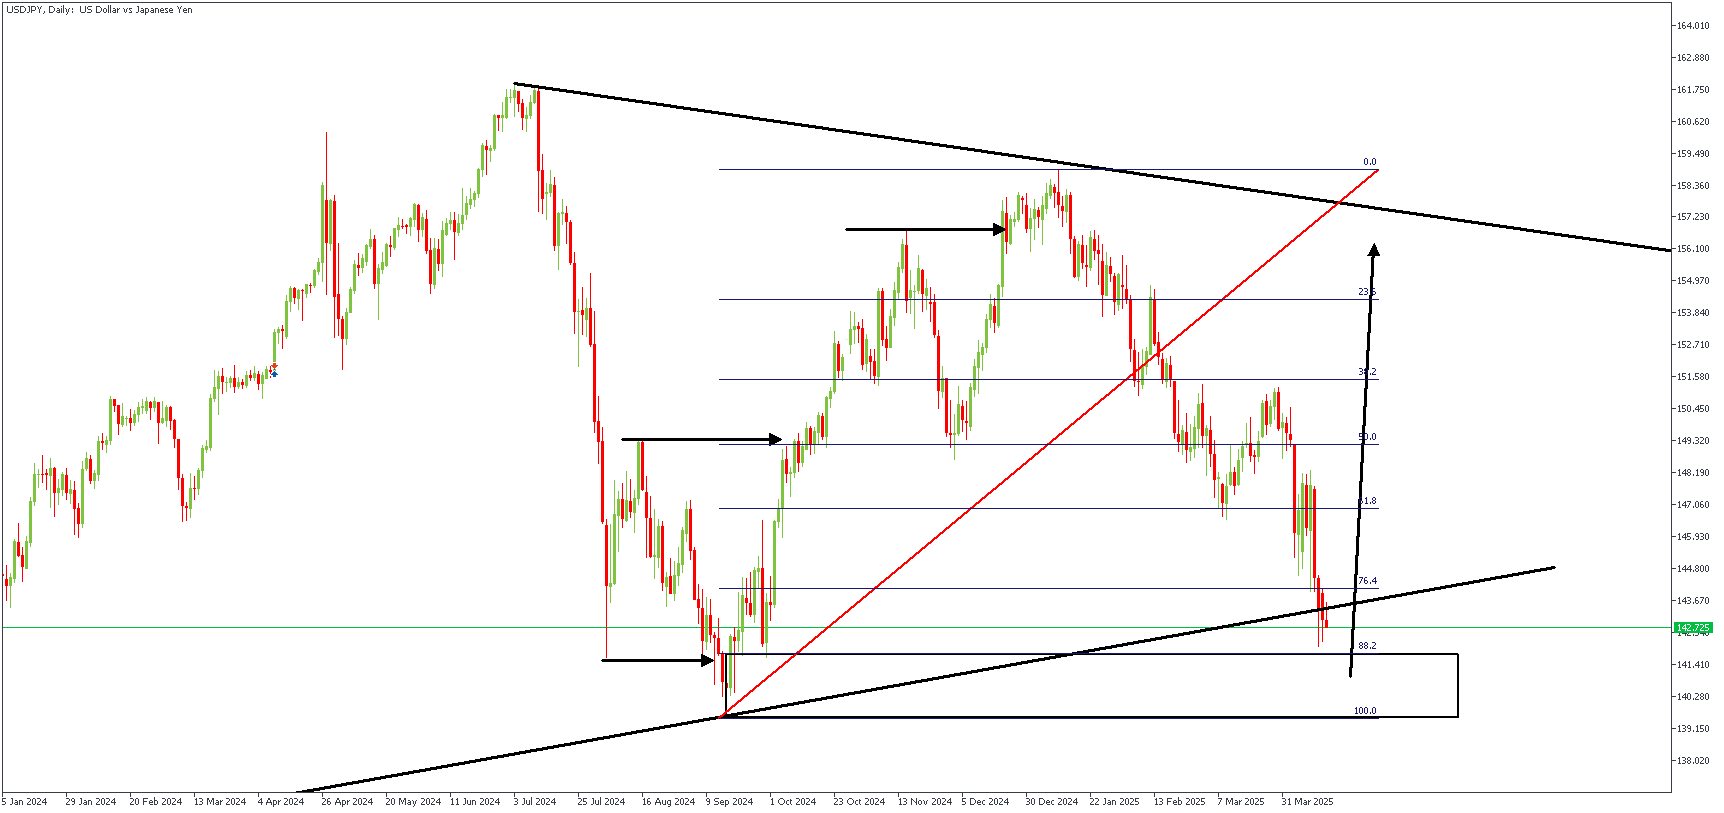
USDJPY – D1 Timeframe
Interestingly, the daily timeframe chart of USDJPY seems to be printing an SBR (Sweep-Break-Retest) pattern. I expect a sweep of liquidity from the previously induced low, after which a bullish reaction from the demand zone would seem inevitable.
Analyst's Expectations:
- Direction: Bullish
- Target- 154.243
- Invalidation- 139.187
Crypto Market Gathers Strength After the Rebound
Market Picture
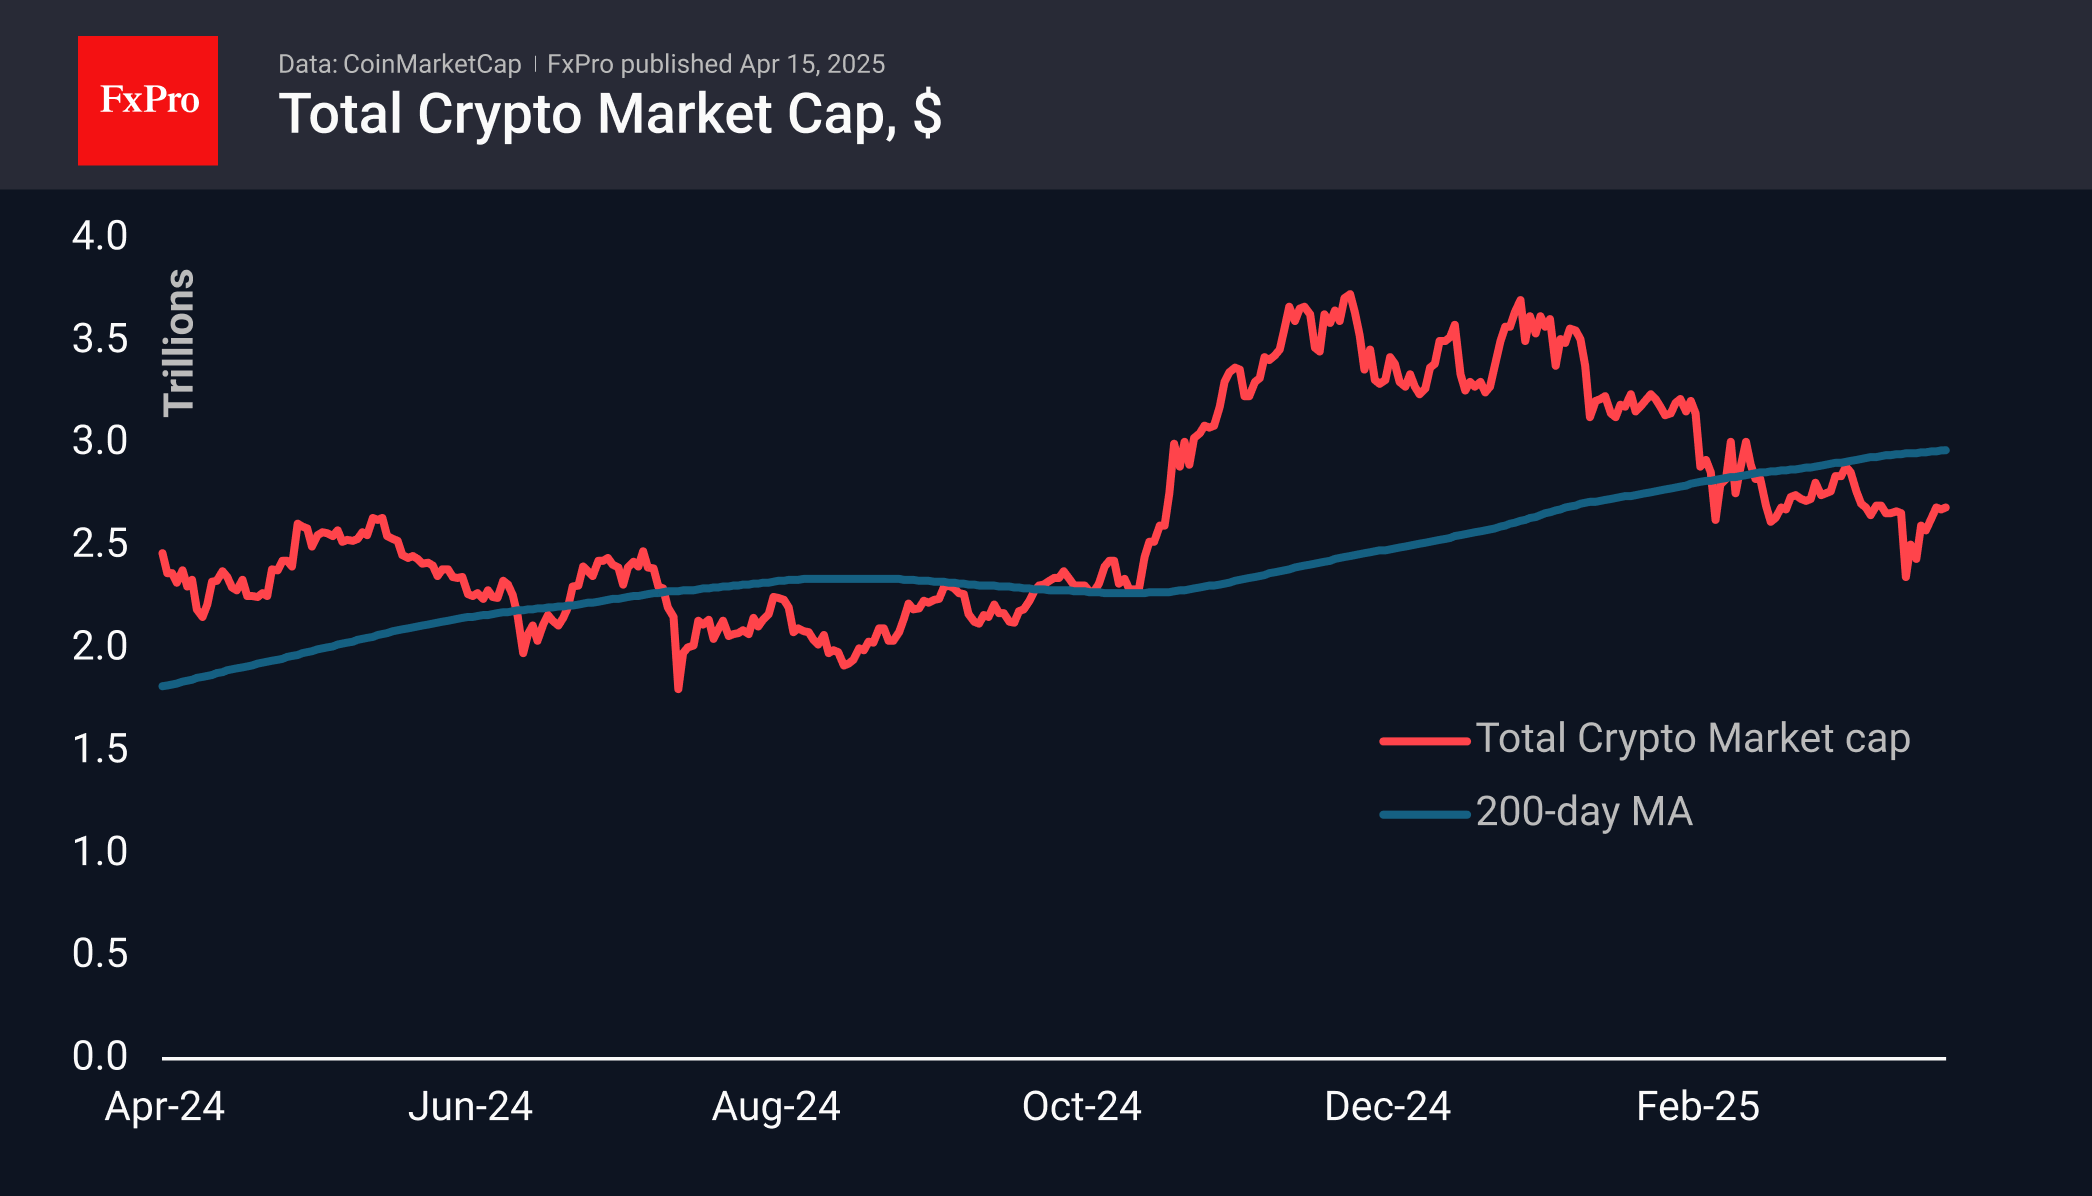
The cryptocurrency market added 8% over 7 days, stabilising at the $2.7 trillion level since Saturday. This is where the market tried to find support in the last days of March before collapsing at the start of April. A move higher could bolster hopes for further gains, but these expectations will only be confirmed after a solid consolidation above the 200-day moving average, which is now near $2.97 trillion.
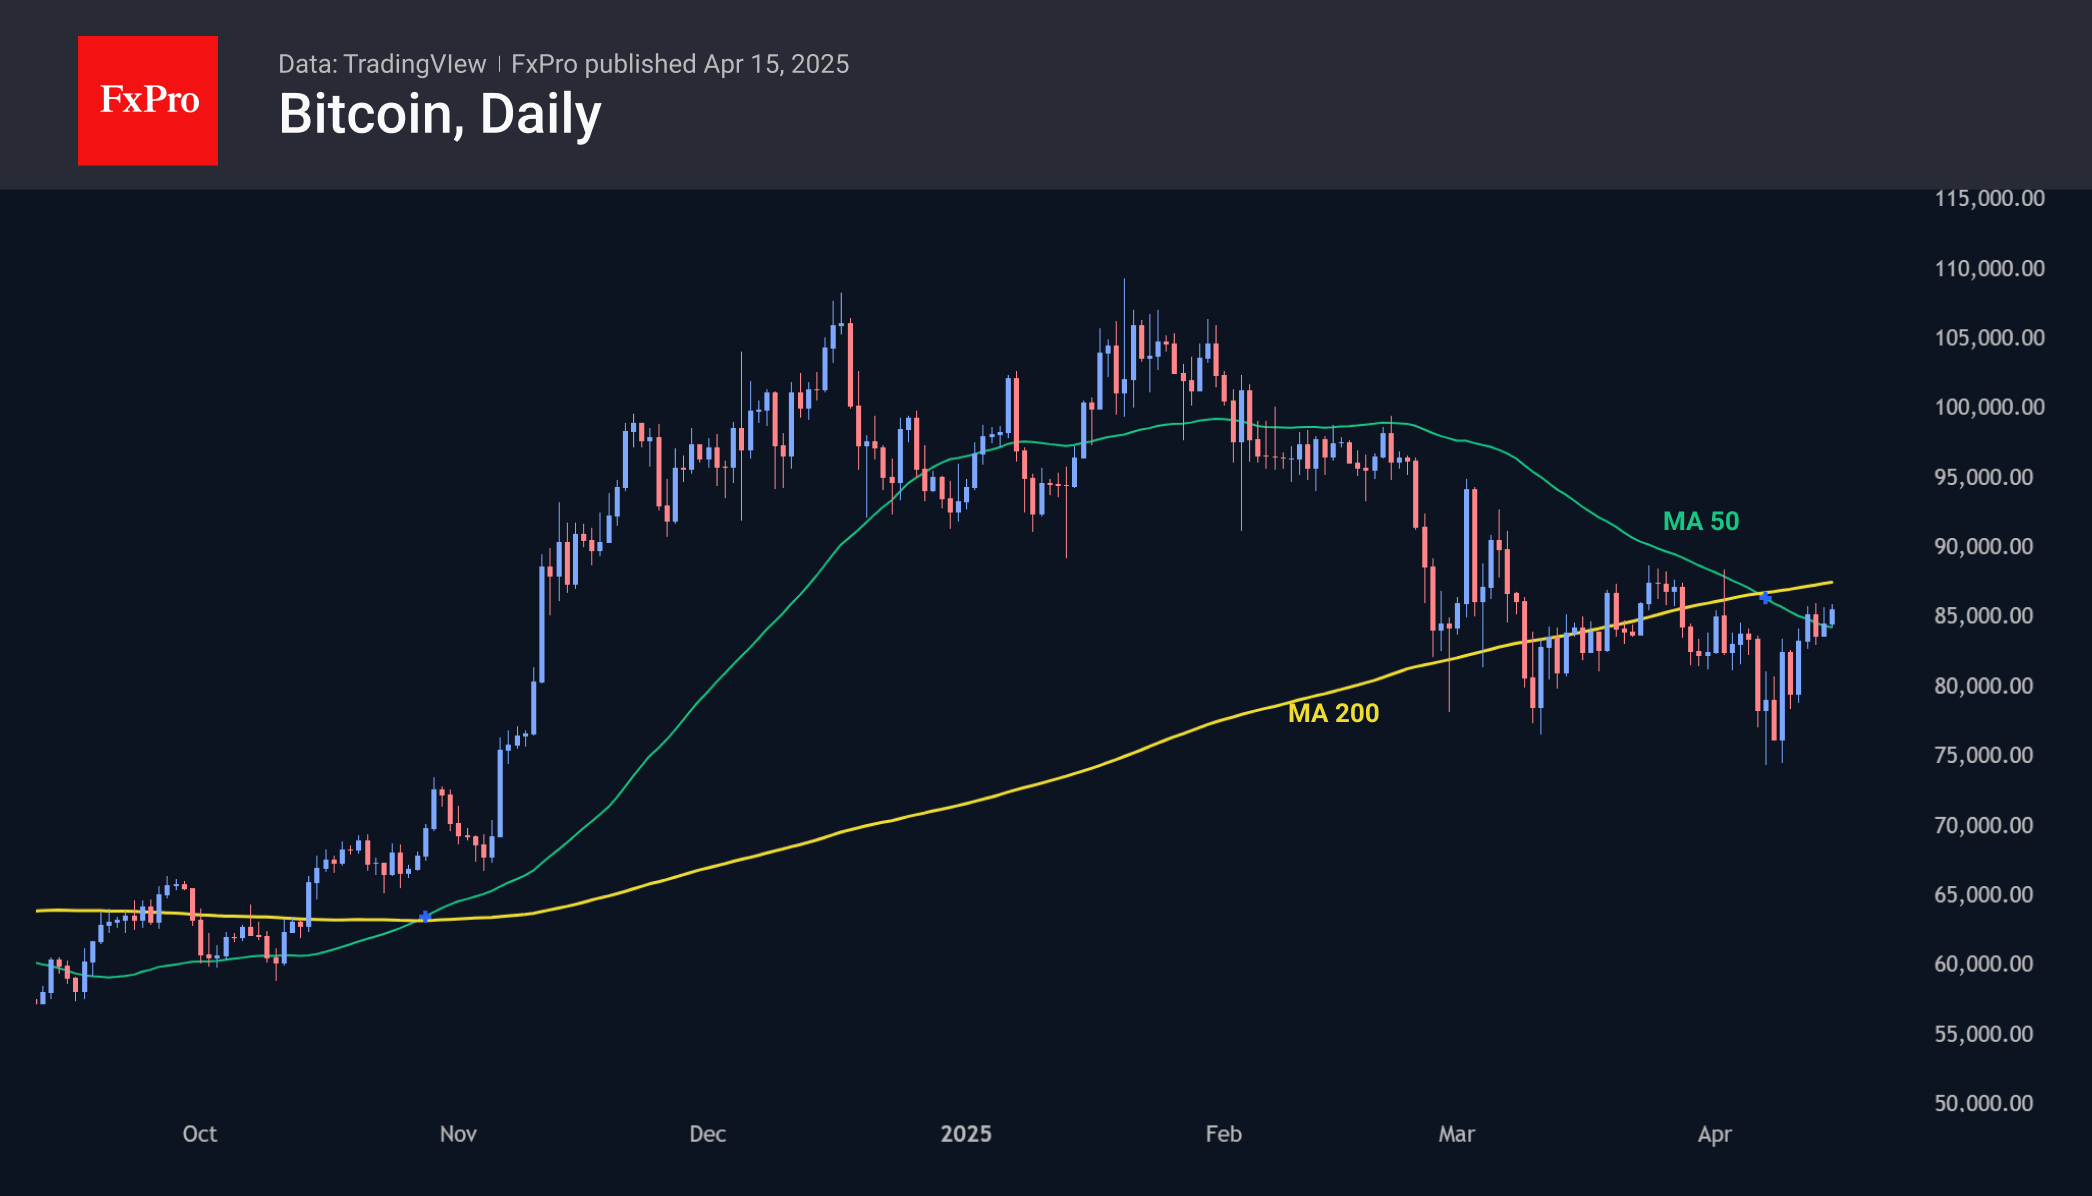
Bitcoin continues its cautious rise, trading above its 50-day moving average and reaching $85.7K. This is an important technical attempt to reverse the downtrend. Interestingly, the 200-day average is quite close, so a second confirmation of a trend change could come quite quickly. However, from a pessimistic point of view, it is worth noting that bitcoin has entered a resistance accumulation zone where the strength of the initial rebound may fade.
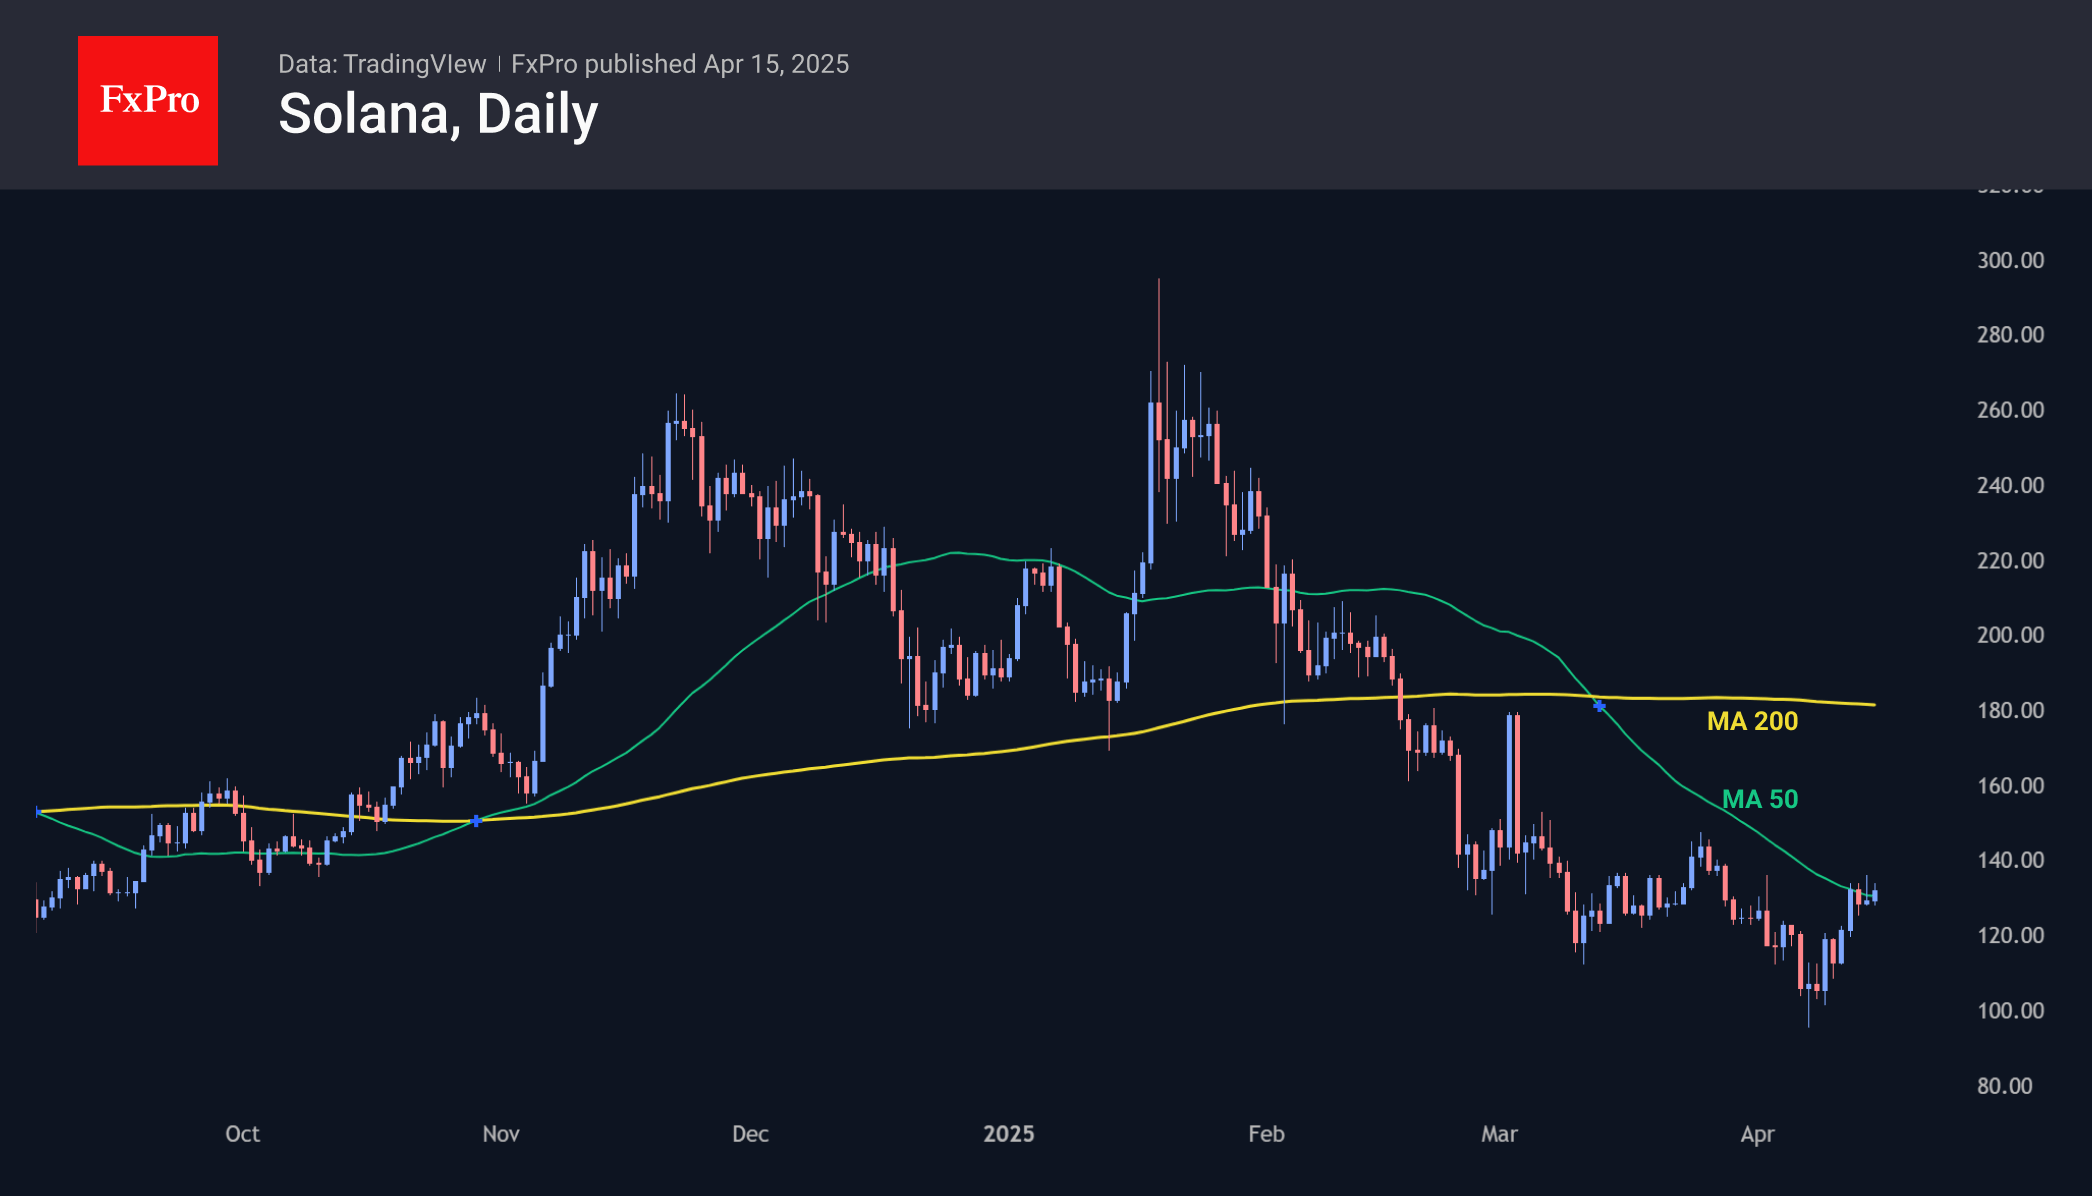
Solana has added 20% over the past seven days. From a technical perspective, this is an attempt to get back into the bull market zone. Solana is recovering faster than many of the major altcoins, trading at its 50-day moving average near $130. A consolidation above this level will open the way to $145, the area of previous peaks. A sustained move above them will signal a break of the downtrend and could lead to a move towards $180.
News Background
According to CoinShares, global investments in crypto funds fell by $795 million last week after outflows of $240 million a week earlier. Bitcoin investments were down $751 million, Ethereum was down $38 million, and Solana was down $5 million, but investments in XRP were up $3.4 million, and Algorand and Avalanche were up $0.25 million.
Coinshares noted that recent tariff changes have led to record outflows of $7.2bn, effectively levelling out almost all of the inflows since the start of the year.
Call options on Bitcoin at $100K were the most popular on the Deribit platform, with a total open interest of nearly $1.2bn, according to CoinDesk analyst Omkar Godbole. The $70K put options were the second most popular, with $982 million in open interest.
Project Mantra’s MANTRA token (OM) collapsed by 90%, and its market capitalisation dropped from $5.5 billion to $765 million. The crypto community suspects fraud, calling it the biggest rug pull since the collapse of LUNA and FTX.
Sunset Market Commentary
Markets
Markets are still licking the wounds of last week’s mayhem. For a second straight session we see a modest risk rebound. With the spirit of Easter in mind, it’s too early to call it a resurrection. We remain very doubtful though when it comes to the sustainability of the comeback moves. German Bunds turned into safe haven assets last week, but are slipping away today without a specific trigger. The very long end of the curve underperforms in a bear steepening move that lifts German yields by 1.5 bp (2-yr) to 5.6 bps (30-yr). The sole European release – German ZEW investor confidence – showed another swing. The expectations component surged to the highest level since February 2022 in March on the back of the fiscal U-turn. In April, the tariff saga pulled the index all the way back to the lowest level since July 2023. The ECB’s Q1 Bank Lending Survey didn’t alter the equation going into Thursday’s policy meeting. It showed lending continuing to stabilize after improving over the last two years. At the margin, it strengthens the case of the policy hawks looking for a policy pause. Despite last week’s aggressive repositioning on European money markets, we stick to our scenario of final 25 bps policy rate (to 2.25%) which bring the central bank’s policy rate (currently meaningfully less restrictive) into neutral territory. It allows the ECB to wait-and-assess how tariffs and German/European spending will impact the medium term growth and inflation outlook. EMU money markets currently contemplate the possibility of a 1.50% ECB rate cycle bottom by year-end. US Treasuries start following Bunds south as we approach the US opening bell. The curve bear steepens as well with yields currently up to 3.5 bps (30-yr) higher. The headline empire manufacturing index improved from -20 to -8.1, but details flash warning signals. The outlook for the next six months crashed to the lowest level since 2001 with manufacturers fearing shrinking orders and shipments. The prices paid subindex rose to its highest level since August 2022 with the prices received index also at the highest level in more than two years. Price expectations point at more inflation pressures (stemming from tariffs). In FX space, EUR/USD for a second straight session drifts to the 1.13 big figure. EUR/GBP dips from 0.86 toward 0.8550. This morning’s near-consensus labour market report failed to inspire. Wages growth stabilized at 5.9% 3M/YoY in the three months to February. The unemployment rate held stable at 4.4% in that period with March payrolls showing a 78k decrease. The March CPI report is on tap tomorrow. We don’t think it will derail the BoE from its current quarterly cutting pace. Stock markets gently endorse US President Trump’s latest feature in the improvised trade strategy: product exemptions. Car parts are rumoured to be next after some electronics. Key European indices win up to 1%. US stock markets open up to 0.4% higher.
News & Views
Canadian inflation decelerated quicker than expected in March. Headline prices rose by 0.3% m/m to be up 2.3% y/y. This compares to the 1.1% and 2.6% February reading & the 0.7% and 2.7% consensus estimate. Average core gauges unexpectedly showed a minor slowdown from 2.9% y/y to 2.85%. Canada’s statistics agency referred to substantially lower prices for travel tours, airfares and gasoline prices as the main driver. These downward pressures were partially offset by the end of the federal tax break from February 15 on, creating upside base effects for the coming y/y readings (eg. food from restaurants rose 3.2% y/y vs -1.4% in February). The March print fell below the Bank of Canada’s own 2.5% forecast for that month and is within the 2% +/- 1ppt target range. The central bank meets tomorrow and has an updated set of forecasts at its disposal. Canadian money markets raised the odds for another cut after today’s data but continue to favor a pause (45% vs 55%) ever since Trump hit the tariff pause button (for 90 days). The Canadian Loonie loses marginal ground with USD/CAD trading around the 1.39 big figure. Canadian swap yields lose up to 3 bps at the front end of the curve.
A day after OPEC lowered its oil growth forecasts, the International Energy Agency slashed its own. The cut was substantially bigger than OPEC’s 125k though and the IEA is overall much less bullish than OPEC. The IEA removed 300k barrels a day from its 2025 forecast to 726k b/d. This would decrease further in 2026 to 692k. OPEC’s projections yesterday stood at 1.3 mln and 1.28 mln respectively. The IEA sticks to a supply surplus in the coming years. It did say that OPEC’s surprise decision early this month to restore output way more than expected in May would have less of an actual effect due to members of the cartel already producing above their quota. Oil prices trade little changed today, holding close to but below the $65/b barrier.
USD/JPY Mid-Day Outlook
Daily Pivots: (S1) 142.14; (P) 143.11; (R1) 144.00; More...
USD/JPY is staying in consolidations above 142.05 temporary low and intraday bias remains neutral. Stronger recovery might be seen but outlook will stay bearish as long as 151.20 resistance holds. Below 142.05 will resume the fall from 158.86 to 139.57 support.
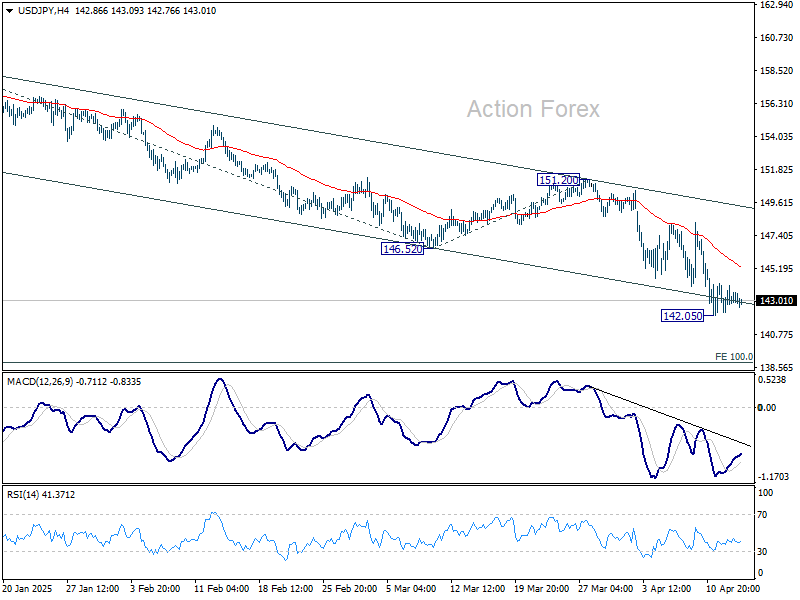
In the bigger picture, price actions from 161.94 are seen as a corrective pattern to rise from 102.58 (2021 low), with fall from 158.86 as the third leg. Strong support should be seen from 38.2% retracement of 102.58 to 161.94 at 139.26 to bring rebound. However, sustained break of 139.26 would open up deeper medium term decline to 61.8% retracement at 125.25.
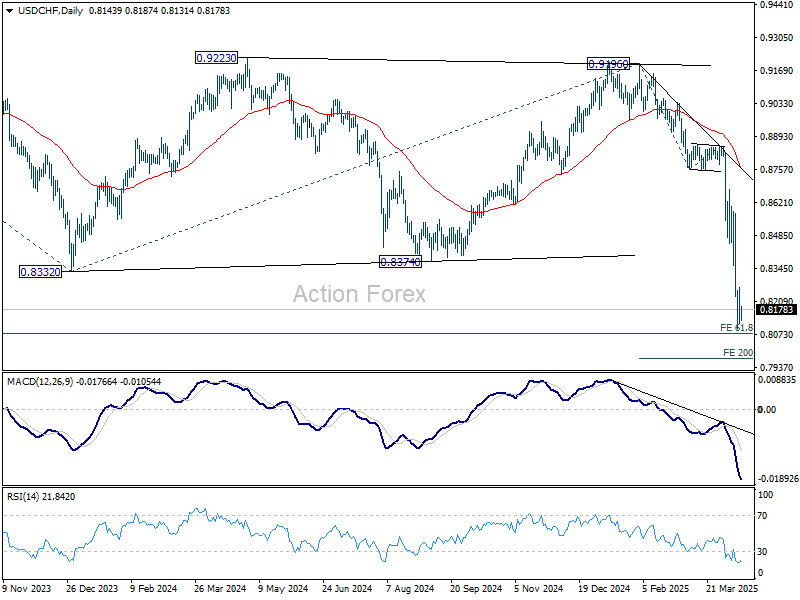
USD/CHF Mid-Day Outlook
Daily Pivots: (S1) 0.8089; (P) 0.8179; (R1) 0.8238; More…
USD/CHF is staying in consolidations above 0.8098 temporary low and intraday bias remains neutral. While stronger rise might be seen, upside should be limited by 55 4H EMA (now at 0.8391) to bring another fall. On the downside, break of 0.8098 will resume recent down trend to 200% projection of 0.9196 to 0.8757 from 0.8854 at 0.7976 next.
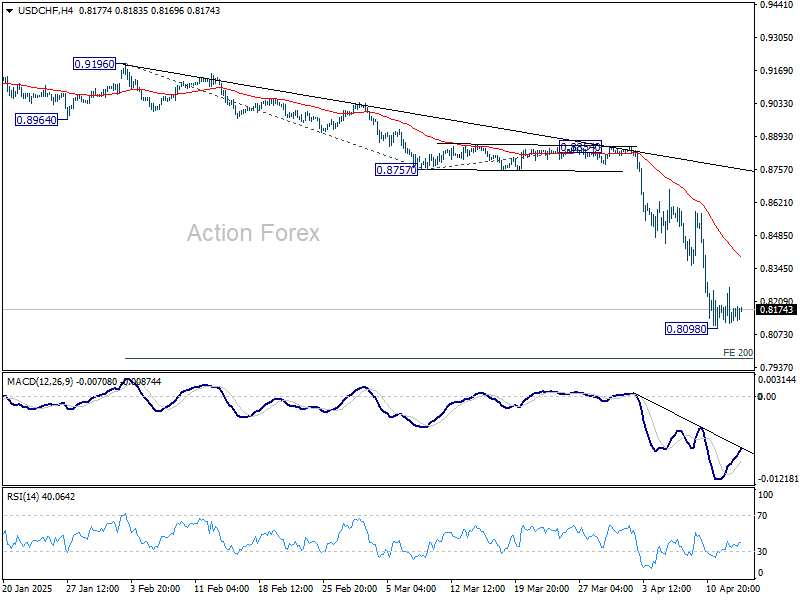
In the bigger picture, the break of 0.8332 (2023 low) confirms resumption of long term down trend from 1.0342 (2017 high). Next target is 61.8% projection of 1.0146 (2022 high) to 0.8332 from 0.9196 at 0.8075. Firm break there will target 100% projection at 0.7382.
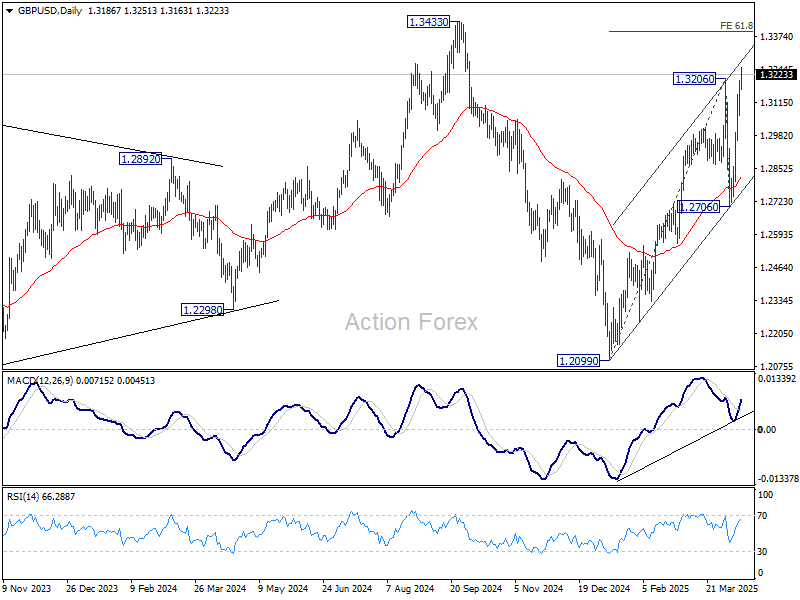
GBP/USD Mid-Day Outlook
Daily Pivots: (S1) 1.3102; (P) 1.3151; (R1) 1.3241; More...
GBP/USD's rally from 1.2099 resumed by breaking through 1.3206. Intraday bias stays on the upside for 61.8% projection of 1.2099 to 1.3206 from 1.2706 at 1.3390, and possibly further to 1.3433 high. On the downside, below 1.3121 minor support will turn intraday bias neutral first. But overall near term outlook will stay bullish as long as 1.2706 support holds.
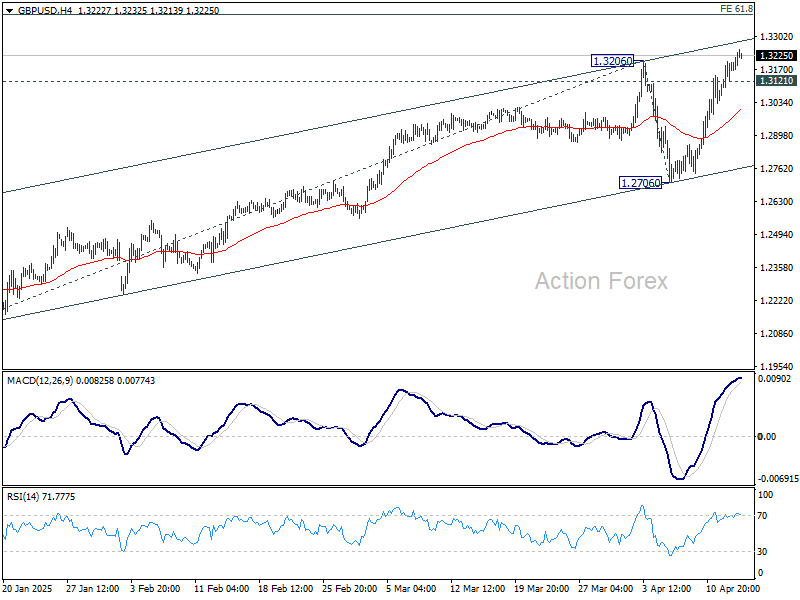
In the bigger picture, price actions from 1.3433 are seen as a corrective pattern to the up trend from 1.3051 (2022 low). Rise from 1.2099 could be the second leg. Overall, GBP/USD should target 1.4248 key resistance (2021 high) on break of 1.3433 at a later stage.