Sample Category Title
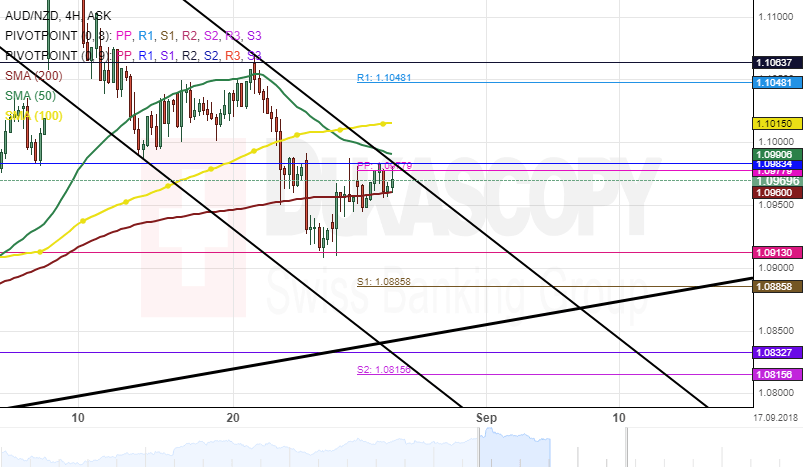
AUD/NZD 4H Chart: Meets Resistance Cluster
The Australian Dollar began to depreciate against the New Zealand Dollar after reaching the upper boundary of a dominant ascending channel in early August. During this short period of decline, the currency pair fell by 2.41%.
During the morning hours on Tuesday, the exchange rate was stranded between a resistance cluster formed by the combination of the weekly and the monthly pivot points near 1.0983 above, while the 200-hour simple moving average was providing support for the rate below.
Everything being equal, a breakout from the barrier mentioned above could be expected within this session. Meanwhile, technical indicators flash mixed signals.
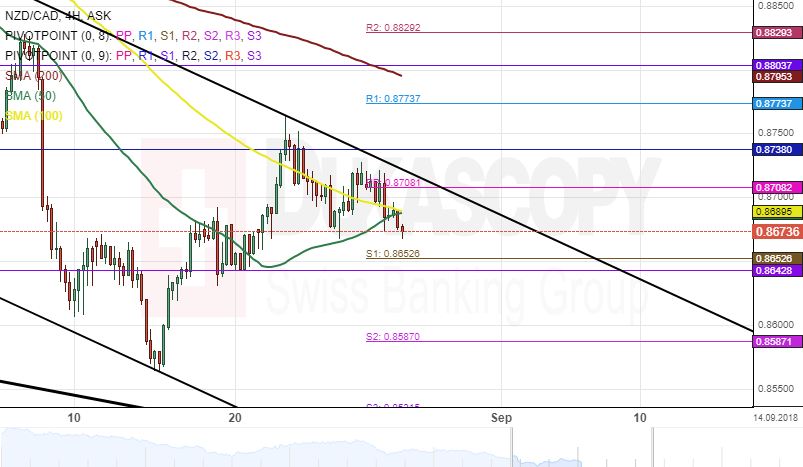
NZD/CAD 4H Chart: Potential Breakout
The New Zealand Dollar has depreciated substantially against the Canadian Dollar during the past two months. This slump started when the currency pair reversed from the upper boundary of a descending channel on June 24. Furthermore, this 659 base points decline was constrained by the 100-hour SMA.
The low positioning of technical indicators on both the daily and the weekly time frames suggest that the NZD/CAD currency exchange rate could continue moving in the junior descending channel during the following trading sessions. However, given that the rate has moved closer to the up border of the descending channel, and the 55-hour simple moving average has fallen below the price, a breakout could be expected within this session.
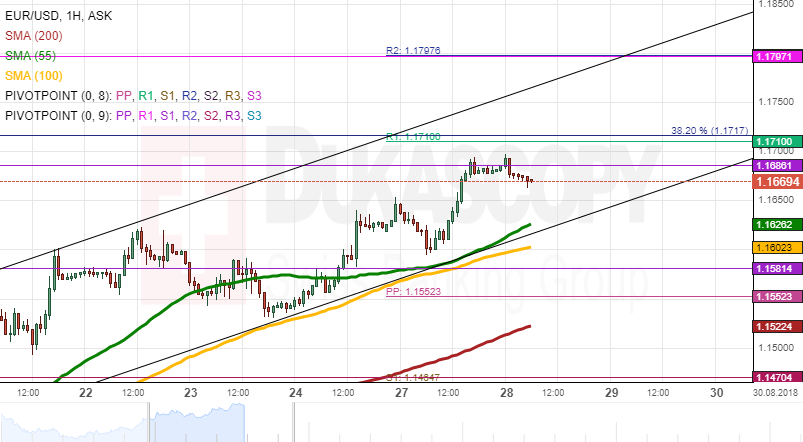
EURUSD Analysis: Continues To Surge
The previously observable dominant descending patterns on the EUR/USD chart were removed on Tuesday, as the surging momentum of the rate has managed to break both of them.
Meanwhile, the rate continues to surge in the borders of a medium scale ascending pattern, which, together with the 55 and 100-hour simple moving averages, has provided the rate with the needed support. Namely, the rate has surged up to the resistance of a monthly pivot point near the 1.1690 level.
On Tuesday, the rate was consolidating its previous gains and waiting for the 55 and 100-hour SMAs to catch up before continuing the surge.
GBPUSD Analysis: Bounces Off Dominant Resistance
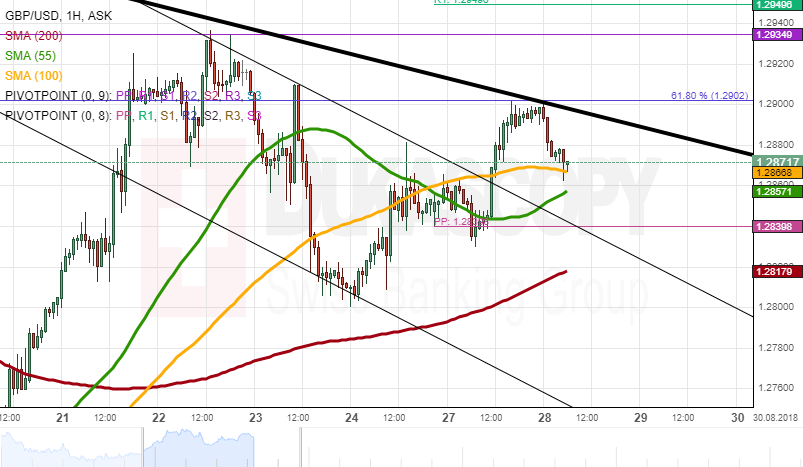
The Pound has broken the resistance of a medium term descending pattern against the US Dollar. However, the resulting surge was stopped by a dominant descending pattern's resistance line together with the 61.80% Fibonacci retracement level at the 1.29 mark.
On Tuesday morning the rate had bounced off the resistance line and retreated already down to the first support level that paused its decline. Namely, the 100-hour simple moving average stopped the decline.
In regards to the future, watch the SMAs for guidance. If they get passed, the weekly PP will be aimed at. On the other hand SMAs might push the rate higher.
USDJPY Analysis: Has No Resistance On Tuesday
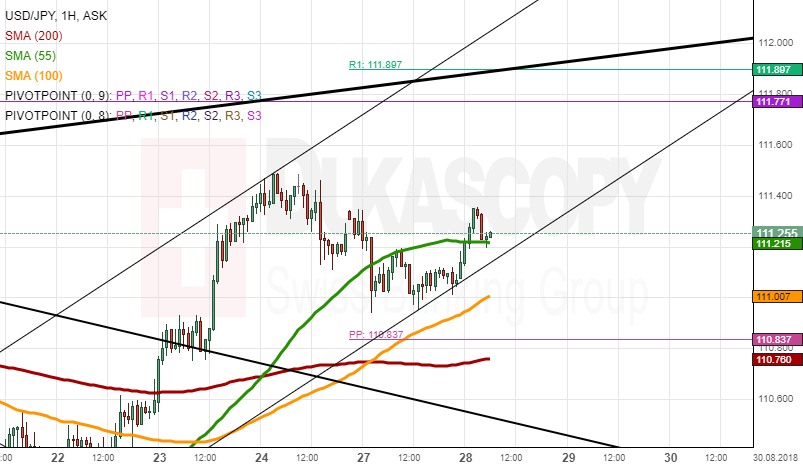
The US Dollar found support against the Japanese Yen on Tuesday morning. Namely, the lower trend line of a medium term channel up pattern provided the needed support to stop the recent short lived decline.
Moreover, during the morning hours the currency rate passed the 55-hour simple moving average's resistance at 111.20. The SMA began to provide support shortly afterwards.
Meanwhile, the pair faces no notable resistance as far as the 111.80 level, where close by a monthly pivot point is located at.
Due to these factors combined, a surge in the upcoming trading sessions could be expected, during which the pair might gain 60 base points.
XAUUSD Analysis: Reaches Above 1,210.00 Level
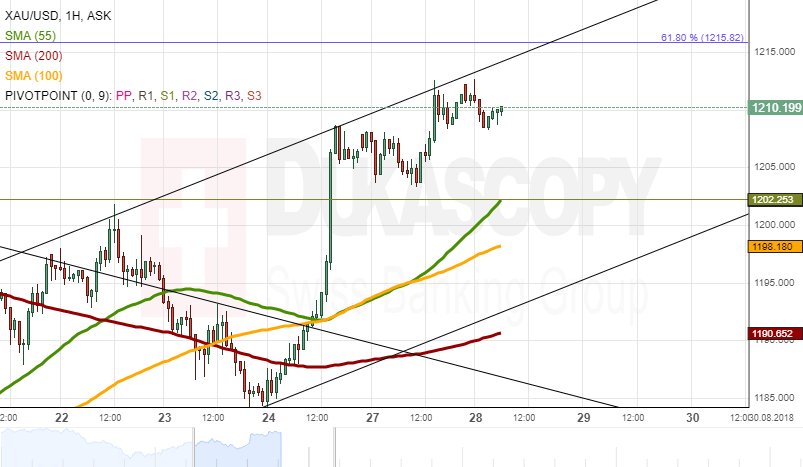
Gold prices have reached new high levels during the second half of Monday's trading session. During the surge the rate reached above the 1,210.00 mark.
However, the surge was stopped by the upper trend line of a long term ascending channel pattern. The pattern with it received another confirmation of its borders.
On Tuesday morning the commodity price was consolidating its gains near the 1,210.00 mark by trading sideways. Meanwhile, the rate had no close by resistance or support level.
Although, note that the 55-hour simple moving averages was approaching the metal's price. The SMA most likely will push the metal higher.
U.S. Trade Negotiations With Mexico Have Stopped Flight To The Dollar, But Hardly For Long
Mexico agreed to review the trade agreement with the United States on NAFTA. This became the good news for risky assets, including Asian stock markets, inspiring optimism that the trade disputes between the countries will be resolved further in the future.
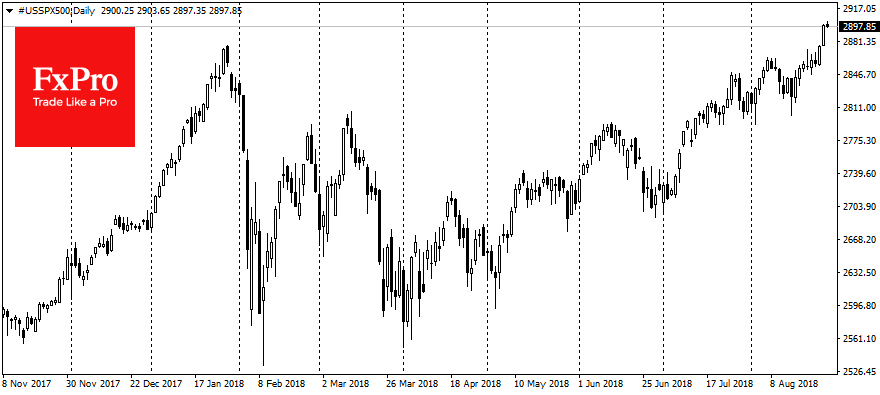
The Mexican peso gained 1.7% at one point on Monday after this news. The U.S. stock markets continued to renew their historical highs. The futures on S&P500 took a height of 2900 points, having added 0.6% in 24 hours. MSCI for Asia-Pacific has added up 0.6% since morning on speculation that the agreement with Mexico will begin to reduce of the tensions around the international trade.
However, this news looks rather like one of the few sunny days during the hurricane season.
It is increasingly likely that we will see a renewed pressure on Canada. In addition, having tasted the sense of victory in trade disputes, the Americans are unlikely to soften their rhetoric with Europe and China. Most likely, the tensest moment in both cases is just ahead, which is able to return the dollar to growth in the coming weeks.
The market participants had repeatedly hastened to bet on a breakthrough in negotiations earlier. In fact, the situation with tariffs is still worsening, but the markets are living with expectations, and it explains their growth this week.
The news on Mexico has caused pressure on the American currency. Earlier in August we had observed the demand for the dollar as safe-heaven, now these bets bonus back. The dollar index lost 0.3% in the past 24 hours, falling to the lows since August 2 to 94.60. This returns DXY to the trading range of May and, in terms of technical analysis, can become a signal to further increase of the pressure on the dollar and can send it to the previous local lows at 93.90 relatively quickly.
The EURUSD pair rose on Tuesday morning to 1.1696, and completely erased its fall earlier in August. The prospects of the pair on the part of tech analysis had noticeably improved during the previous week, having put the pair within the reach of the important resistance on 1.1740.
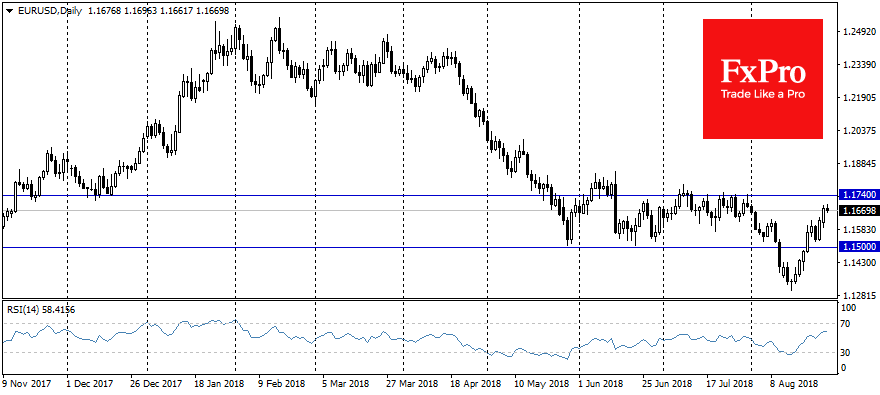
However, the short-term technical picture risks to be destroyed by unexpected turns in the rhetoric on international trade negotiations. The harsh rhetoric of the US and the reluctance of China and other countries to make quick concessions was the key driver of the dollar’s growth by more than 9% from April to August. And this situation can easily return in the spotlight. 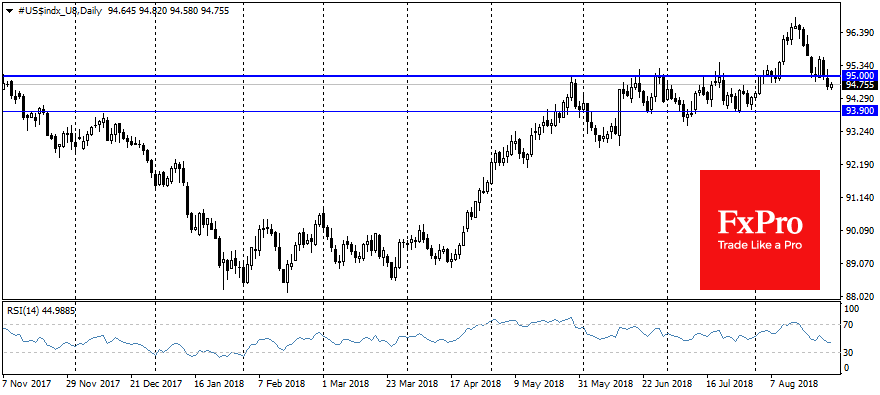
The US Dollar Continued To Decline
Yesterday, the US currency continued to decline against the basket of major currencies after the speech by Fed Chairman Jerome Powell. The US dollar index (#DX) closed in the negative zone (-0.41%). Meanwhile, yesterday it became known that the US and Mexico reached a new agreement on the future of the North American Free Trade Agreement (NAFTA). This can change the sentiment in the financial markets.
The euro was supported by German IFO business climate index published yesterday, which counted to 103.8 and was better than the expected value of 101.9. Today, investors have taken a wait-and-see attitude before the publication of CB consumer confidence index in the US.
The "black gold" prices are consolidating. At the moment, futures for the WTI crude oil are testing a mark of $68.75 per barrel. At 23:30 (GMT+3:00) the API weekly crude oil stock will be published.
Market Indicators
Yesterday, the bullish sentiment was observed in the US stock market: #SPY (+0.79%), #DIA (+1.06%), #QQQ (+1.02%).
At the moment, the 10-year US government bonds yield is at the level of 2.84%-2.85%.
The news feed on 2018.08.28:
CB consumer confidence index at 17:00 (GMT+3:00).
NZD/USD Multiple Ascending Trendlines Suggest Bullish Breakout
The NZD/USD has formed a bullish structure that is supported by the ascending trend lines. A possible rejection from the POC zone 0.6665-0.6676 could invalidate any bearish outlook as long as 0.6627 stands firm. The targets are 0.6718 and 0.6748. Breakout above 0.6748 and the doors to 0.6800 will be open.
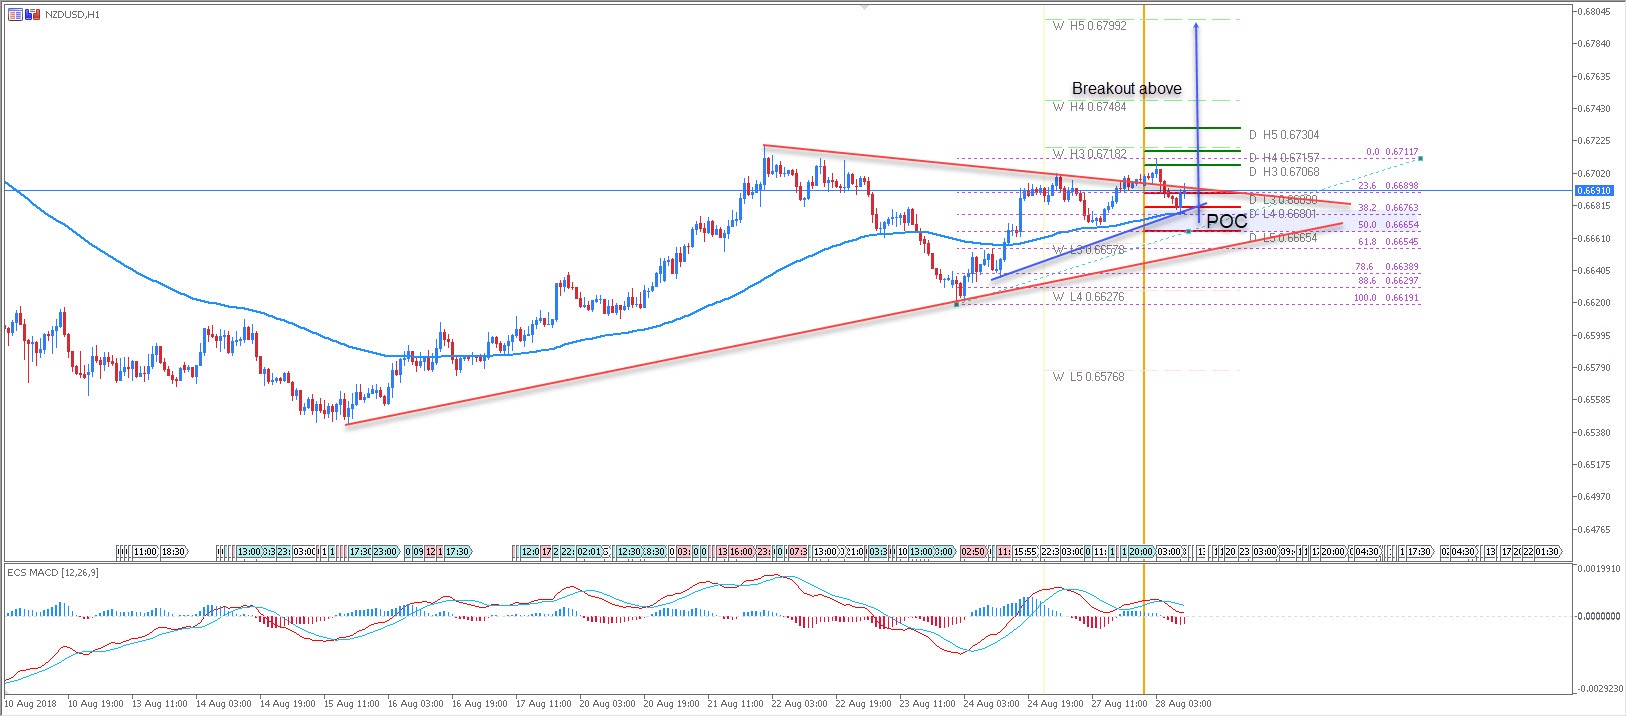
W L3 - Weekly Camarilla Pivot (Weekly Interim Support)
W H3 - Weekly Camarilla Pivot (Weekly Interim Resistance)
W H4 - Weekly Camarilla Pivot (Strong Weekly Resistance)
D H4 - Monthly Camarilla Pivot (Very Strong Daily Resistance)
D L3 – Monthly Camarilla Pivot (Daily Support)
D L4 – Monthly H4 Camarilla (Very Strong Daily Support)
POC - Point Of Confluence (The zone where we expect the price to react - aka the entry zone)
GBPUSD Neutral In Short-Term But Still Bearish In Medium-Term
GBPUSD has been moving sideways since the soft rebound on the 14-month low of 1.2660 on August 15, unable to fully recover losses made earlier this month. In the short-term, the market could maintain consolidation if the RSI keeps moving around 50 and the red Tenkan-sen line, as well as the blue Kijun-sen line, hold flat. Regarding the trend, this is likely to remain on the downside in the near-term as the 20-day simple moving average (SMA) continues to lose strength below the 50-day SMA.
An extension to the upside and above the 1.2900 key level could meet the area between the blue Kijun sen-line currently at 2936 and July’s low of 1.2956. Further up, resistance could run towards the 23.6% Fibonacci of the downleg from 1.4375 to 1.2660, around 1.3063, which is marginally above the 50-day SMA (1.3041), while even higher, steeper increases could also touch the 1.3200 round level where the market stopped at the end of May and July.
On the other hand, if the pair weakens, the red Tenkan-sen line which hovers around 1.2800 could provide immediate support ahead of the 1.2773 trough reached in August 2017. Even lower, the 1.2660 could attract a greater attention as any leg lower could worsen market’s bearish outlook, opening the way towards the 1.2560-1.2600 support area.
Regarding the medium-term picture, the bearish sentiment deteriorated after the downfall towards 1.2660 and only a move above 1.3200 could now help the market to return to neutrality.
To summarize, GBPUSD looks neutral in the short-term, while in the medium-term the picture is seen bearish unless the price breaks above 1.3200.