Sample Category Title
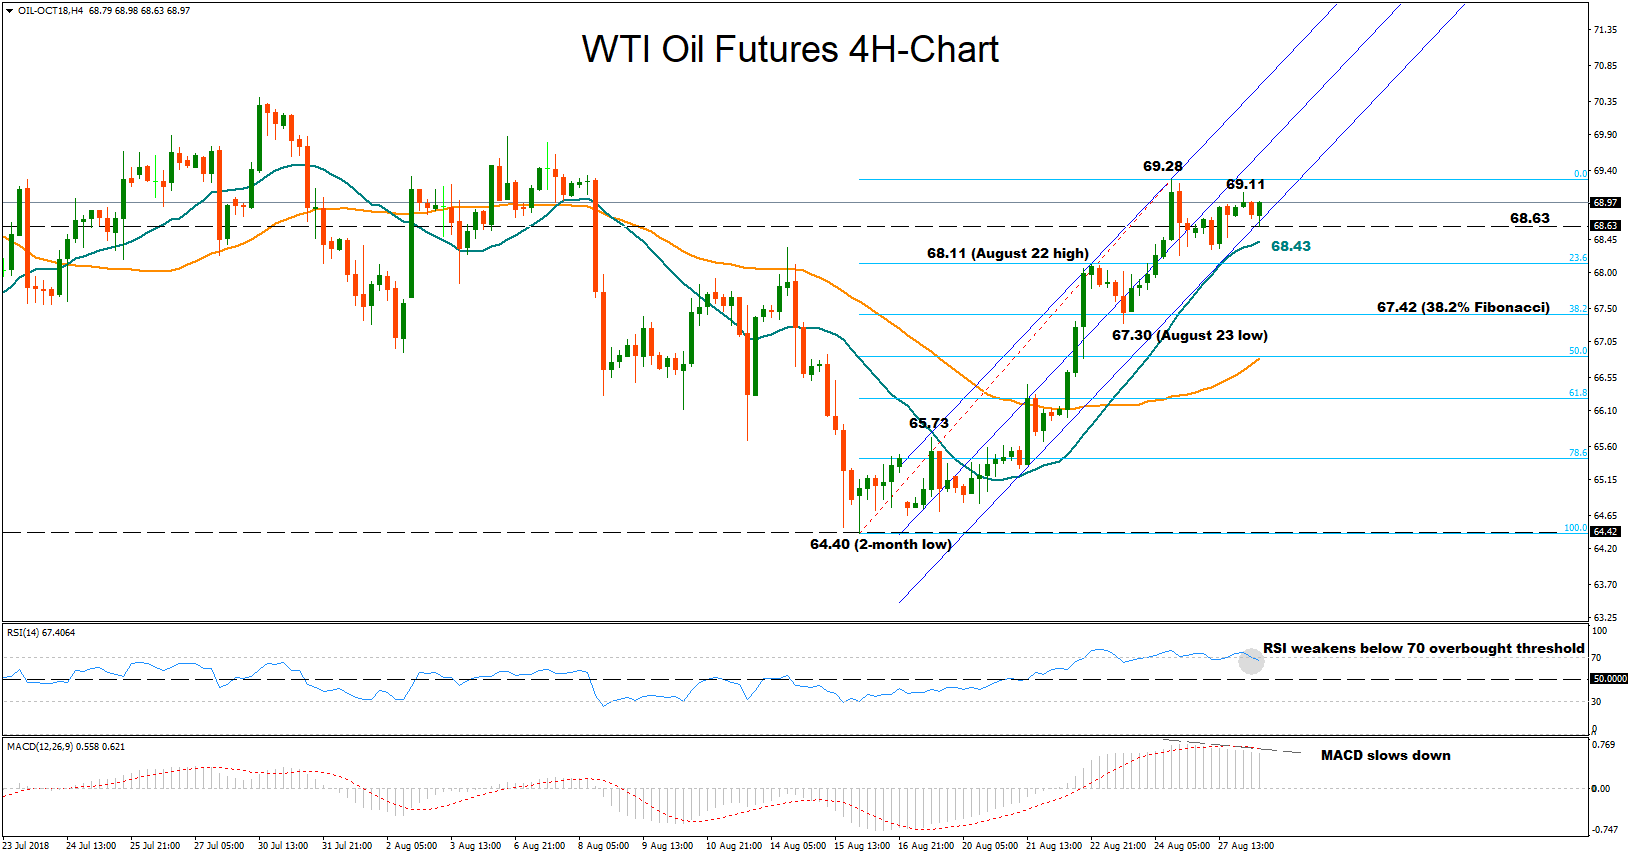
WTI Oil Futures Hold Inside Ascending Channel, Risks Tilted To The Downside
WTI crude oil futures (October delivery) have been trading within a steep ascending channel in the 4-hour chart the past two weeks after being unable to dip below the two-month low of 64.40 reached on August 16. The market, however, could violate the bullish channel as the RSI is moving lower to exit the overbought area, while the MACD is slowing down below its red signal line, both flagging that some weakness could appear in the short-term.
A correction to the downside could meet today’s low of 68.63 and at the same time retest the lower bound of the channel. A failure to hold above this level, though, and more importantly, a deep fall below the 20-period (simple) moving average (SMA) currently at 68.43 could increase speculation that the recent rally has reached a peak and prices are poised to start a downtrend. If true, the next level to watch could be the August 22 high of 68.11, where the 23.6% Fibonacci of the upleg from 64.40 to 69.28 happens to be. Even lower, bears could try to cross the area between the 38.2% Fibonacci of 67.42 and the August 23 low of 67.30.
On the upside, immediate resistance could come at 69.11 where the market stopped today before eyes turn to the middle bound of the range, currently seen around 69.28. In case bullish actions strengthen even further, the focus could then shift to the upper line of the channel around 70.50, where any decisive close above this line could turn the bullish outlook even brighter.
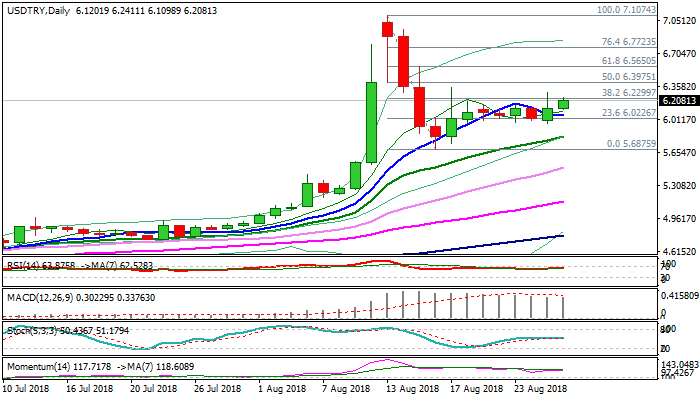
USDTRY Outlook: Bullish Bias But Consolidation May Extend, Awaiting Signal From Inflation Report
Turkish lira remains under pressure on Tuesday, with negative outlook and fears of significant losses in the near future. Negative sentiment is additionally boosted by concerns about further rise of inflation (report is due on 03 Sep) and decision of Turkish central bank on monetary policy meeting on 13 Sep.
The pair attempts again through significant barrier at 6.2299 (Fibo 38.2% of 7.1043/5.6875 pullback) after Monday's spike to 6.2975 and failure to close above 6.2299 pivot.
Strong bullish signal could be expected on eventual break here, however, bulls might be delayed as momentum and slow stochastic studies are flat.
This could result in extended consolidation within already established range (6.3430/5.9607) before bulls resume, with inflation report awaited for fresh signals.
Broken 10SMA offers initial support at 6.0470, ahead of range floor at 5.9607 and rising 20SMA at 5.8312, which guards key near-term support at 5.6875.
Res: 6.2299, 6.3430, 6.3975, 6.5650
Sup: 6.1098, 6.0740, 6.0000, 5.9607
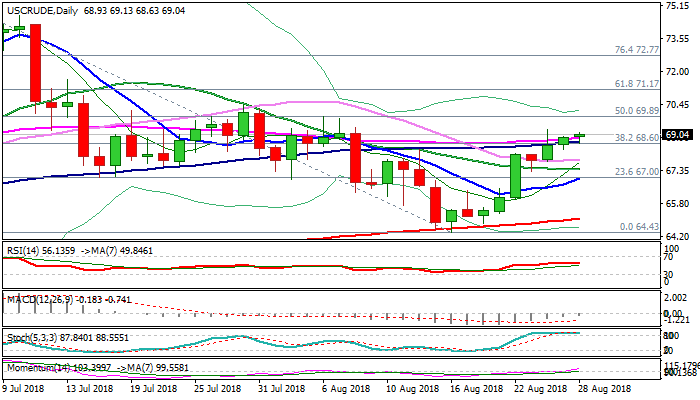
WTI Oil Outlook: Bulls Look For Break Through Thinning Daily Cloud, Weekly Crude Stocks Data In Focus
WTI oil maintains positive tone and extends higher after Monday’s close above $68.60 pivot (Fibo 38.2% of $75.34/$64.43 descend, reinforced by converged 10/55SMA’s) generated bullish signal.
Supply risks from Venezuela and Iran keep oil prices supported, but gains might be curbed by gradual output increase from OPEC.
Bullish techs (momentum broke into positive territory and continues to head up and daily MA’s in bullish setup) support the advance, but overbought slow stochastic warns of consolidative / corrective action before final attack at thinning daily cloud (69.46/70.05).
Broken Fibo barrier at $68.60 now acts as initial support, ahead of 30SMA ($67.86) and 20SMA ($67.40) which is expected to hold deeper dips.
Focus turns on releases of US crude stocks report, with private institute (API) due later today and official data (EIA) due on Wednesday, which could provide fresh signals.
Res: 69.29, 69.46, 59.89, 70.05
Sup: 68.60, 68.33, 67.86, 67.40
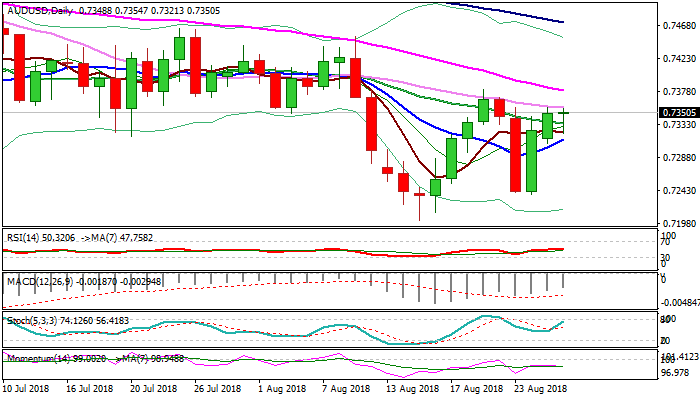
AUDUSD Outlook: Bulls Lack Momentum For Final Push Towards 0.7380 Barrier
Strong rally of past two days lacked momentum and remains capped by 30SMA (0.7357) for the second day.
Doji candle of Asian/early European trading confirms sideways mode, supported by flat momentum/RSI studies, while daily MA’s are in mixed mode.
Bullish scenario requires break above 30SMA to expose key barriers at 0.7381 (21 Aug high/falling 55SMA) break of which would be strong bullish signal.
Near-term focus is expected to remain at the upside while the price holds above 20SMA (0.7334), while softer tone could be anticipated on break lower.
Break and close below ascending 10SMA (0.7312) would revive bears and risk further weakness.
Res: 0.7357, 0.7380, 0.7393, 0.7453
Sup: 0.7334, 0.7322, 0.7312, 0.7285
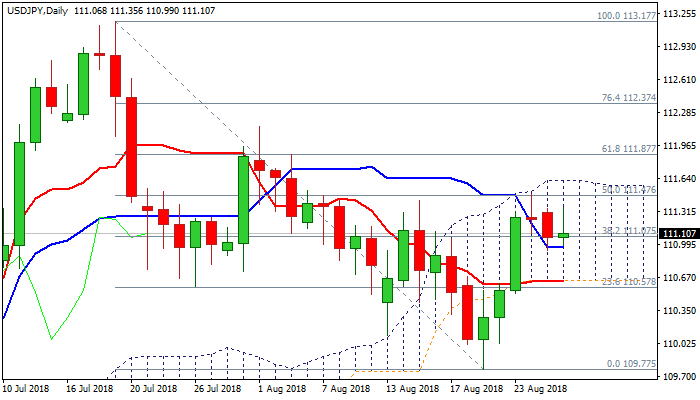
USDJPY Outlook: Extended Sideways Mode After Failure At Daily Cloud Top
The pair holds in sideways mode for the third straight day, after rally from 109.77 (21 Aug low) failed to break above daily cloud top (111.62). Strengthening momentum maintains bullish bias as the downside is protected by converged 20/55SMA’s, keeping cloud top in focus.
Eventual break above cloud would signal continuation of recovery leg from 109.77, which needs confirmation on break above 111.87 (Fibo 61.8% of 113.17/109.77 descend).
Conversely, close below 20/55SMA’s would weaken near-term structure and risk completion of reversal pattern on daily chart that could lead to fresh weakness towards daily cloud base (110.64).
Res: 111.35, 111.62, 111.87, 112.15
Sup: 110.93, 110.77, 110.64, 110.19
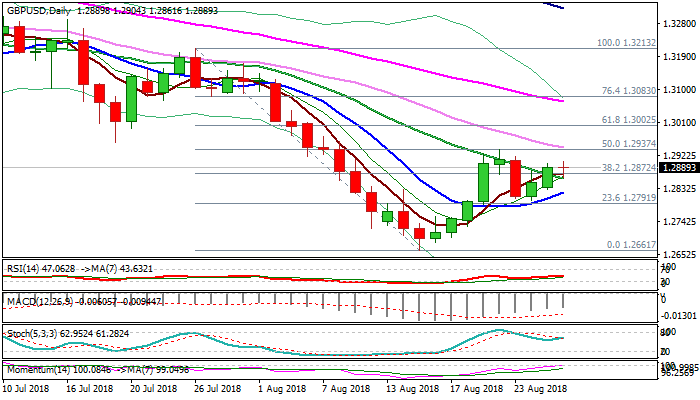
GBPUSD Outlook: Bullish Outlook Above 20SMA
Two-day rally from 1.2799 (24 Aug trough) show hesitation at 1.2900 barrier on Tuesday, as Asian trading was shaped in Doji candle.
Technical studies remain positive (momentum is breaking into positive territory, slow stochastic is heading north and showing space for further upside, with action being supported by 5/20SMA bull-cross).
Monday's close above 20SMA was bullish signal, with moving average now acting as solid support and holding today's action (currently at 1.2859).
Bulls eye pivotal barriers at 1.2937 (22 Aug high/50% of 1.3213/1.2661) and 1.2943 (falling 30SMA) to signal bullish continuation on firm break higher. Conversely, break and close below 20SMA would weaken near-term structure and risk return to pivotal support at 1.2799.
Res: 1.2904, 1.2918, 1.2940, 1.2957
Sup: 1.2859, 1.2820, 1.2799, 1.2766
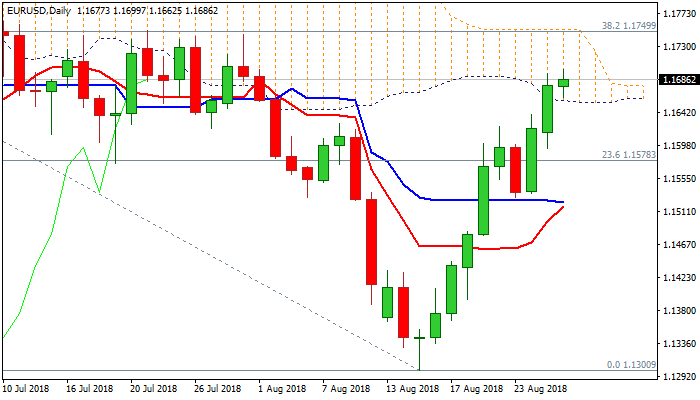
EURUSD Outlook: Bulls Penetrated Daily Cloud, Eye Key Barrier At 1.1750
The Euro maintains bullish tone and extends bull-leg from 1.1530 higher base into third straight day.
Bulls pressure psychological 1.1700 barrier, break of which would open next key barrier at 1.1750 (daily cloud top / July's lower platform / Fibo 38.2% of 1.2476/1.1300).
Monday's penetration and close within daily cloud (spanned between 1.1658 and 1.1750) was bullish signal, with structure supported by strong momentum and multiple bull-crosses of daily MA's.
Also, slow stochastic continues to head north, deeply in overbought territory, supporting the advance.
Meanwhile, hesitation at 1.1700 option barrier, may lead into extended consolidation, before bulls resume.
Broken daily cloud base serves as good support (1.1658) and should keep the downside protected to keep bulls in play.
Res: 1.1700, 1.1750, 1.1761, 1.1790
Sup: 1.1658, 1.1615, 1.1579, 1.1529
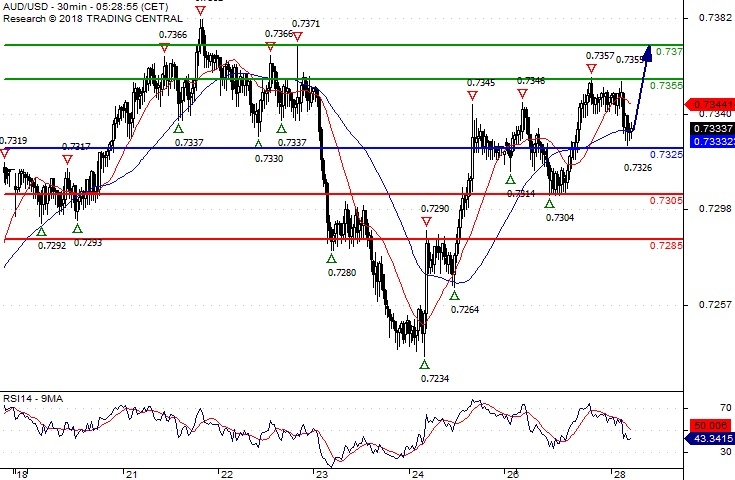
AUD/USD Caution
Pivot (invalidation): 0.7325
Our preference Long positions above 0.7325 with targets at 0.7355 & 0.7370 in extension.
Alternative scenario Below 0.7325 look for further downside with 0.7305 & 0.7285 as targets.
Comment The RSI lacks downward momentum.
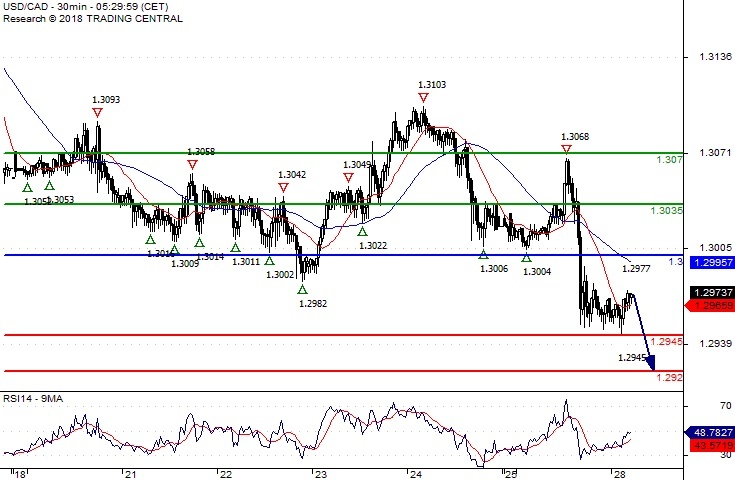
USD/CAD Key Resistance At 1.3000
Pivot (invalidation): 1.3000
Our preference Short positions below 1.3000 with targets at 1.2945 & 1.2920 in extension.
Alternative scenario Above 1.3000 look for further upside with 1.3035 & 1.3070 as targets.
Comment Technically the RSI is below its neutrality area at 50.
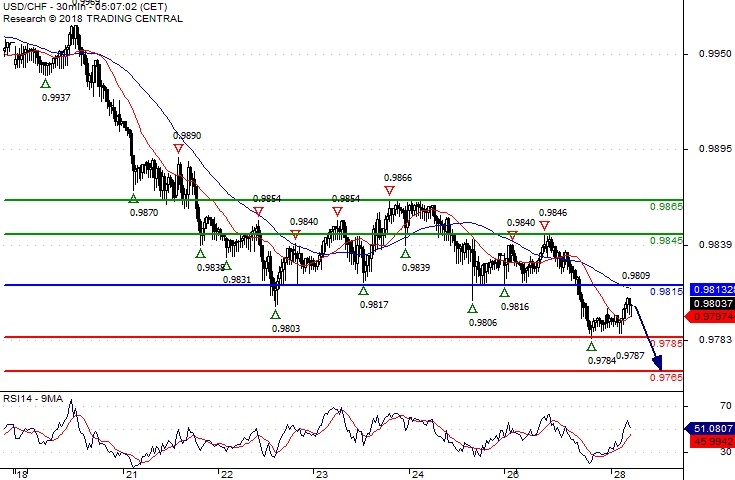
USD/CHF Key Resistance At 0.9815
Pivot (invalidation): 0.9815
Our preference Short positions below 0.9815 with targets at 0.9785 & 0.9765 in extension.
Alternative scenario Above 0.9815 look for further upside with 0.9845 & 0.9865 as targets.
Comment The RSI lacks upward momentum.