Sample Category Title
Additional US Tariffs On China Took Effect Despite Trade Talks
General Trend:
- Equity markets in Asia trade mixed
- Retail sourcing firm Li & Fung declines over 14%, reported H1 net loss
- Qantas declines after FY results
- Xiaomi gains after reporting Q2 results
- US tariffs of 25% on additional $16B worth of imports from China took effect (as expected); Awaiting any possible countermeasures from China
Headlines/Economic Data
Australia/New Zealand
- ASX 200 opened +0.1%
- ASX 200 Utilities index -2.9%, REIT -1.2%, Financials -1.1%, Consumer Discretionary -0.4%; Telecom +2.6%, Resources +0.9%, Energy +0.8%
- (AU) Australia PM Turnbull: Confirms he would not stand as candidate in leadership ballot
- (AU) Australia Cabinet members Cormann, Cash and Fifield said to have all resigned – financial press
- (AU) Australia Lower House votes to suspend parliament until Sept 10th
- (NZ) New Zealand sells NZ$150M v NZ$150M indicated in April 2025 bonds, avg yield 2.2253%, bid to cover 5.25x
China/Hong Kong
- Shanghai Composite opened flat, Hang Seng +0.3%
- Hang Seng Materials index -1.6%, Services -1.3%, Utilities -1.3%, Industrial Goods -1.3%, Telecom -1.2%, Prop/Construction -1%, Financials -0.8%, Energy -0.6%, Info Tech -0.3%
- (CN) China PBoC set yuan reference rate: 6.8367 v 6.8271 prior
- (CN) China PBoC Open Market Operation (OMO): Skips OMO v skipped prior: Net: CNY40B drain
- (CN) China Banking and Insurance Regulator (CBIRC): Banks in China face new round of bad assets exposure; harder to conduct credit expansion on a larger scale currently
- (CN) China regulator said to have guided local government bond yields higher - Chinese Press
- (CN) China plans to encourage private investment in 28 projects worth ~$16B - financial press
- (CN) China Internet Association starts checks on P2P lenders - US financial press
Japan
- Nikkei 225 opened +0.3%
- TOPIX Retail Trade index +1.1%, Info & Communications +0.6%, Real Estate +0.5%; Marine Transportation -1.1%, Iron & Steel -0.9%
- Automakers trade generally lower
- Netflix [NFLX]: Said to raise prices in Japan by up to ¥350 (Japanese Press)
- (JP) Japan Aug Prelim Manufacturing PMI: 52.5 v 52.3 prior
- (JP) Japan July Crude Steel Production Y/Y: -2%
- (JP) Japan Weekly Investors Net Buying of Foreign Bonds: -¥1.93T v +¥123.9B prior; Foreign Buying of Japan Stocks: -¥510.6B v -¥107.1B prior
Korea
- Kospi opened +0.4%
- (KR) Some tour agents in Shanghai said to be allowed to sell packages related to South Korea - South Korean Press
- (KR) South Korea Q2 Household Credit (KRW): 1,493T v 1,468T prior
- (KR) South Korea Finance Min Kim: To expand job-related budget to record level
Other
- (SG) Singapore July CPI M/M: -0.1% v-0.1%e; Y/Y: 0.6% v 0.6%e
North America
- US equity markets ended mixed: Dow -0.3%, S&P500 flat, Nasdaq +0.4%, Russell 2000 +0.3%
- S&P500 Energy +1.2%, Industrials -1%
- (US) DOE CRUDE: -5.8M V -2ME
Europe
- (EU) Germany Chancellor Merkel is reportedly more focused on the selection of the next EU President over securing the ECB Presidency for Bundesbank's Weidmann - German press
- (UK) UK govt reportedly plans to impose duties on EU imports if there is a no-deal Brexit - UK press
- (ZA) US President Trump said to have asked US Sec of State Pompeo to study land seizures in South Africa - financial press
Levels as of 01:30ET
- Nikkei 225, +0.3%, ASX 200 -0.2%, Hang Seng -0.3%; Shanghai Composite +0.5%; Kospi +0.2%
- Equity Futures: S&P500 flat; Nasdaq100 -0.1%, Dax -0.1%; FTSE100 flat
- EUR 1.1600-1.1542 ; JPY 110.95-110.50 ; AUD 0.7359-0.7282 ;NZD 0.6705-0.6662
- Aug Gold -0.4% at $1,198/oz; Sept Crude Oil +0.1% at $67.94/brl; Sept Copper -0.9 % at $2.643/lb
EUR/GBP Daily Outlook
Daily Pivots: (S1) 0.8943; (P) 0.8973; (R1) 0.8997; More...
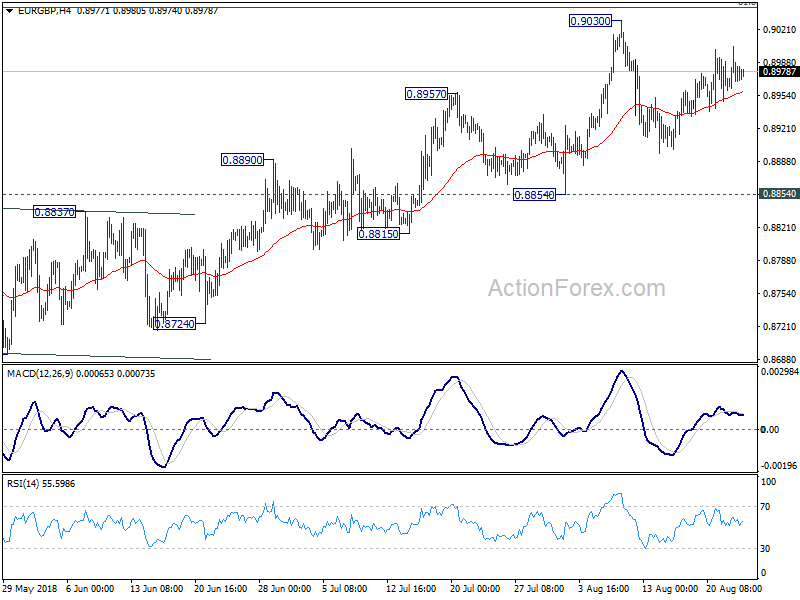
EUR/GBP is staying in consolidation from 0.9030 short term top and intraday bias remains neutral. The consolidation may extend with another fall. But downside should be contained by 0.8854 support to bring rally resumption. On the upside, firm break of 61.8% retracement of 0.9305 to 0.8620 at 0.9043 will pave the way to retest 0.9305 key resistance. However, sustained break of 0.8854 will indicate near term reversal and turn outlook bearish.
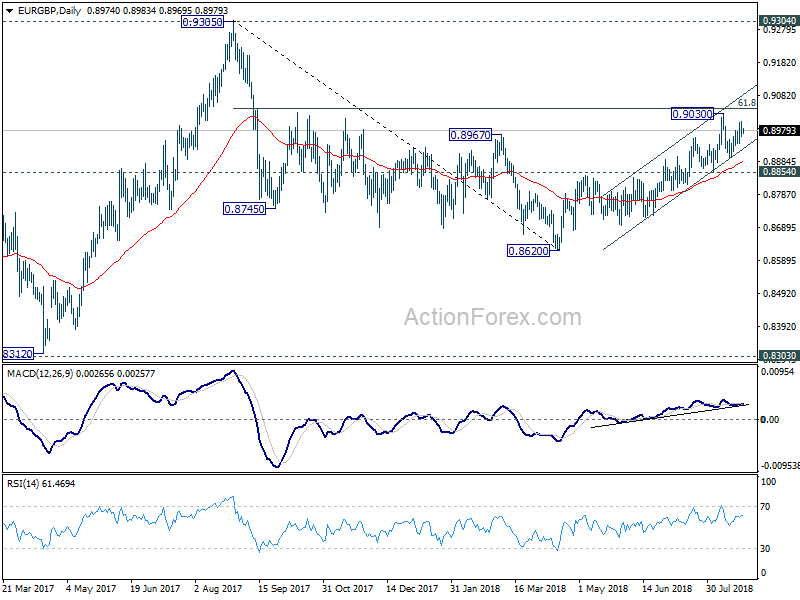
In the bigger picture, EUR/GBP is staying in long term range pattern from 0.9304 (2016 high). The corrective structure of the fall from 0.9305 to 0.8620 is raising the chance that rise from 0.8312 to 0.9305 is an impulsive move. But we're not too confident on it yet. In any case, we'd stay cautious on strong resistance from 0.9304/5 to limit upside in case of further rally. Meanwhile, if there is another medium term decline, strong support will likely be seen from 0.8303 to contain downside.
EUR/AUD Daily Outlook
Daily Pivots: (S1) 1.5712; (P) 1.5756; (R1) 1.5817; More....
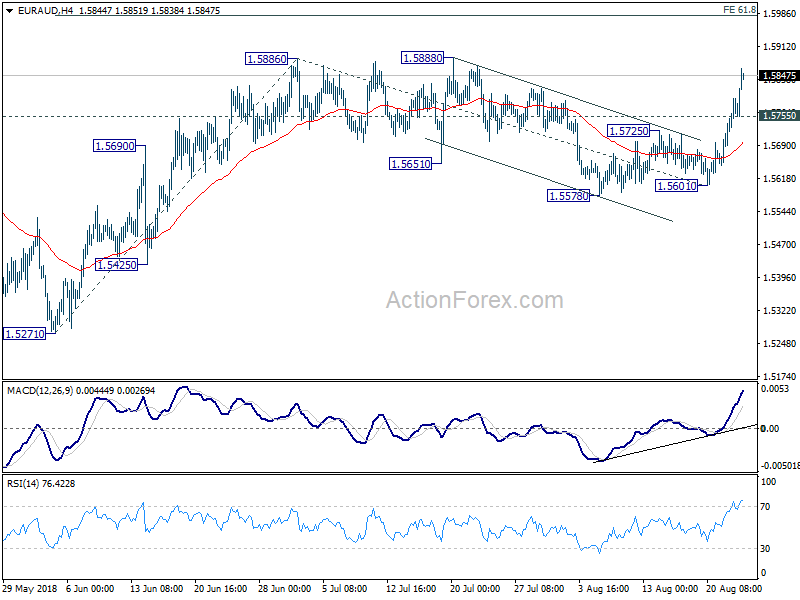
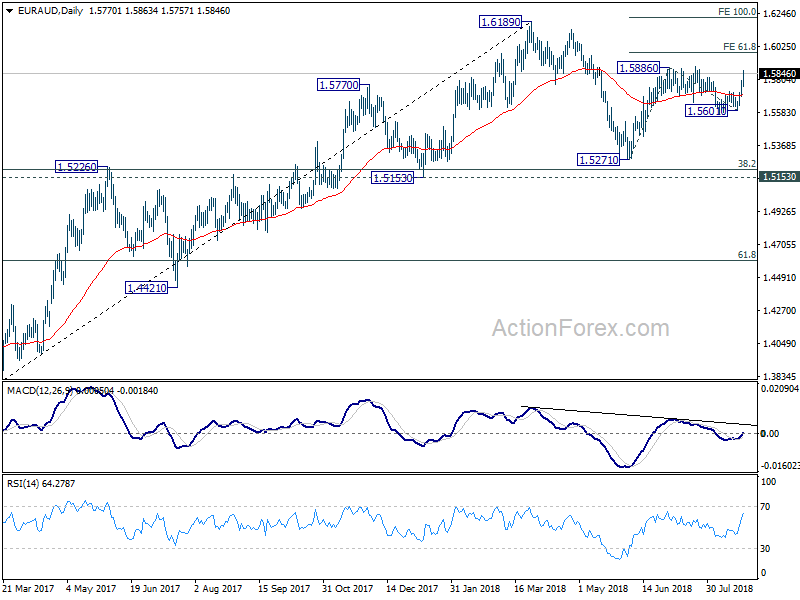
EUR/AUD surges to as high as 1.5863 so far today and intraday bias remains on the upside for 1.5886/8 resistance. Firm break there will resume the rise from 1.5271 and target 61.8% projection of 1.5271 to 1.5886 from 1.5601 at 1.5981 first. Break will target 100% projection at 1.6216, which is close to 1.6189 high. On the downside, below 1.5755 minor support will turn intraday bias neutral first.
In the bigger picture, the rebound from 1.5271 was somewhat weaker than expected. EUR/AUD. But there is no confirmation of completion. Break of 1.5888 will likely target 1.6189 and above to resume the medium term rally from 1.3624 (2017 low). This will be the favored case as long as 1.5271 support holds.
ECB Minutes From The July Meeting Are Also Being Released
Market movers today
Lots of data on the agenda today. In the euro area, the Flash PMI is due. After reaching an all-time high of 60.6 in December 2017, manufacturing PMI fell for six consecutive months to 54.9 in June 2018. The July figure reported a small increase to 55.1 and we believe manufacturing PMI will stabilise around this level for now. This is supported by the rebound in August ZEW economic expectations, and the trade deal between the EU and US in July has also diminished the immediate threat of tariff measures. Hence, we look for manufacturing PMI at 55.2 in August (in line with consensus).
US PMI manufacturing has fallen for two months but at 55.3 it is still above the average since 2010 at 54.0. Our models suggest US manufacturing is set to slow a bit further over the coming months and we look for a small decline in August. US Initial jobless claims are likely to stay broadly unchanged from the already low level at 212,000 last week. US new home sales are also up for release. This has been moving broadly sideways this year but overall housing has shown some signs of softening lately.
The second tranche of tariffs between the US and China comes into effect today. It will lead to another 25% tariff on goods worth USD16bn. We continue to look for further escalation of the trade war during autumn, see also US-China Trade - no deal in sight , 27 July 2018.
ECB minutes from the July meeting are also being released. Although we do not expect any major new information as the meeting was relatively uneventful, we will look out for any hints regarding the Governing Council's interpretation of the date-dependent part of the forward guidance on rates ('at least through the summer of 2019').
In the Scandies, it is time for Norway GDP for Q2 and Swedish unemployment figures, see next page.
Selected market news
The release of the FOMC minutes yesterday did not move the market significantly. They further confirmed that the Federal Reserve is set to raise rates again in September. Beyond that, it reiterated the Fed's focus on the flattening of the yield curve. In this regard, note that the 2Y 10Y US yield curve flattened further to 22bp - the lowest level this year. In addition, there was a long discussion about the implication for the future monetary policy framework from the risk of hitting the effective lower bound on interest rates again in the future.
Oil prices rallied strongly yesterday with the price on Brent crude moving firmly above the USD74/bbl level. Prices were supported by the fall in USD and decline in US oil inventories last week. The later has eased concerns in the market about the impact of growing supply from OPEC recently.
The UK is preparing for the event of a no-deal Brexit as Brexit Secretary Dominic Raab yesterday urged that both sides find sensible solutions so business can continue in such a scenario.
EUR/CHF Daily Outlook
Daily Pivots: (S1) 1.1381; (P) 1.1395; (R1) 1.1416; More...
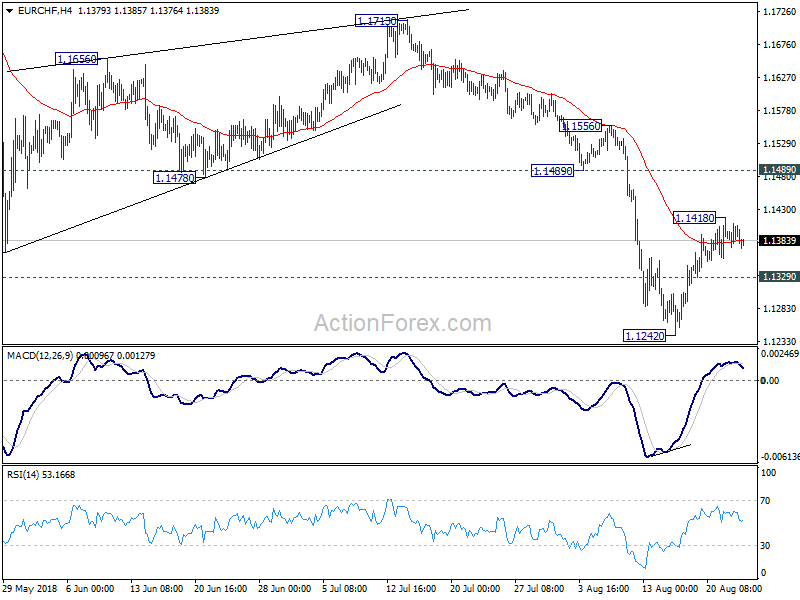
A temporary top is in place at 1.1418 and intraday bias in EUR/CHF is turned neutral first. Another rise is expected as long as 1.1329 minor support holds. Above 1.1418 will target 1.1489 support turned resistance. Decisive break will add to the case of trend reversal ahead of key support zone between 1.1154/98. On the downside, below 1.1329 minor support, however, will suggests completion of the rebound. Intraday bias will be turned back to the downside for 1.1242 low. And focus will be back on 1.1154/98 key support zone.
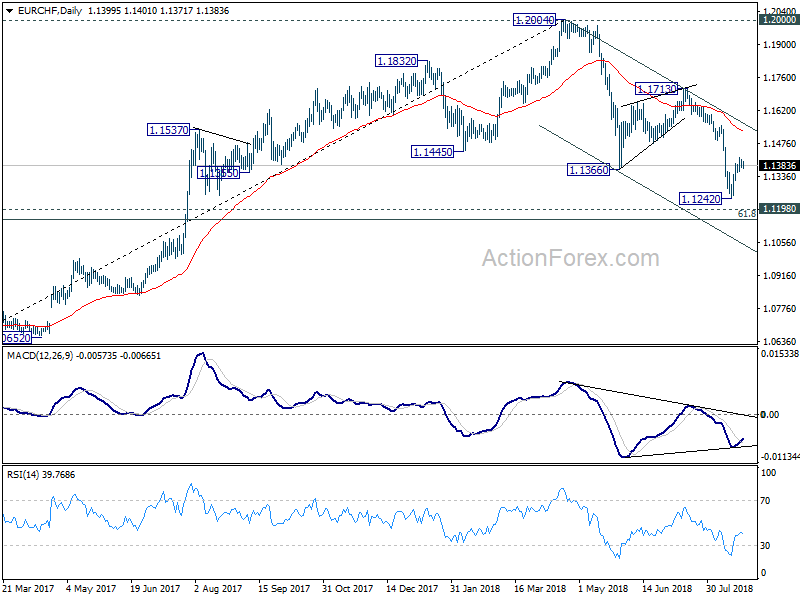
In the bigger picture, for now, the price actions from 1.2004 medium term top is seen as a correction only. Downside should be contained by 1.1198 (2016 high), 61.8% retracement of 1.0629 to 1.2004 at 1.1154 to complete it and bring rebound. This cluster level is in proximity to long term channel support (now at 1.1173) too. A break of 1.2 key resistance is still expected in the medium term long term. However, sustained break of the mentioned support zone will mark reversal of the long term trend.
EUR/USD Daily Outlook
Daily Pivots: (S1) 1.1559; (P) 1.1591; (R1) 1.1630; More.....
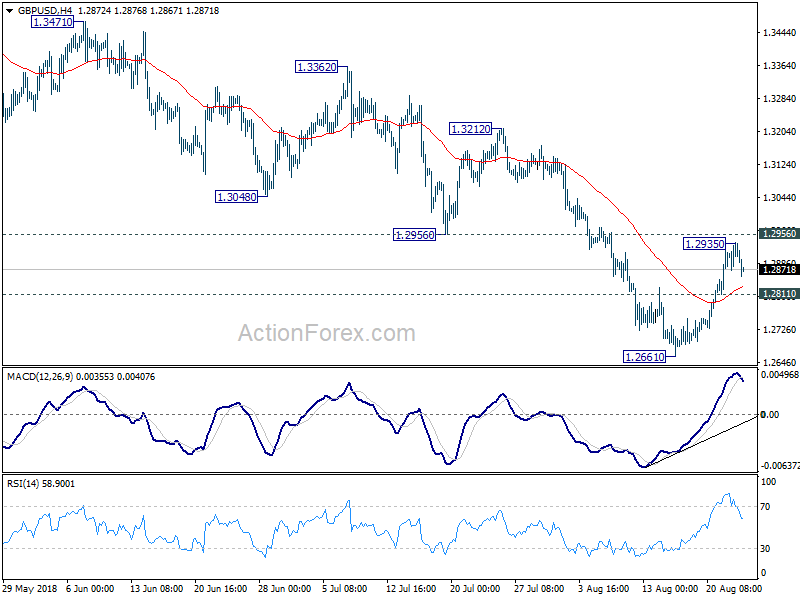
A temporary top is in place at 1.1622 in EUR/USD and intraday bias is turned neutral. For now, rebound from 1.1300 is still seen as a correction. In case of another rise, we'd expect strong resistance from 1.1745 to limit upside to bring larger down trend resumption. On the downside, break of 1.1493 minor support will suggest that the rebound is completed. Intraday bias would be turned back to the downside for retesting 1.1300 low.
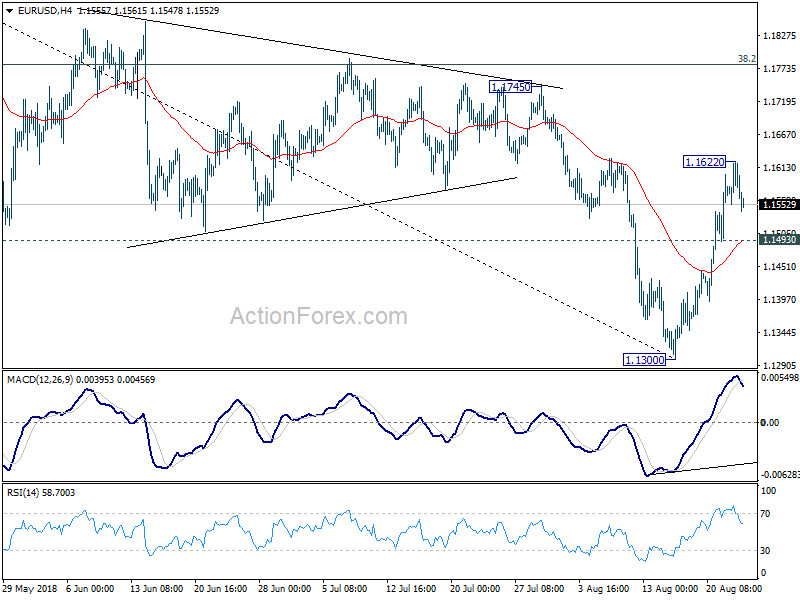
In the bigger picture, the down trend from 1.2555 medium term is in progress for 61.8% retracement of 1.0339 to 1.2555 at 1.1186. Note again that EUR/USD was rejected by 38.2% retracement of 1.6039 (2008 high) to 1.0339 (2017 low) at 1.2516. That carries some long term bearish implications. Sustained break of 1.1186 could pave the way back to retest 1.0339 low. For now, outlook will remain bearish as long as 38.2% retracement of 1.2555 to 1.1300 at 1.1779 holds, even in case of strong rebound.
USD/JPY Begins Bullish ABC Zigzag Pattern
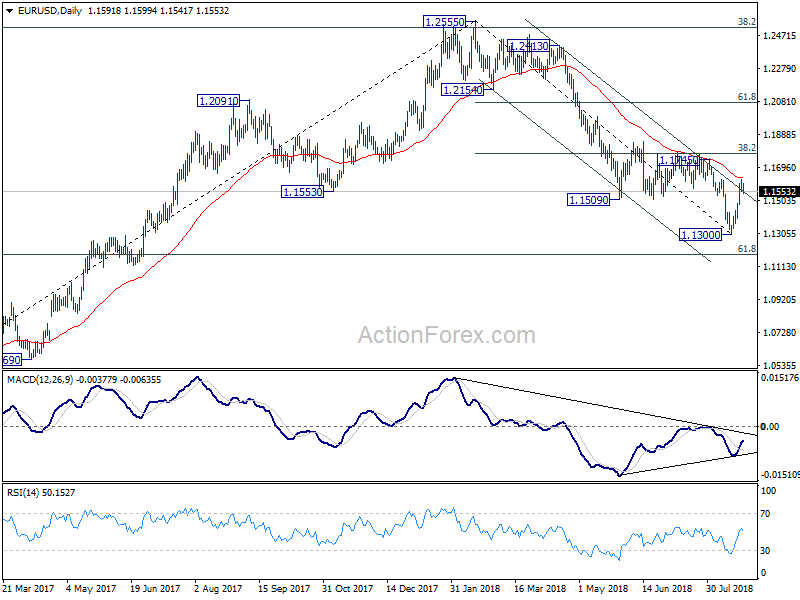
The USD/JPY broke the resistance trend line (dotted red) as expected in yesterday's wave analysis. The bullish breakout is probably part of a larger bearish WXY (pink) correction, which could indicate a bearish bounce at the Fibonacci levels. The main target of the bearish correction is at the confluence of the 50% Fibonacci level, and the -27.2% Fib target, which could complete a wave E.
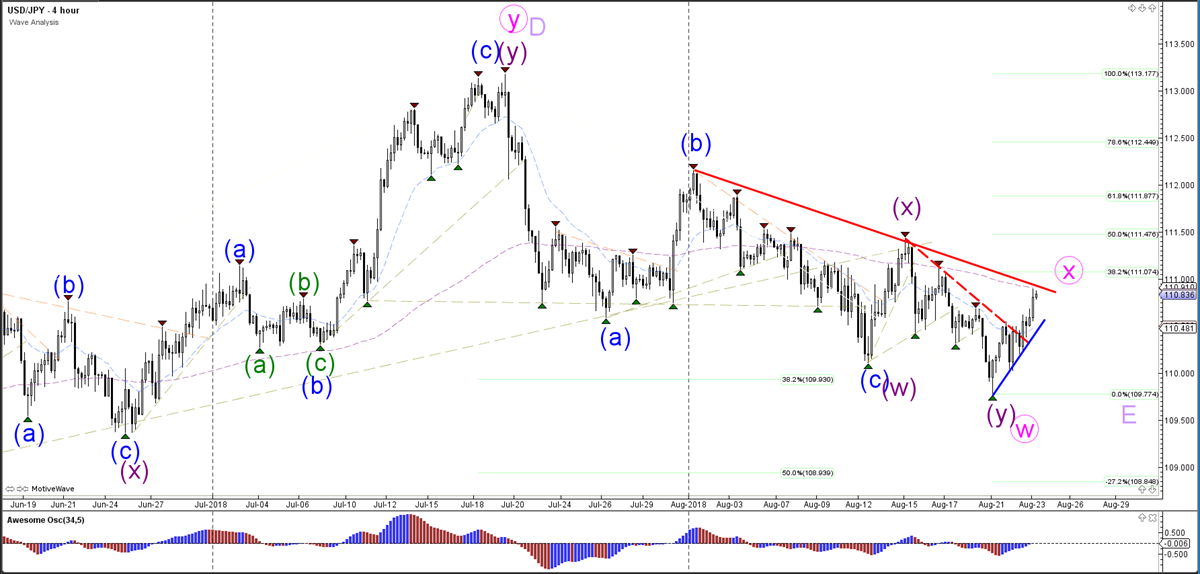
The USD/JPY seems to be completing an ABC zigzag pattern within wave X (pink). A break below the support trend line (blue) increases the chance that the wave C (purple) has been completed.
GBP/USD Daily Outlook
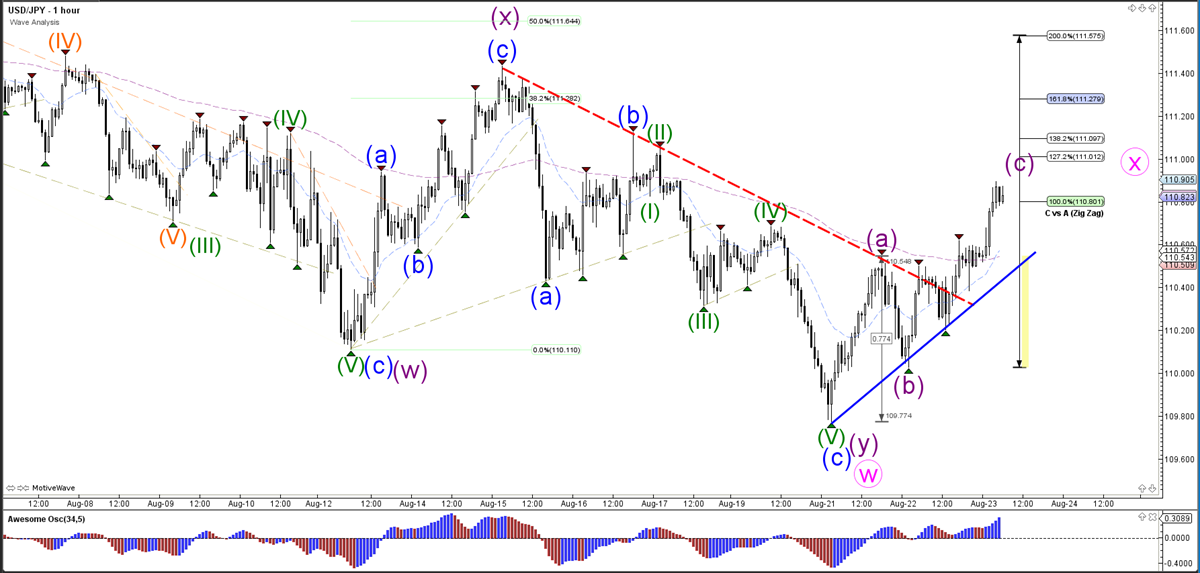
Daily Pivots: (S1) 1.2876; (P) 1.2906; (R1) 1.2944; More...
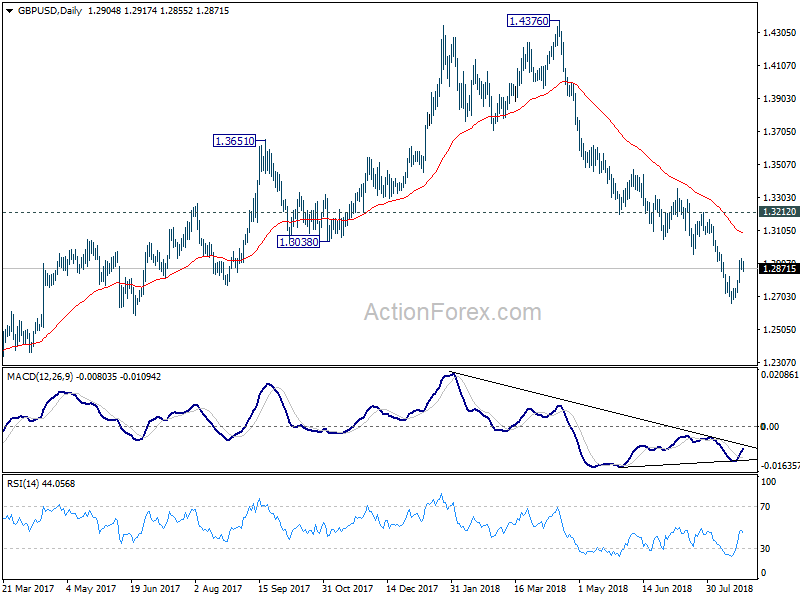
A temporary top is in place at 1.2935 with the current retreat. Intraday bias in GBP/USD is turned neutral first. Rebound from 1.2661 is seen as a corrective move. We'd expect upside to be limited by 1.2956 support turned resistance to bring larger down trend resumption. On the downside, below 1.2811 minor support will turn bias to the downside for retesting 1.2661 low first. However, decisive break of 1.2956 will turn focus to 1.3212 key resistance instead.
In the bigger picture, whole medium term rebound from 1.1946 (2016 low) should have completed at 1.4376 already, after rejection from 55 month EMA (now at 1.4091). Current downside acceleration argues that it's possibly resuming long term down trend. In any case, outlook will stay bearish as long as 1.3212 resistance holds. Retest of 1.1946 should be seen next.
Elliott Wave View: AUDNZD Further Downside Expected
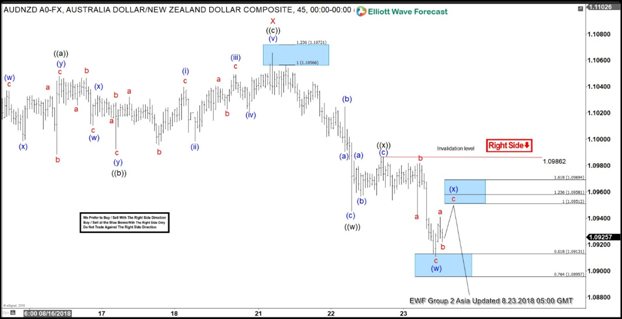
AUDNZD Short-term Elliott Wave view suggests that the rally to 1.1066 ended Minor wave X. The internal subdivision of Minor wave X is unfolding as a zigzag Elliott Wave structure where Minute wave ((a)) ended at 1.1048, Minute wave ((b)) ended at 1.0992, and Minute wave ((c)) of X ended at 1.1066. A zigzag is a 5-3-5 ((a))-((b))-((c)) structure in which the subdivision of wave ((a)) and ((c)) is in 5 waves, either as impulse or diagonal.
Down from 1.1066, Minor wave Y is in progress as a double three Elliott Wave structure where Minute wave ((w)) ended at 1.0945 and Minute wave ((x)) ended at 1.0986. Below there, Minute wave (w) of ((y)) is proposed complete at 1.091 low as a Flat. Minute wave (x) of ((y)) is in progress to correct cycle from 8/22 high (1.0986) in 3, 7, or 11 swing before the decline resumes. The next 3 swing inflection area comes at 1.095 – 1.096 where pair can see sellers and resume to new low or at least pullback in 3 waves. We don’t like buying the proposed rally and prefer more downside in 3-7-11 swing as far as pivot at 1.0986 high stays intact.
AUDNZD 1 Hour Elliott Wave Chart
USD/CHF Daily Outlook
Daily Pivots: (S1) 0.9806; (P) 0.9832; (R1) 0.9857; More....
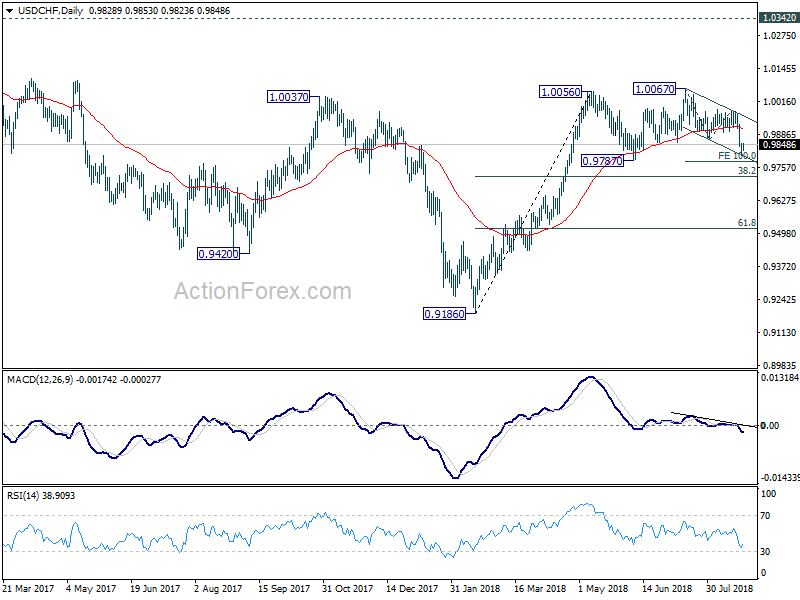
A temporary low is in place at 0.9807 in USD/CHF and intraday bias is turned neutral first. For now, deeper fall could be seen as long as 0.9889 minor resistance holds. Below 0.9807 will target 100% projection of 1.0067 to 0.9866 from 0.9981 at 0.9780 and possibly below. But fall from 1.0067 is seen as the third leg of the consolidation pattern from 1.0056. Hence, we'd expect strong support from 38.2% retracement of 0.9186 to 1.0056 at 0.9724 to bring rebound. On the upside, above 0.9889 will turn bias to the upside for 0.9981 resistance first. Break will bring retest of 1.0067 high.
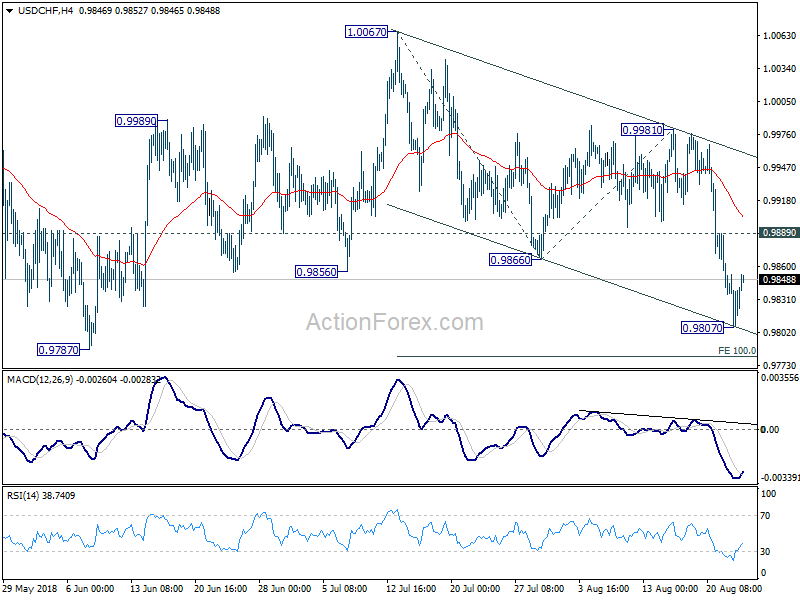
In the bigger picture, current development suggests that the consolidation pattern from 1.0056 is extending. As long as 38.2% retracement of 0.9186 to 1.0056 at 0.9724 holds, we'd expect rise from 0.9186 to resume at a later stage to retest 1.0342 key resistance (2016 high). However, sustained break of 0.9724 fibonacci level will bring deeper fall, as another declining leg in the long term range pattern.