Sample Category Title
EURUSD Supported By Bullish Macd
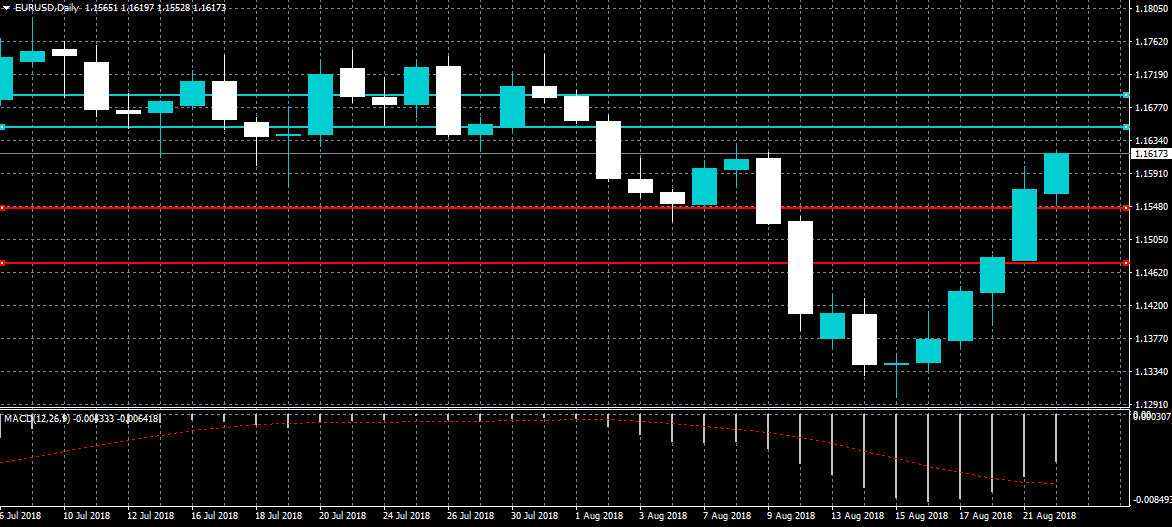
The euro currency remains well bid against the greenback, after six-day consecutive days of trading gains against the beleaguered US dollar. The MACD indicator across the daily time frame and bullish daily price closes appear to signal that further upside seems increasingly likely in the EURUSD pair over the medium-term.
The EURUSD pair remains strongly bullish while trading above the 1.1553 level, key resistance is now found at the 1.1680 and 1.1750 levels.
If the EURUSD pair moves below the 1.1553 level, sellers are likely to test towards 1.1507 and 1.1480 support levels.
GBPUSD Longer Term Indicators Turning Bullish
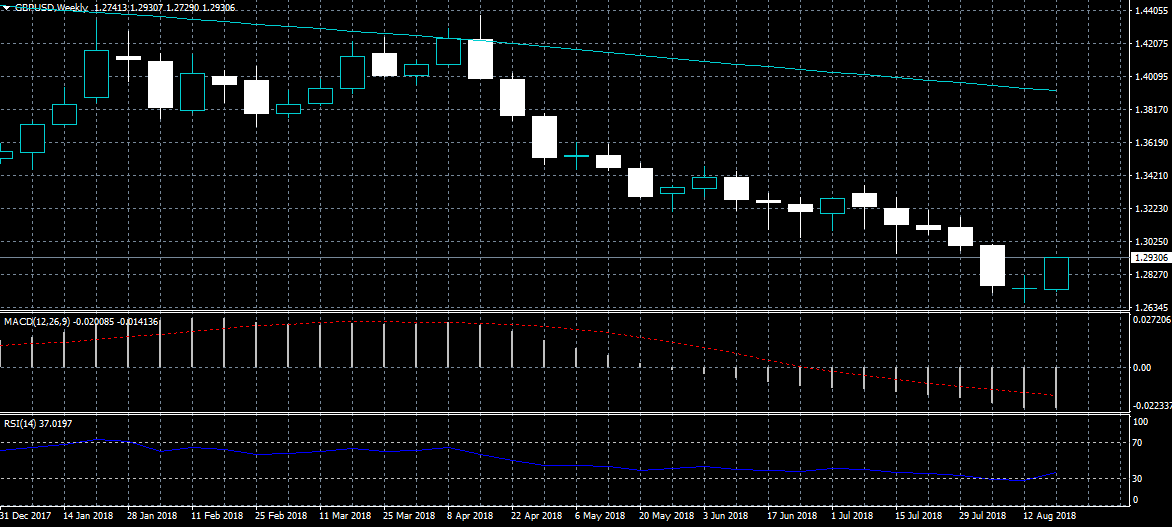
The British pound continues to recovery against the US greenback as the US dollar index remains under heavy selling pressure across. Longer-term indicators for the GBPUSD pair are now starting to turn bullish, with the RSI and MACD indicators starting to turn up on the weekly time frame after weeks of declines.
The GBPUSD pair is bullish while trading above the 1.2900 level, key resistance is now found at the 1.2958 and 1.3010 levels.
If the GBPUSD pair trades below the 1.2900 level, key intraday support is found at the 1.2844 and 1.2775 levels.
Bitcoin Falls As Sec Rejects Nine Etf Proposals
Yesterday, the price of bitcoin jumped by more than $400. There was no major news that supported the jump. After peaking at $6780, the price started declining. The decline was extended after a blow from the Securities and Exchange Commission (SEC), which rejected nine ETF proposals. The ETFs were submitted by firms like ProShares, Direxion and GraniteShares.
This was significant for the cryptocurrency industry, which could see an accelerated sell-off in the next few days. The assumption is that the ETFs would attract institutional investors, who don’t have time to use online exchanges. It could also affect the thinking of BlackRock and other large institutional investors who are interested in the industry.
The idea of a Bitcoin ETF was initiated by the famous Winklevoss brothers who launched their bid for an ETF four years ago. Their offer was rejected and just last month, the SEC rejected another offer.
In making its ruling, the SEC did not talk about the value of the Bitcoin and other currencies. Instead, it based its thinking on risks regarding the crypto sector which include fraud and market manipulation. In recent days, there have been reports about cryptocurrency manipulation.
The denial for ETFs was also a blow to the CBOE and CME, the two biggest futures exchanges in the world. Last year, the two organizations introduced Bitcoin futures, which have underperformed since then.
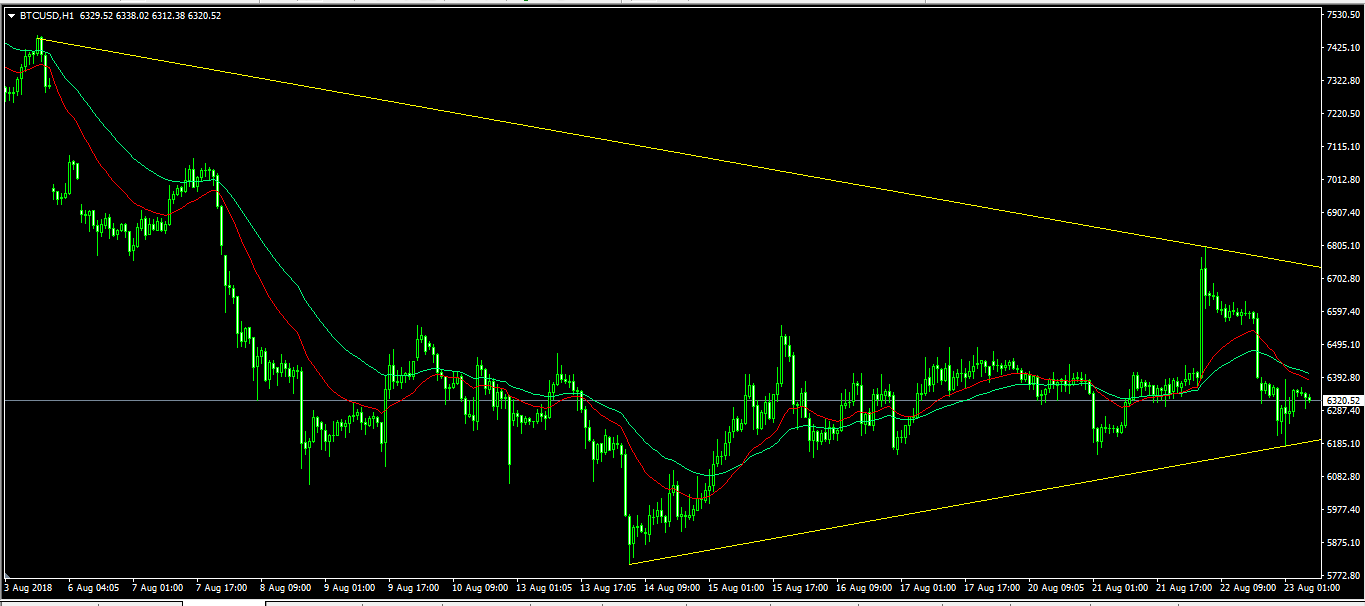
The BTC/USD pair is trading at $6320, which is slightly higher than the intraday low of $6185. The price is below the 50 and 100-day moving average, with the pair making a symmetrical triangular pattern. With no catalyst in sight, the pair is likely to continue its downward movements.
China’s retaliation tariffs start shortly after US tariffs took effect
Shortly after US tariffs on USD 16B in Chinese goods came into effect, China's equivalent retaliation tariffs also start.
In a brief statement, the Chinese Ministry of Commerce said "China resolutely opposes this, and will continue to take necessary countermeasures."
And, "at the same time, to safeguard free trade and multilateral systems, and defend its own lawful interests, China will file suit regarding these tariff measures under the WTO dispute resolution mechanism."
Jackson Hole Summit Underway
The annual Jackson Hole Symposium in Jackson Hole, Wyoming, will headline an active release schedule on Thursday. In addition to monetary policy, traders will be actively monitoring a bevy of economic releases ranging from Eurozone PMI to US new home sales.
Action begins at 06:45 GMT with a pair of French reports on individual investment and business climate. Thirty minutes later, Switzerland will report on industrial production for the second quarter.
IHS Markit will release a bevy of Eurozone PMI reports beginning at 07:15 GMT covering France, Germany and the 19-member currency bloc. The Eurozone Composite purchasing managers' index is forecast to rise to 54.5 in August compared with 54.3 the previous month.
Shifting gears to North America, the US Department of Labor will report on initial jobless claims at 12:30 GMT. The number of Americans filing for first-time unemployment benefits likely rose by 3,000 to a seasonally adjusted 215,000 in the week ended 18 August.
The Federal Housing Finance Agency (FHFA) will report on the housing price index at 13:00 GMT. Home prices likely rose 0.3% in June.
Markit will release the latest PMI gauges for the US economy at 13:45 GMT. The August Composite index is forecast to strengthen to 56.3 in August compared with 55.7 the month before.
The Commerce Department will report on new home sales at 14:00 GMT. The monthly report is expected to show 2.2% growth for July after a sharp decline the previous month.
Central bankers, policy experts and academics will descend on Jackson Hole, Wyoming Thursday for the first of a three-day summit focused on monetary policy. The annual event, which is hosted by the Federal Reserve Bank of Kansas City, could provide important clues about the future of monetary policy for key economies around the world.
EUR/USD
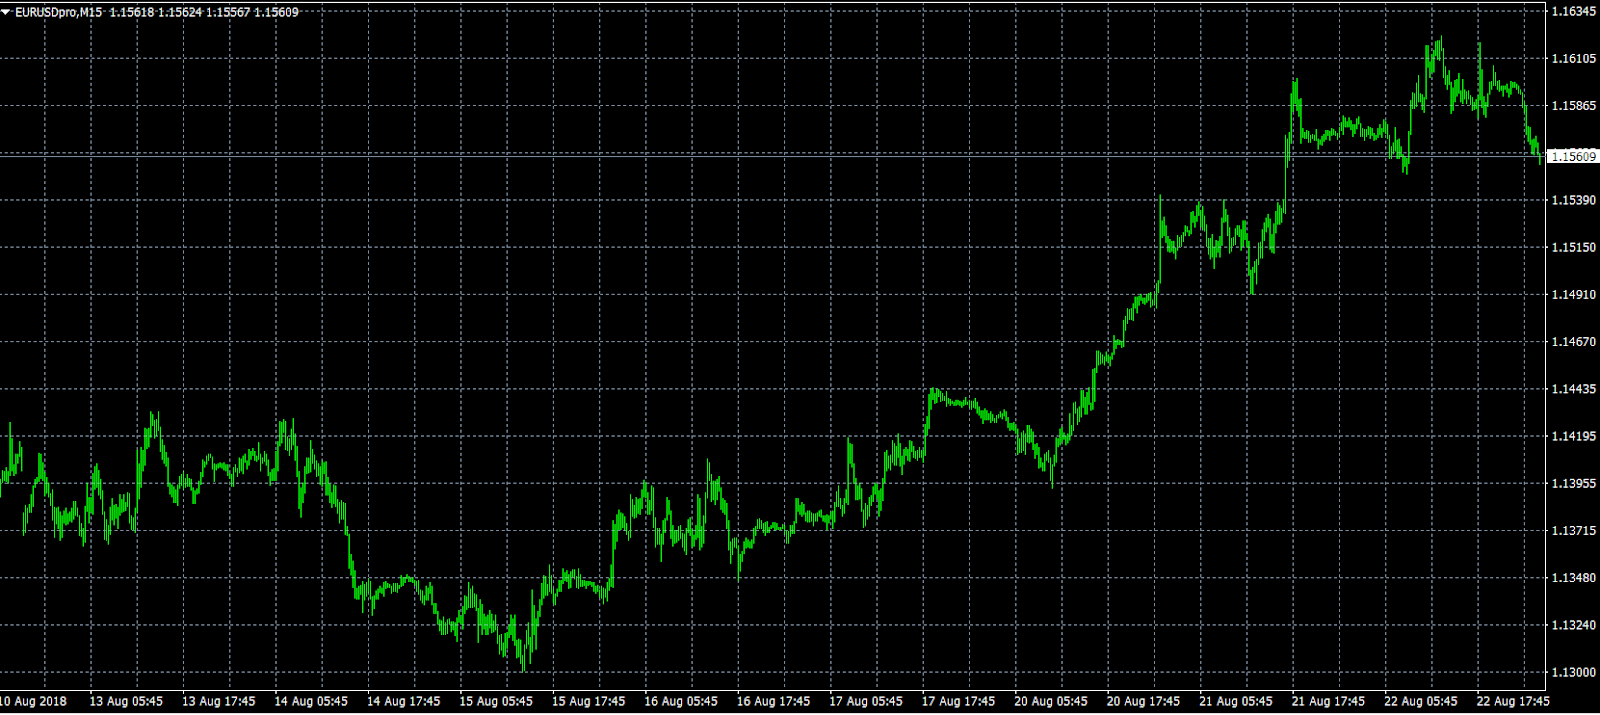
Europe's common currency broke above 1.1600 US on Wednesday for the first time in almost two weeks, as the dollar continued to backtrack against its peers. At the time of writing, the EUR/USD has pared gains to trade at 1.1561, where it was down 0.3% from the previous session. For the time being, 1.1600 represents the next major resistance.
GBP/USD
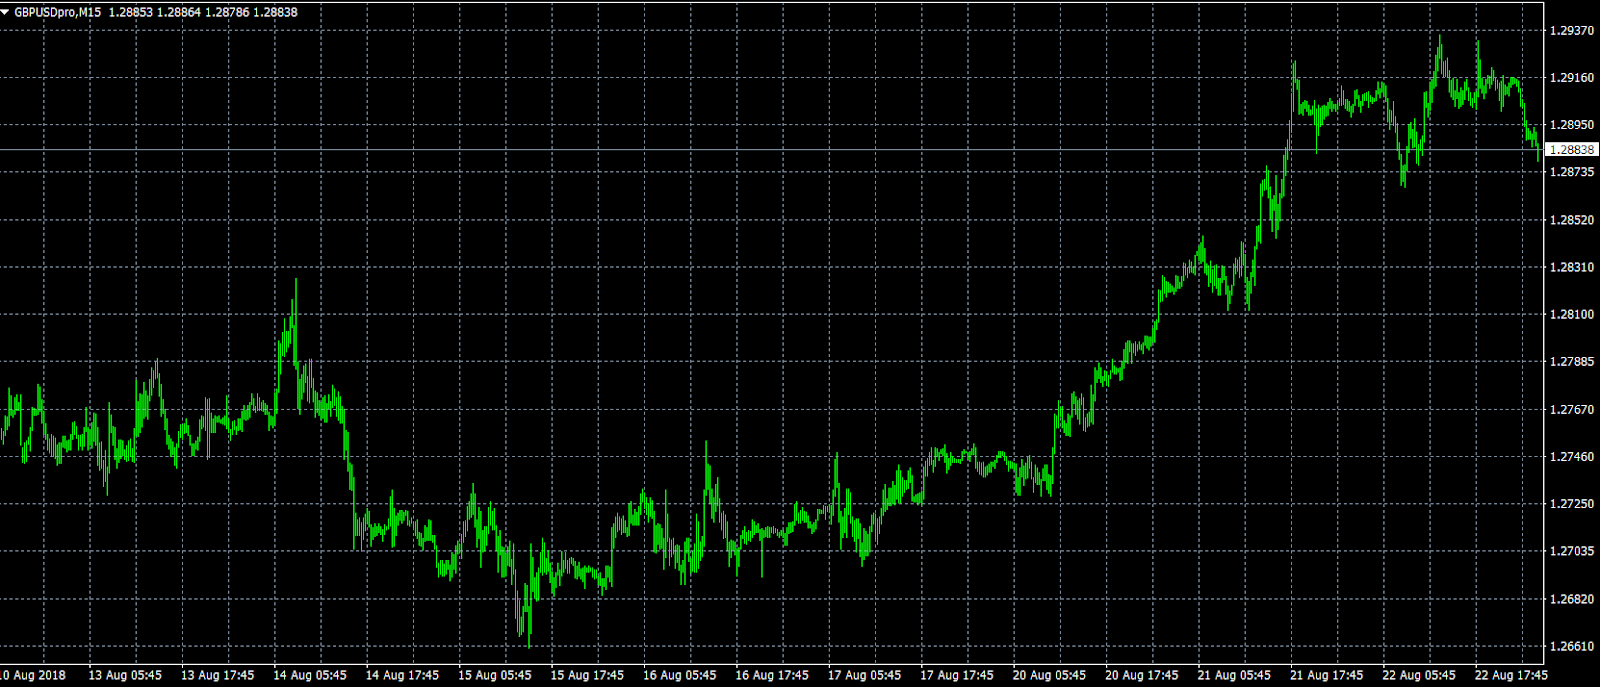
Like the euro, cable's upward momentum stalled early Thursday as profit-taking swept the currency markets in the wake of the dollar's reversal. GBP/USD is down 0.2% to trade at 1.2882. According to Scotiabank, a Canadian financial institution, gains in the pound are likely capped for now.
USD/JPY
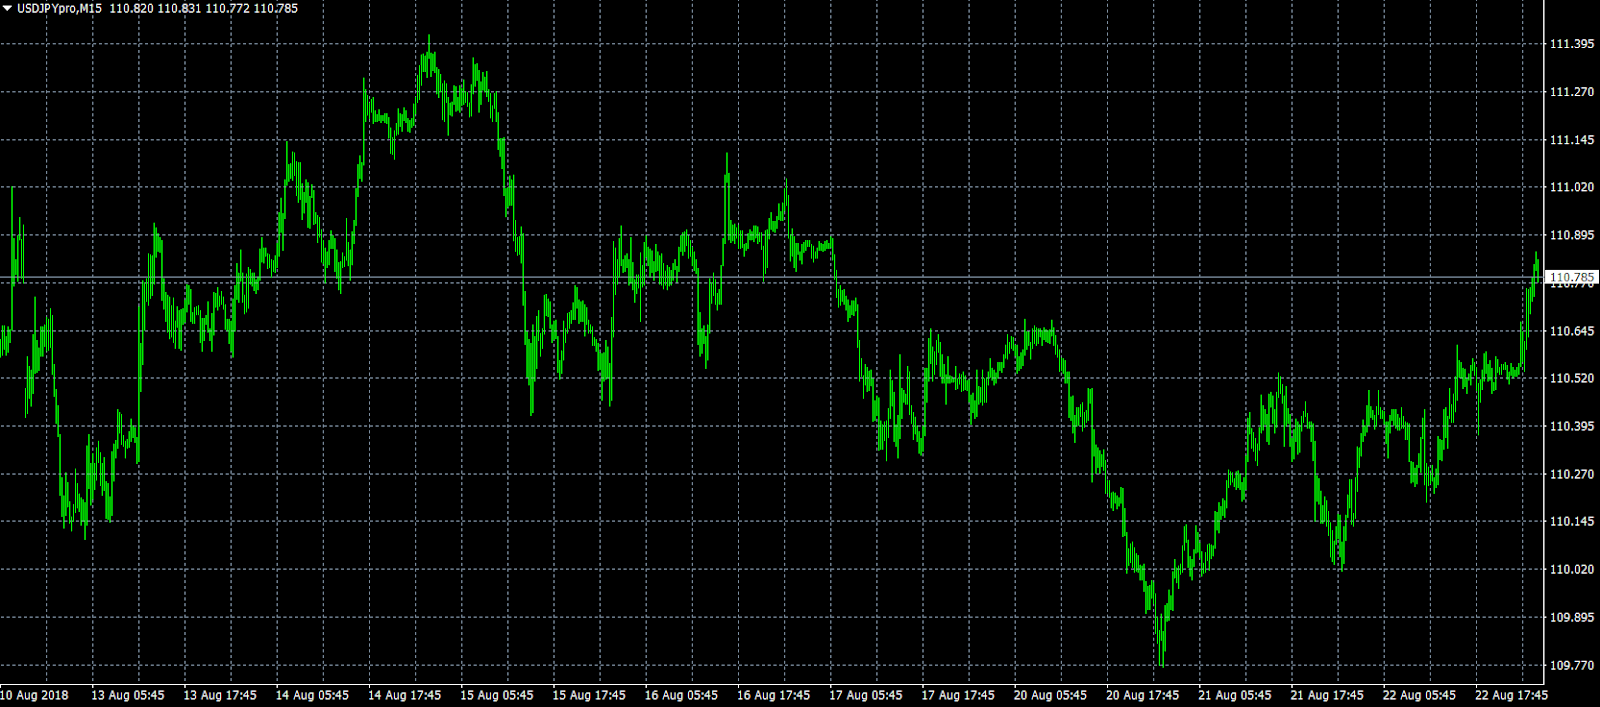
The USD/JPY continued higher on Thursday after breaking out of what appeared to be a double-top formation near 110.44. The pair is up 0.2% at 110.78, with the bulls eyeing a re-test of the 111.00 handle. With few exceptions, the USD/JPY has been virtually rangebound for the past three months. This is likely to continue in the near term.
USDJPY Finds Support At 2-Month Low, Outlook Still Bullish
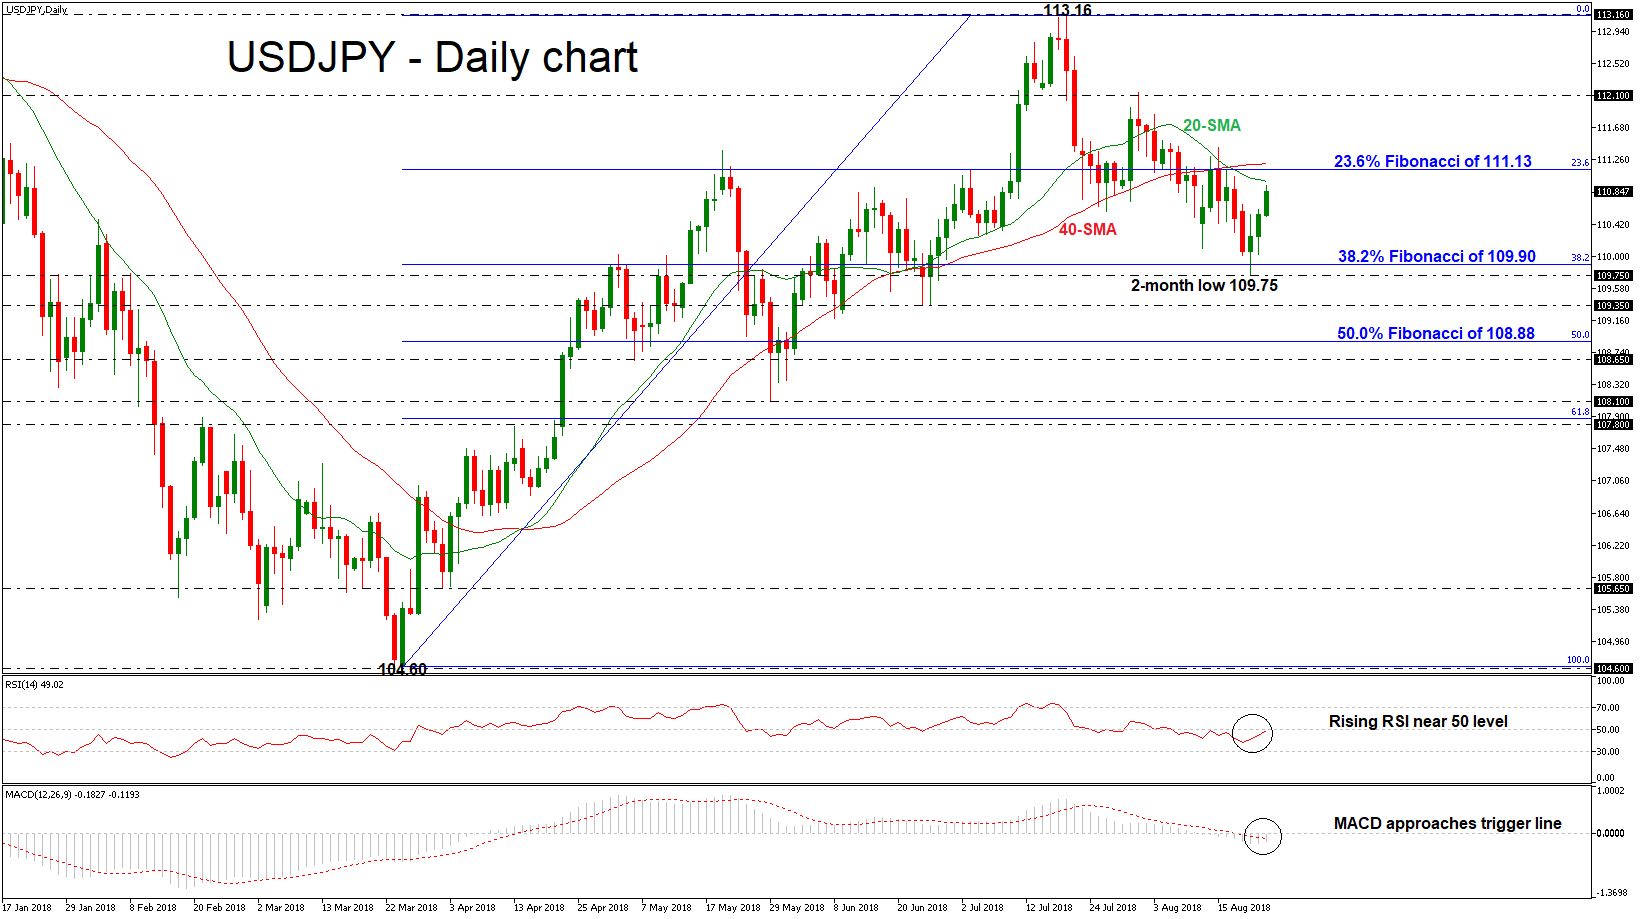
USDJPY reversed higher after touching an almost two-month low of 109.75 on August 21 but remained below the 20- and 40-day simple moving averages (SMAs). Moreover, the technical indicators showed some improvement as well, endorsing the short-term bullish structure, with the RSI edging higher towards its neutral threshold of 50 and the MACD gaining positive momentum to climb above its red-trigger line in the negative zone.
In case of further advances in the price, immediate resistance may be found near the 23.6% Fibonacci retracement level of upleg from 104.60 to 113.16, around 111.13. An upside break of that zone would open the way for the August 1 high of 112.10. If buyers manage to push above that hurdle, that could drive the pair until the 113.16 top, taken from the peak on July 19.
On the other side, if bears retake control, price declines may pause initially near the 38.2% Fibonacci mark of 109.90, which stands slightly above the 109.75 support. A bearish run below this area could take the price further down to 109.35 before it challenges the 50.0% Fibonacci of 108.88.
As regards the long-term picture, USDJPY remains mostly bullish as it holds above the 50-SMA in the weekly chart acting as a sign that the market is more likely to maintain its positive structure.
GBP/USD Reversal At 38.2% Fibonacci Resistance?
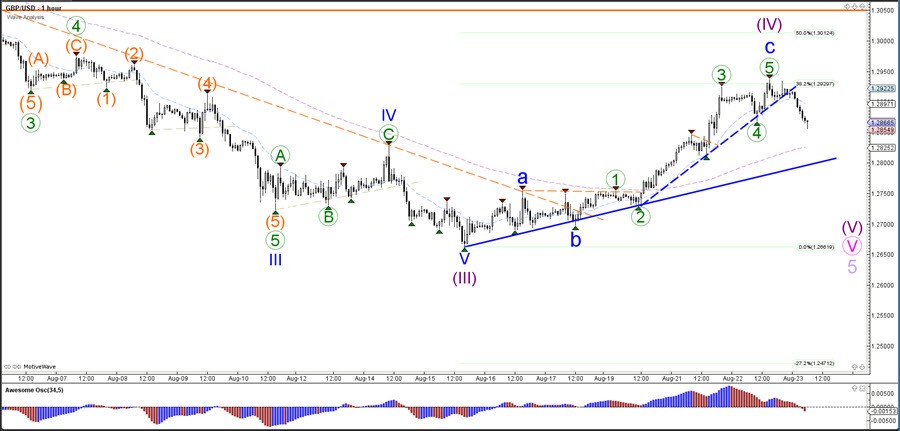
The GBP/USD showed strong bullish impulsive price action yesterday but ultimately bounced at the 38.2% Fibonacci retracement level of potential wave 4 (purple).
The GBP/USD bearish breakout below the support trend line (blue) could confirm the wave 4 pattern whereas a break above the 50% makes a bullish trend more likely.
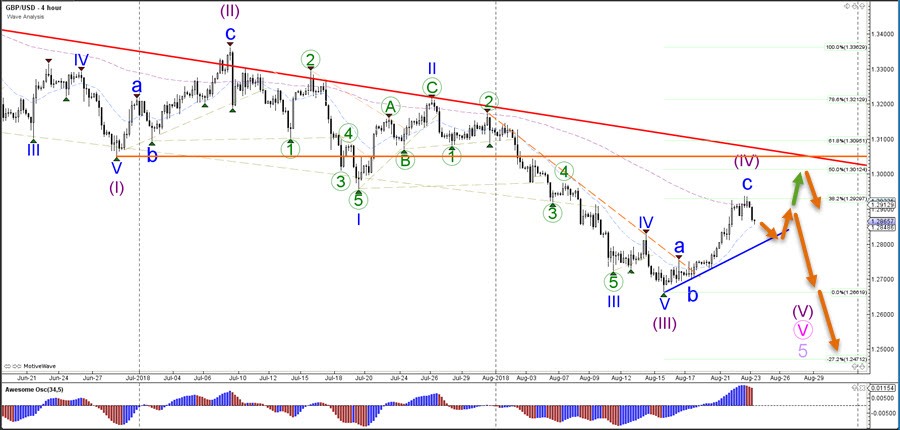
The GBP/USD seems to have completed a wave 4-5 (green) yesterday which in turn completes a potential wave C (purple) of wave 4 (purple). A bullish continuation is possible and price could reach the 50% Fibonacci level before showing a new downtrend, which is way the break of the support is a key aspect of a bearish breakout
The US Economy Keeps The Fed On Track For Higher Interest Rates
Markets
The initial risk-off reaction to the Cohen/Manafort headlines was rather quickly erased. Medium term, it raises the risk of an impeachment procedure against US President Trump, especially should Democrates retake the House and/or Senate in the November mid-term elections. Core bonds stabilized with US Treasuries slightly outperforming German Bunds. The eco calendar only contained slightly disappointing US existing home sales. FOMC Minutes as expected paved the way for a September rate hike with the Fed probably removing the notion that monetary policy is accommodative. The short term eco outlook is rosy, but most participants keep an eye on trade war risks, which could eg lead to a scaling back of investments. US yields declined by 0.4 bps (2-yr) to 1.1 bp (10-yr). The German yield curve shifted 0.9 bps (30-yr) to 2 bps (5-yr) higher. 10-yr yield spread changes vs Germany ended unchanged with Greece outperforming (-4 bps) and Italy underperforming (+6 bps). This week’s short squeeze in EUR/USD initially continued with the pair testing 1.1628 minor resistance. A break didn’t occur, with EUR/USD retracing to the 1.16 area. USD/JPY closed the session at 110.56, from a 110.31 opening. EUR/GBP tested the psychological 0.90 barrier as brexit talks between UK brexit minister Davis and EU chief negotiator Barnier continue.
Asian stock markets trade mixed overnight, in line with Wall Street yesterday evening. The S&P 500 closed flat with industrials (Dow) underperforming and the tech sector (Nasdaq) outperforming. The US Note future ekes out cautious gains, but the main trade this morning is dollar strength. EUR/USD extends yesterday’s late decline, changing hands around 1.1550. USD/JPY approaches 111 and the trade weighted dollar targets 95.50. Following Russia yesterday, US President Trump now did a veiled threat of imposing sanctions against South Africa, putting the ZAR under pressure. AUD/USD loses ground because of the political crisis which will probably end PM Turnbull’s tenure as PM.
Today’s eco calendar finally turns more interesting with EMU August PMI’s. The Juncker/Trump trade agreement was probably beneficial for sentiment event if jitters with China remain. We therefore see some upside risks to today’s PMI outcomes. Consensus expects a marginal improvement in both the manufacturing (55.2 from 55.1) and services (54.4 from 54.2) gauges. That could weigh further on the Bund and help the euro in its battle against the dollar over the key 1.1510 mark. However, Fed chair Powell probably has the final say tomorrow when he delivers a speech on the US economy and monetary policy tomorrow at Jackson Hole. EMU consumer confidence, US weekly jobless claims and US new home sales will also be published, but are of minor importance.
News Headlines
FOMC minutes of the latest Fed meeting made it clear the US economy keeps the Fed on track for higher interest rates, making it very likely for a new rate hike in September. The central bank does raise more and more concerns about their scope to battle the next recession.
Australia seems to be in need of a new Prime Minister, as current PM Malcolm Turnbull has lost support in parliament and within his Liberal party. Three of Turnbull’s key cabinet supporters stepped down this morning, paving the way for a fifth leadership contest in six years, pushing the Australian Dollar lower overnight. AUD/USD drops below 0.73.
The US and China entered a new phase in the trade war, as new 25% tariffs on $16 billion worth of goods were put in place this morning. The new tariffs brings the total of targeted goods now to $50 billion, despite the renewed trade talks between the two countries that kicked off yesterday.
GBP/JPY Daily Outlook
Daily Pivots: (S1) 142.23; (P) 142.52; (R1) 143.04; More...
With 141.32 minor support intact, rebound from 139.88 short term bottom could extend higher to 55 day EMA (now at 144.86). However, on the downside, below 141.32 minor support will likely extend larger down trend and turn focus back to 139.29/47 key support zone instead.

In the bigger picture, at this point decline from 156.59 is still seen as a corrective move. But the current downside accelerate makes this view shaky. Focus will be on 139.29 cluster support (50% retracement of 122.36 to 156.59 at 139.47). Strong rebound from there will re-affirm the bullish case that rise from 122.36 is still to extend through 156.59 high. However, sustained break of 139.29/47 should confirm medium term reversal. GBP/JPY would then target a retest on 122.26 (2016 low).

EUR/JPY Daily Outlook
Daily Pivots: (S1) 127.60; (P) 127.93; (R1) 128.54; More....
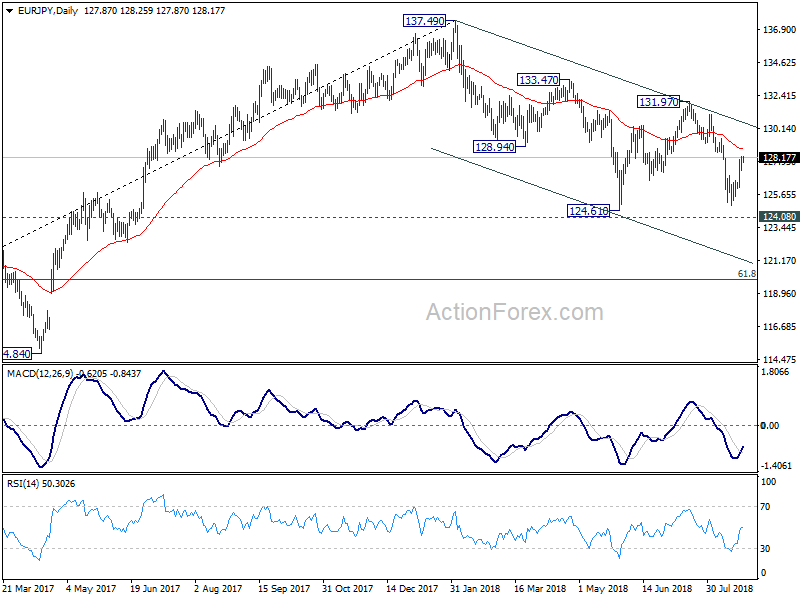
With 126.60 minor support intact, further rise is expected in EUR/JPY for 55 day EMA (now at 128.78). Sustained trading above there will target 131.97 key resistance next. On the downside, below 126.60 minor support will bring retest of 124.61/89 support zone instead.
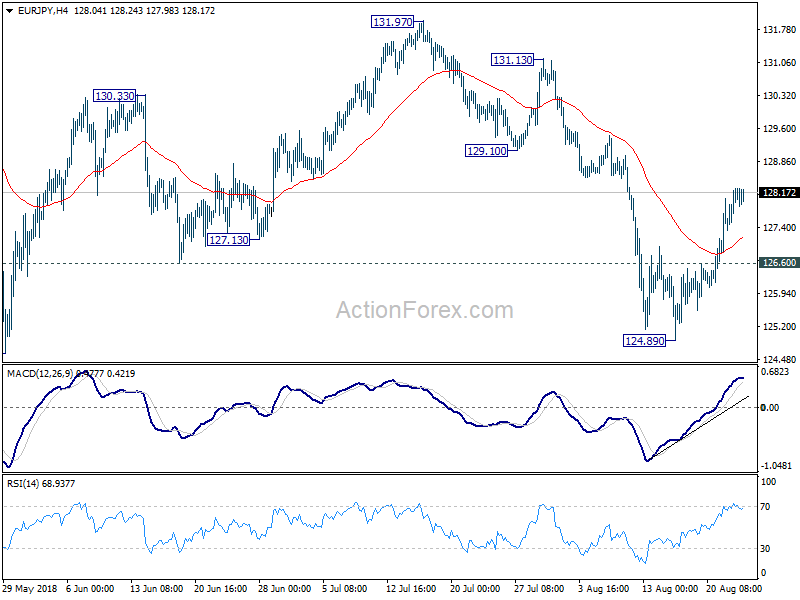
In the bigger picture, focus is back on 124.08 key resistance turned support. Decisive break there will argue that whole rise from 109.03 (2016 low) has completed at 137.49. Deeper decline would be seen to 61.8% retracement of 109.03 to 137.49 at 119.90 next. Sustained break there will pave the way to 109.03 and below. Meanwhile, rebound from 124.08 will keep medium term bullishness intact for another high above 137.49.