Sample Category Title
USDJPY Outlook – Consolidation Above Daily Cloud Base
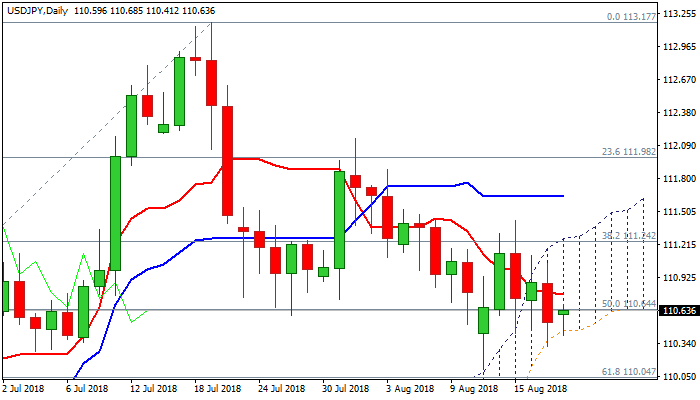
The pair holds in green on Monday and consolidating above daily cloud base which contained Friday’s fall.
Cloud base lays at 110.45 and marks pivotal support, break of which would expose psychological 110 support, reinforced by Fibo 61.8% of 108.11/113.17 ascend and nearby 100/200SMA, which created bull-cross.
Rising bearish momentum and MA’s mainly in bearish setup, keep the downside at risk, but the pair may hold in extended consolidation while above cloud base.
Falling 10SMA (110.87) which formed bear-cross with 55SMA, should keep the upside protected.
Res: 110.68, 110.87, 111.28, 111.64
Sup: 110.31, 110.00, 109.87, 109.30
Elliott Wave Analysis: EURUSD Trading Bearish
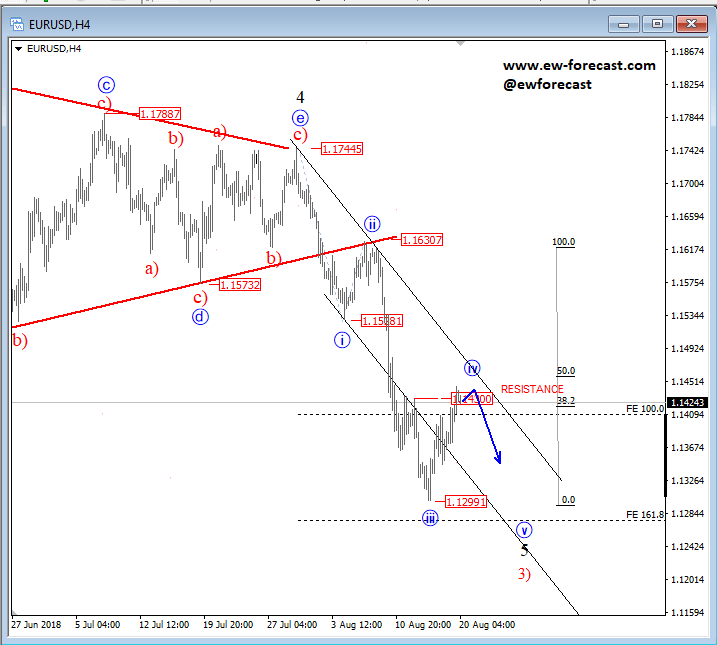
Euro had a very bad week; price fell sharply against the US currency which is seen very strong and possibly ready for more gains. Notice that leg down from 1.1630 is extremely sharp so it was wave three that slowed down at 161.8% Fib. target so we see pair rallying into wave four now that can slow down around 1.1430 resistance. Invalidation level is at 1.1530; trend is down as long it holds, but sooner or later much deeper corrective recovery will show up since that break down from a triangle will sooner or later come to an end.
EURUSD, 4h
Greece completes three year bailout program, begins a new chapter
European Commission formally announced the conclusion of the three-year stability support program for Greece and "a new chapter" begins. In the statement, EC hailed that "The successful conclusion of the programme is a testament to the efforts of the Greek people, the country's commitment to reform, and the solidarity of its European partners."
European Commission President Jean-Claude Juncker said: "The conclusion of the stability support programme marks an important moment for Greece and Europe. While their European partners have demonstrated their solidarity, the Greek people have responded to every challenge with a characteristic courage and determination. I have always fought for Greece to remain at the heart of Europe. As the Greek people begin a new chapter in their storied history, they will always find in me an ally, a partner and a friend."
Pierre Moscovici, Commissioner for Economic and Financial Affairs, Taxation and Customs, said: "The conclusion of the stability support programme is good news for both Greece and the euro area. For Greece and its people, it marks the beginning of a new chapter after eight particularly difficult years. For the euro area, it draws a symbolic line under an existential crisis. The extensive reforms Greece has carried out have laid the ground for a sustainable recovery: this must be nurtured and maintained to enable the Greek people to reap the benefits of their efforts and sacrifices. Europe will continue to stand by Greece's side."
Bundesbank: German growth on sound path, private consumption as linchpin
German Bundesbank noted in the latest monthly report that "economic boom in Germany was still ongoing". In Q2, private consumption "continued its ascent" and was the "linchpin of economic growth". Government consumption also rose "significantly". Exports grew "moderately" following a drop at the start of the year.
Bundesbank expected the economy to "remain on a sound growth path" in Q3 even though the pace could slow from H1. Industry is not expected to make any meaningful contribution to aggregate growth. On the other hand, private consumption remains a key growth driver due to "excellent labour market situation and the current strong wage hikes"
For Eurozone, "the unabatedly positive sentiment among businesses and consumers suggests that the economic upturn in the euro area will continue".
The Analytical Overview Of The Main Currency Pairs
The EUR/USD currency pair
Technical indicators of the currency pair:
Prev Open: 1.13752
Open: 1.14375
% chg. over the last day: +0.54
Day's range: 1.14361 – 1.14394
52 wk range: 1.0571 – 1.2557
On Friday, the bullish sentiment was observed on the EUR/USD currency pair. Financial market participants began to fix short positions after the continuous rally of the US currency. At the moment, the key support and resistance levels are 1.14000 and 1.14400, respectively. We recommend opening positions from these marks. The trading instrument has the potential for further growth. Trade negotiations between the US and China are in the focus of attention.
The news feed on the US economy and the Eurozone is calm.
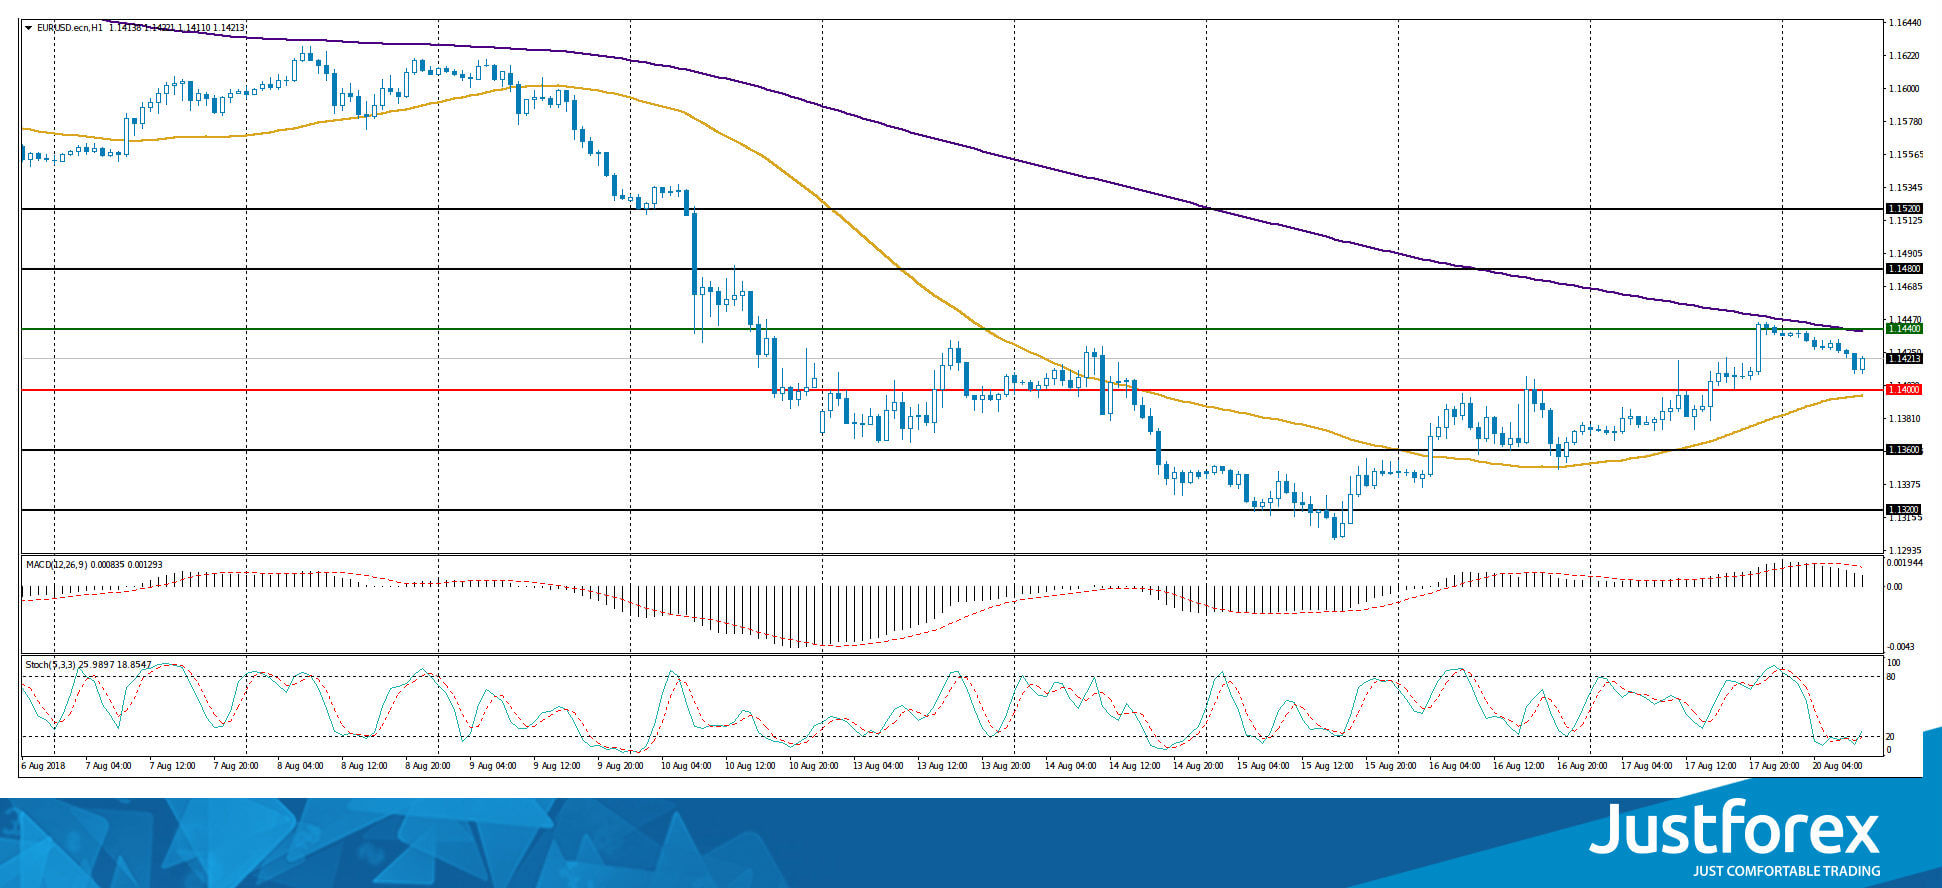
Indicators do not send accurate signals: the price has fixed between 50 MA and 200 MA.
The MACD histogram is located in the positive zone, but below the signal line, which gives a weak signal to buy EUR/USD.
Stochastic Oscillator is in the oversold zone, the %K line is crossing the %D line. There are no accurate signals.
Trading recommendations
Support levels: 1.14000, 1.13600, 1.13200
Resistance levels: 1.14400, 1.14800, 1.15200
If the price fixes above the resistance level of 1.14400, further growth of the EUR/USD currency pair is expected. The movement is tending to 1.14800-1.15000.
Alternative option. If the price fixes below the round level of 1.14000, it is necessary to look for entry points to the market to open short positions. The movement is tending to 1.13600-1.13400.
The GBP/USD currency pair
Technical indicators of the currency pair:
Prev Open: 1.27066
Open: 1.27423
% chg. over the last day: +0.26
Day's range: 1.27405 – 1.27493
52 wk range: 1.2361 – 1.4345
The technical pattern on the GBP/USD currency pair is ambiguous. At the moment, quotes are in a sideways trend. The key support and resistance levels are 1.27200 and 1.27600, respectively. In the near future, we expect correction of the GBP/USD currency pair. Positions should be opened from the key levels.
The news feed on the UK economy is calm.
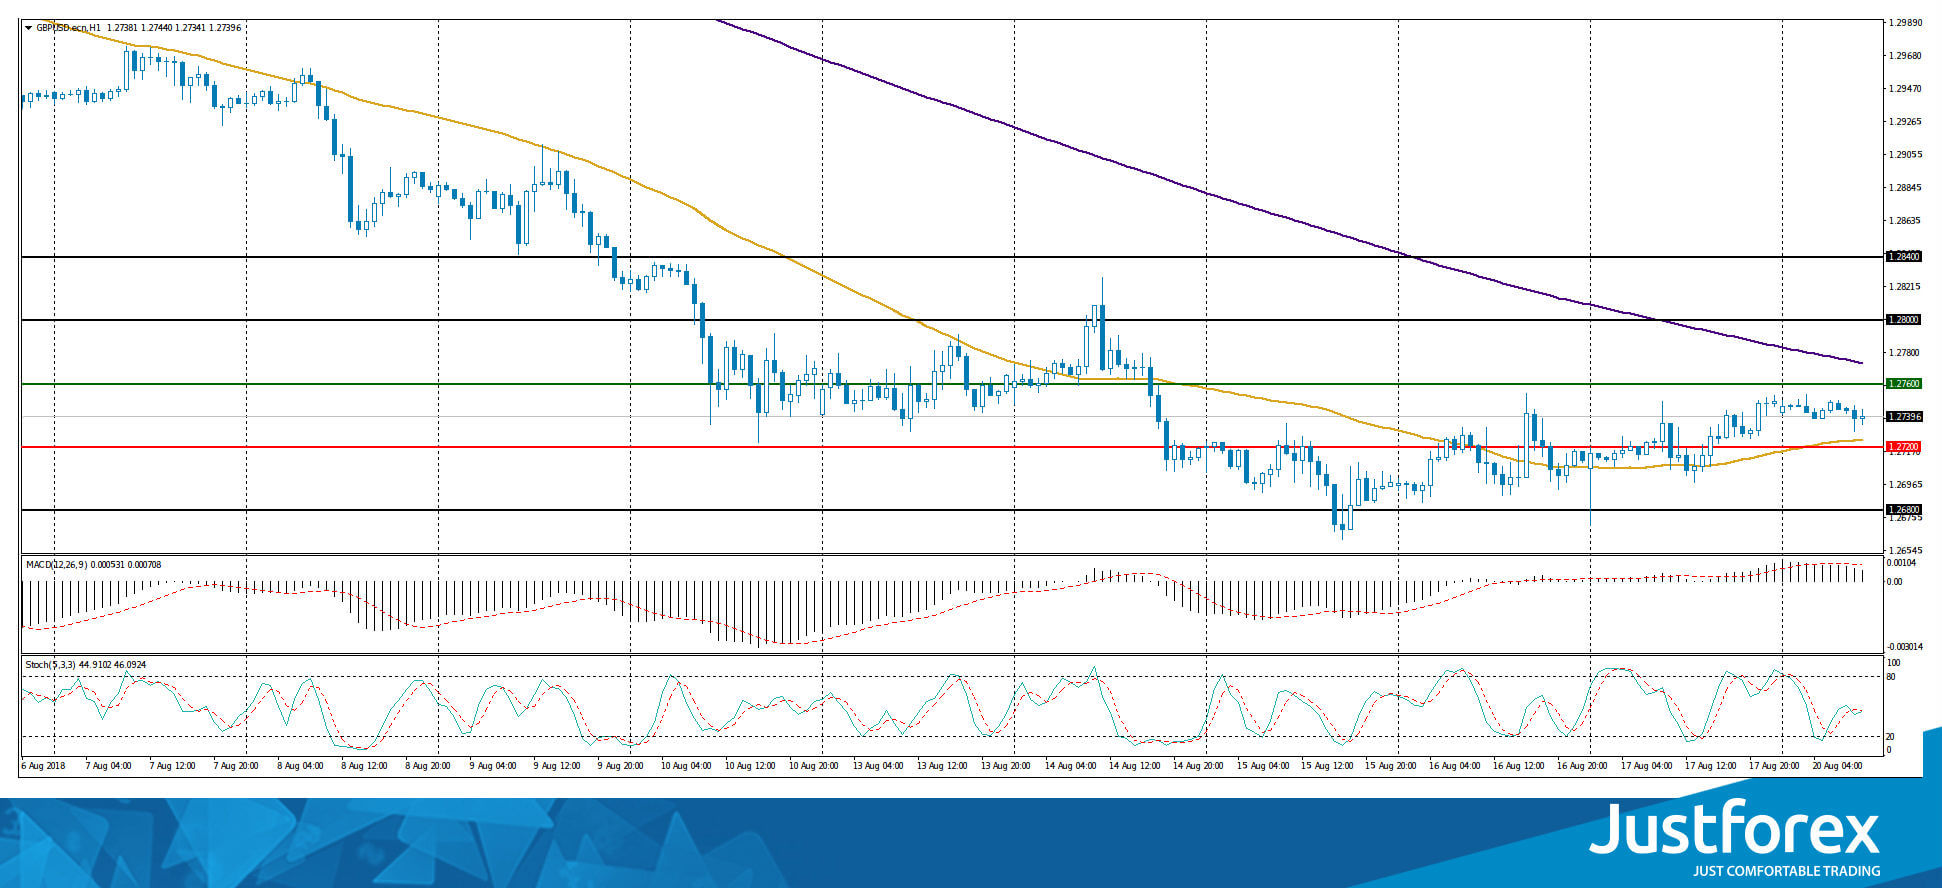
Indicators do not send accurate signals: the price has fixed between 50 MA and 200 MA.
The MACD histogram is in the positive zone, but below the signal line, which gives a weak signal to buy GBP/USD.
Stochastic Oscillator is located in the neutral zone, the %K line is crossing the %D line. There are no accurate signals.
Trading recommendations
Support levels: 1.27200, 1.26800
Resistance levels: 1.27600, 1.28000, 1.28400
If the price fixes above 1.27600, the GBP/USD currency pair is expected to grow. The target movement level is 1.28000-1.28400.
An alternative may be decrease of the GBP/USD quotes to 1.26800-1.26600.
The USD/CAD currency pair
Technical indicators of the currency pair:
Prev Open: 1.31537
Open: 1.30598
% chg. over the last day: -0.71
Day's range: 1.30598 – 1.30708
52 wk range: 1.2059 – 1.3795
On Friday, there were aggressive sales on the USD/CAD currency pair. The decrease in quotes exceeded 100 points. At the moment, financial market participants expect additional drivers. Local support and resistance levels are 1.30500 and 1.30800, respectively. We recommend opening positions from these marks. The trading instrument has the potential for further reduce.
Publication of important news is not expected in Canada.
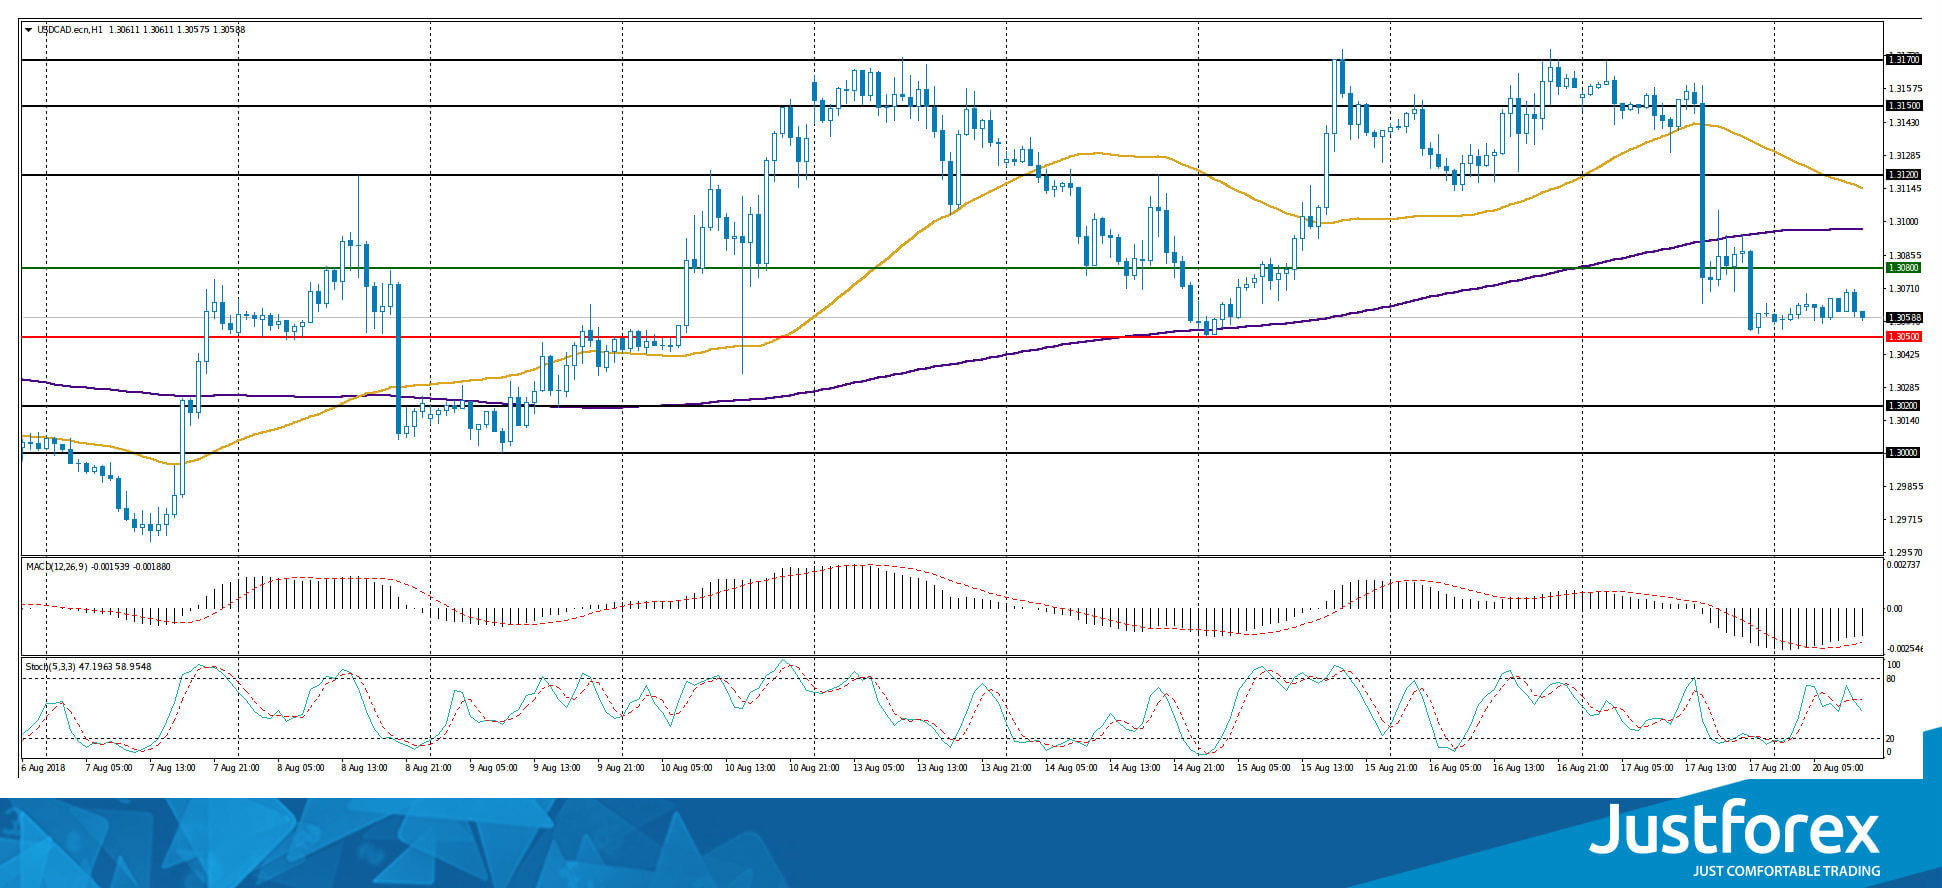
Indicators point to the power of sellers: the price has fixed below 50 MA and 200 MA.
The MACD histogram is in the negative zone, but above the signal line, which gives a weak signal to sell USD/CAD.
Stochastic Oscillator is located in the neutral zone, the %K line crossed the %D line. There are no accurate signals.
Trading recommendations
Support levels: 1.30500, 1.30200, 1.30000
Resistance levels: 1.30800, 1.31200, 1.31500
If the price fixes below 1.30500, the USD/CAD quotes are expected to decline. The movement is tending to 1.30200-1.30000.
Alternative option. If the price fixes above the resistance of 1.30800, it is necessary to consider purchases of USD/CAD. The movement is tending to 1.31200-1.31500.
The USD/JPY currency pair
Technical indicators of the currency pair:
Prev Open: 110.870
Open: 110.593
% chg. over the last day: -0.35
Day`s range: 110.591 – 110.684
52 wk range: 104.56 – 114.74
On Friday, the bearish sentiment was observed on the USD/JPY currency pair. The decrease in quotes exceeded 60 points. At the moment, the trading instrument is in a sideways trend. Local support and resistance levels are 110.450 and 110.700, respectively. The positions should be opened from these marks. Financial market participants expect additional drivers.
The news feed on the economy of Japan is calm.
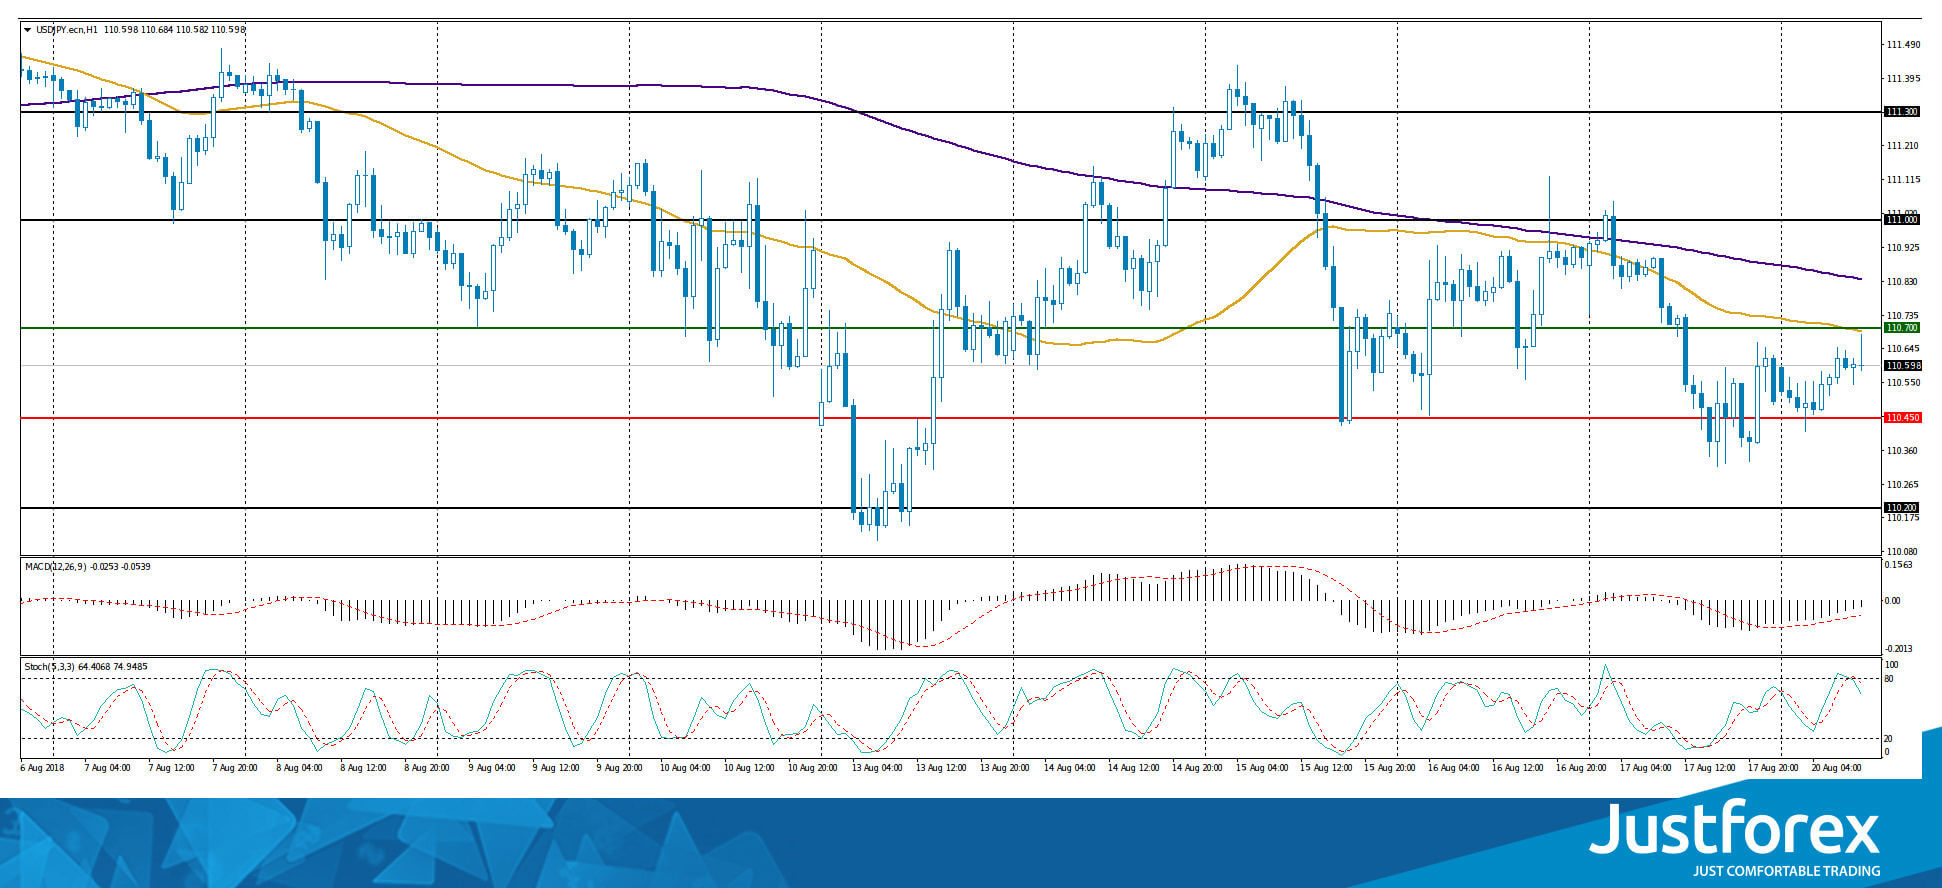
Indicators point to the power of sellers: the price has fixed below 50 MA and 200 MA.
The MACD histogram is in the negative zone, but above the signal line, which gives a weak signal to sell USD/JPY.
Stochastic Oscillator is located near the overbought zone, the %K line is below the %D line, which gives a strong signal to sell USD/JPY.
Trading recommendations
Support levels: 110.450, 110.200
Resistance levels: 110.700, 111.000, 111.300
If the price fixes above the resistance level of 110.700, the USD/JPY currency pair is expected to grow. The movement is tending to 111.000-111.300.
Alternative option. If the price fixes below the level of 110.450, it is necessary to consider sales of USD/JPY. The movement is tending to 110.200-110.000.
Daily Trends: EURUSD, GBPUSD, Gold, Brent
EURUSD
EURUSD is trading near 1.1420, losing 0.2% from the beginning of the day after an impressive growth on Friday from 1.1370 to 1.1440. The growth on Friday was largely associated with upward correction after a strong decline. According to technical analysis, despite the increase in EURUSD on Thursday and Friday, the bearish trend remains in effect while the pair is trading below 1.1500 level.
GBPUSD
The British currency is trading near 1.2740, adding about 0.6% to the lows at 1.2660. The current stabilization of the rate, accompanied by strong macroeconomic releases from last week can allow the GBPUSD pair to get out of the oversold area by RSI, that would be a strong bullish signal.
Gold
Gold is actively recovering after a fall in the middle of last week. Currently, Gold is near $1187 after the fall to 1160, the lows from January 2017.
Brent
Brent Crude Oil rose to $72 following the growing demand for risks at the Asian bourses. Technically, oil bounces off the bottom of the downstream channel, so there is don’t excluded an unexpected return to decline. Among the data it is worth to mention that drilling activity in the USA keeps its pace previous week. The number of operating rigs has not changed over the last week, having remained at the level of 1057 items.
Gold Pares Losses After Hitting 1,160 In Near Term
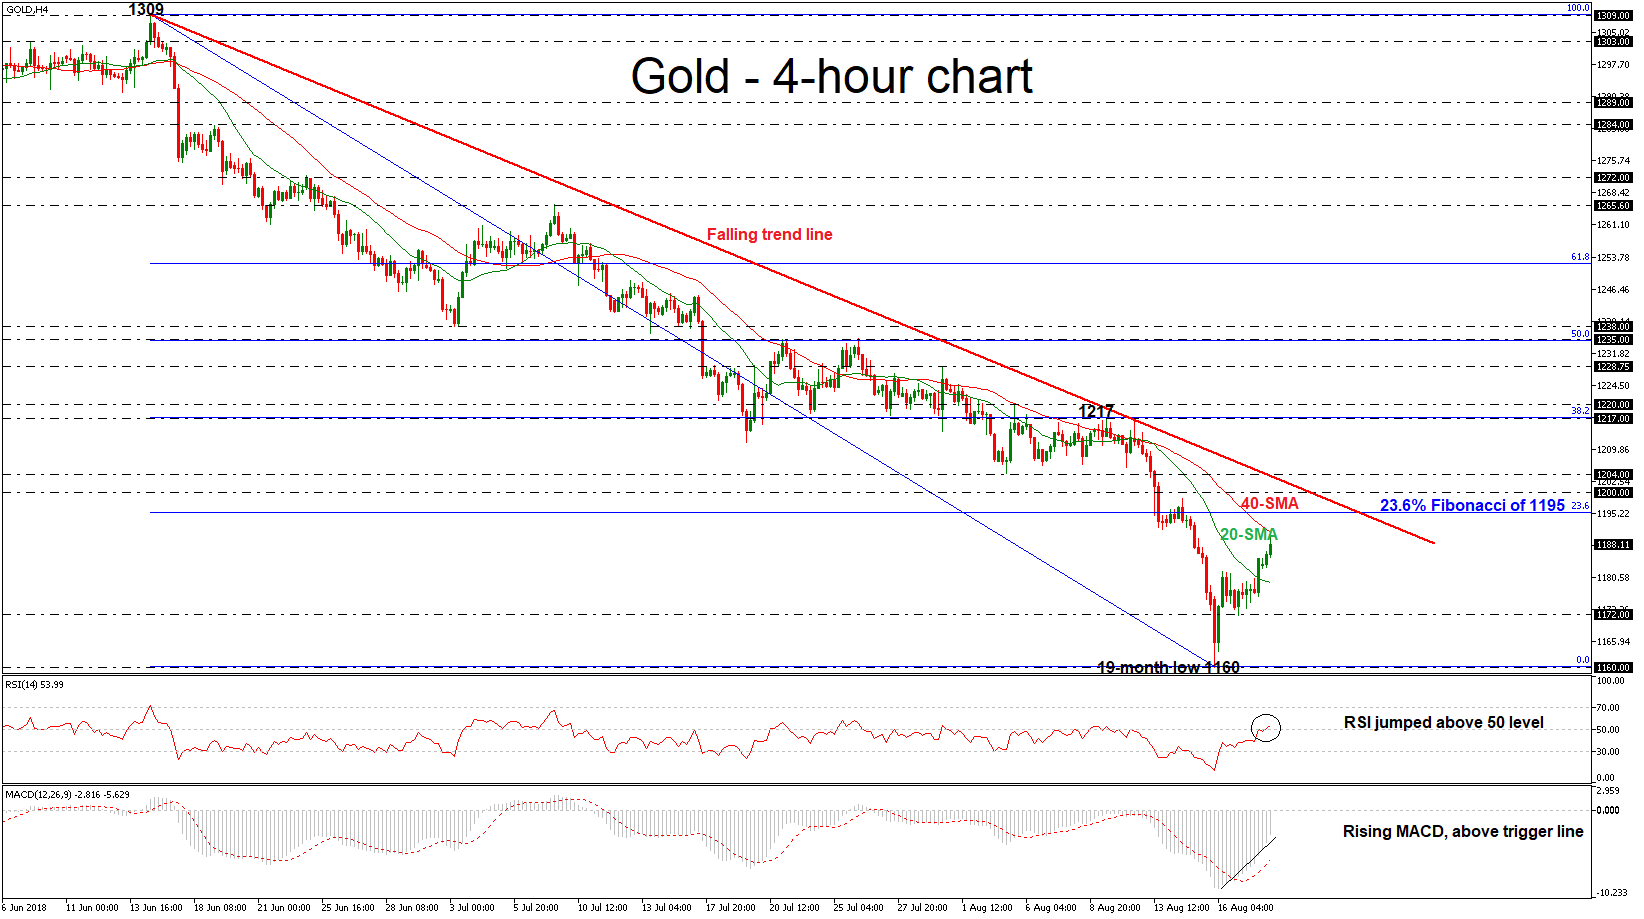
Gold prices edge higher today and are set to post the second bullish day in a row. In the previous week, the precious metal hit a fresh 19-month low of 1,160 before heading higher. Also, the price advanced above the 20-simple moving average (SMA) in the 4-hour chart and is currently approaching the 40-SMA, with the technical indicators showing some improvement as well; the Relative Strength Index (RSI) climbed into positive territory, above the 50 level but not much, and the MACD oscillator continues the upward rally above its red-trigger line, indicating that positive momentum could hold in the short-term.
If prices continue to head higher, resistance could come from the 23.6% Fibonacci retracement level of the downleg from 1,309 to 1,160, around 1,195. A jump above this region, would reinforce the short-term bullish view and open the way towards the 1,200 psychological level.
However, should a downside movement take form again, immediate support will likely come from the 20-SMA near 1,179. Further losses could drive gold until the 1,172 before being able to challenge the 19-month low of 1,160.
Overall, the outlook remains negative since prices hold below all the moving average lines and the bearish cross between the 50- and the 200-day SMA stays in place.
Fed Can Form A New Basis For EM Currencies Outflow
Asian bourses remain moderately optimistic since the end of last week. Expectations are encouraging that the Chinese and Turkish authorities should be able to find economic support measures and stabilise the exchange rates of their currencies. Beijing defended its currency from a decline to 7.0 for the dollar last week, and also already offered to the US a meeting for trade negotiations this week.
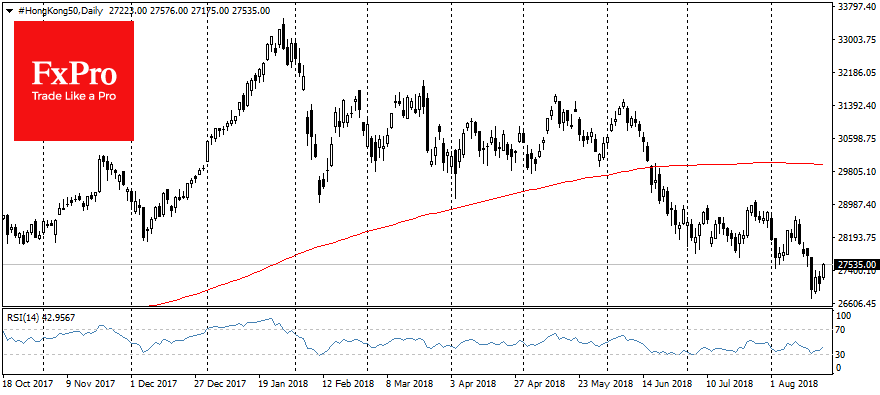
As a result, Asian markets add about 0.3% this morning and CNH traded on 6.84, below last Wednesday peak near 6.96. Turkish lira has stabilised near 6.0 for Dollar from the end of trading on Friday, despite the decline of sovereign ratings from S&P and Moody's. 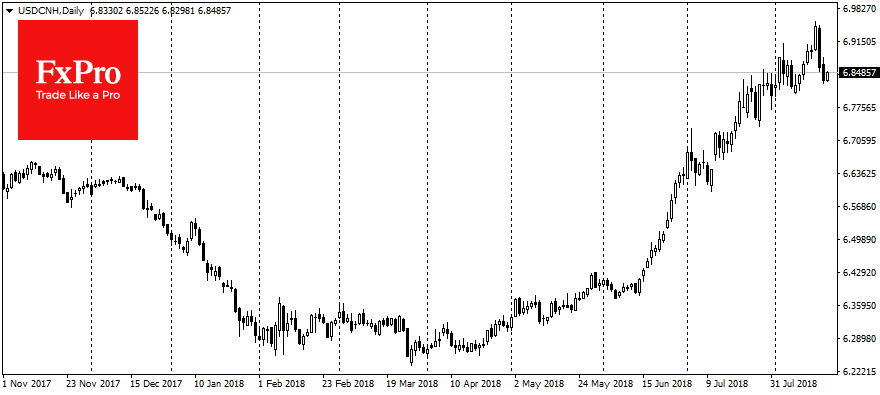
Most likely, the deterioration of ratings will exert additional pressure on Turkish assets in coming days. Turkish authorities bought some time with promises of decisive steps, but in most cases the outflow of investors from the country's assets continues for several months, even if the authorities manage to contain panic. Most likely the “bottom” of the Turkish crisis is just ahead.
Players on the dollar, however, fixed the profit from the previous strengthening of the American currency. The dollar index lost 0.9% in the second half of the week, more than half of which had to be on Friday. However, this week markets focus will shift on the comments from developed countries central banks.
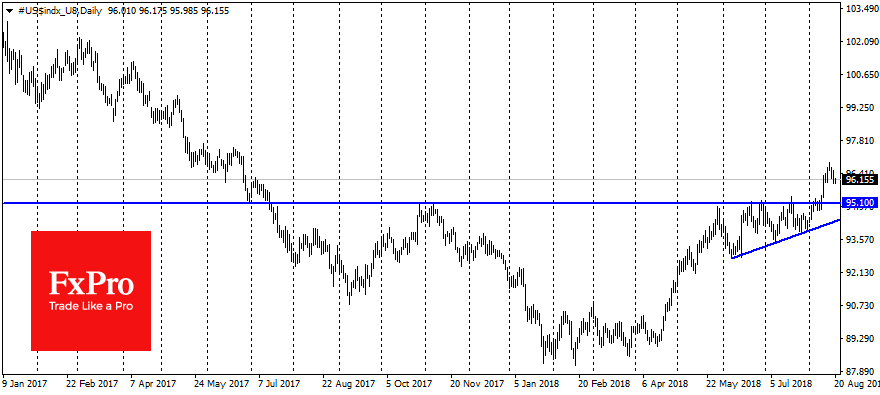
In particular, this week the Fed and ECB will publish their previous meetings minutes. Also at the end of the week attention will be focused on Powell’s comments as part of the central symposium at Jackson Hole. Fresh assessments of recent developments on EM can have a serious impact on the dollar, as investors will be able to look at how this would affect the Fed’s plans.
The latest episode with the markets of developing countries is a clear indication of the fragility of the markets currently and the vulnerability of the world economy to a further slowdown. If the Fed continues to focus only on internal indicators, it can lay the groundwork for a new wave of outflow from developing countries and develop the current momentum of strengthening the dollar by making it a safe-haven asset in times of turbulence in markets.
GBPUSD Outlook – Larger Bears Could Be Further Delayed On Break Above Falling 10SMA
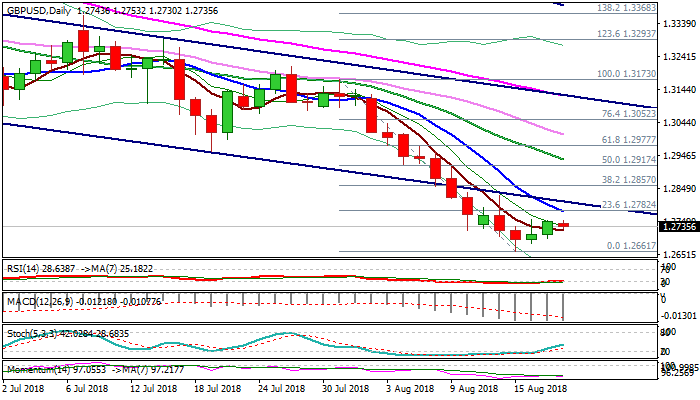
Cable is consolidating within narrow range on Monday, following two-day recovery rally from last week's low at 1.2661 (the lowest since late June 2017).
Larger downtrend from 1.4376 (17 Apr peak) is taking a breather (signaled by last week's long-legged Doji), but overall picture remains bearish and favors further downside.
Bearish setup of daily MA's and negative momentum studies support the notion.
Falling 10SMA (1.2779) marks key barrier which is expected to limit recovery, while sustained break here would signal extended consolidation and open way towards next strong barrier at 1.2857 (Fibo 38.2% of 1.3173/1.2661 bear-leg).
Res: 1.2779, 1.2810, 1.2857, 1.2917
Sup: 1.2723, 1.2697, 1.2685, 1.2661
Forex Technical Analysis: EUR/USD, USD/JPY, GBP/USD
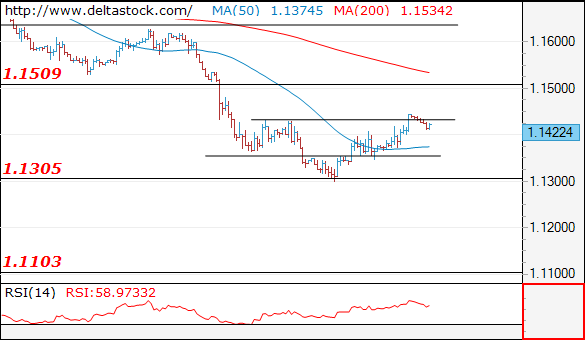
EUR/USD
Current level - 1.1422
The intraday bias is positive, for a tight test of 1.1510 resistance area. Crucial on the downside is 1.1350.
| Resistance | Support | ||
| intraday | intraweek | intraday | intraweek |
| 1.1510 | 1.1510 | 1.1340 | 1.1300 |
| 1.1510 | 1.1750 | 1.1300 | 1.1100 |
USD/JPY
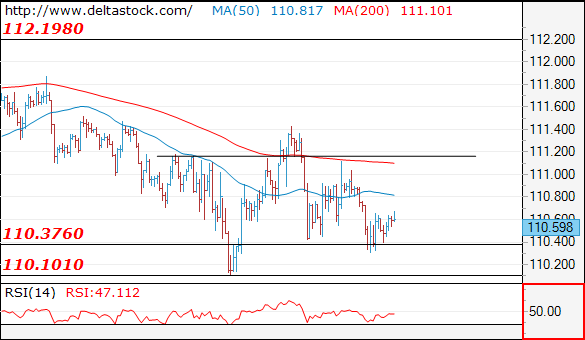
Current level - 110.59
The outlook remains bearish below 110.80, for a dip to 110.10. Crucial on the upside is 111.10.
| Resistance | Support | ||
| intraday | intraweek | intraday | intraweek |
| 110.80 | 114.50 | 110.40 | 110.10 |
| 112.10 | 114.50 | 110.10 | 109.30 |
GBP/USD
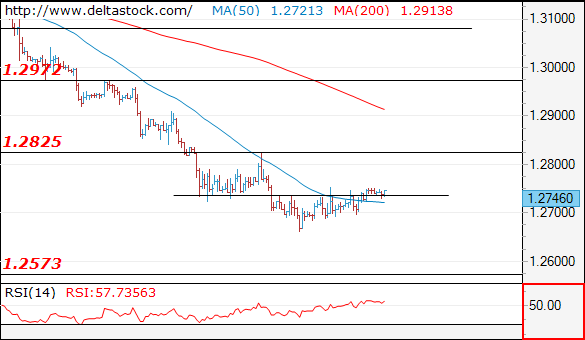
Current level - 1.2746
I favor a break through 1.2750 to provoke a rise towards 1.2830 zone. Crucial on the downside is 1.2690.
| Resistance | Support | ||
| intraday | intraweek | intraday | intraweek |
| 1.2750 | 1.2970 | 1.2690 | 1.2570 |
| 1.2830 | 1.3210 | 1.2570 | 1.2570 |