Sample Category Title
XAUUSD Intraday Analysis
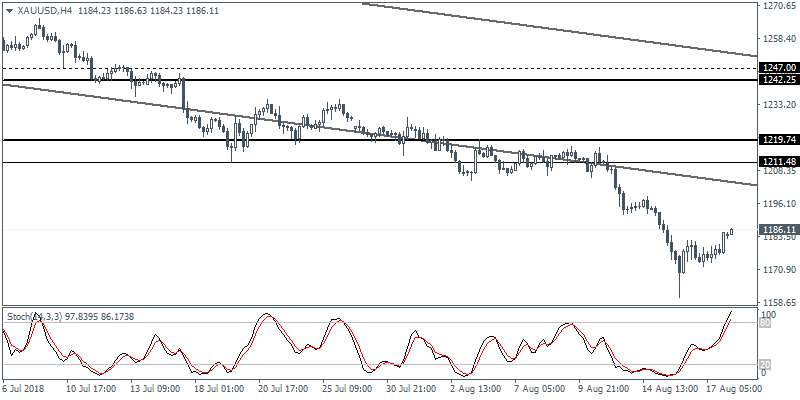
XAUUSD (1186.11): Gold prices fell to fresh yearly lows last week. However, price action managed to pull back from the lows, turning slightly bullish by Friday's close. Although it is still too premature to expect to see a retracement, watching for a higher low could validate this bias. In the near term, Gold prices could be seen retesting the recently breached support/resistance level at 1219.75 - 1211.50 region. Ahead of the gains, the 1200.00 level of resistance could put a lid on the gains. To the downside, a breakdown below the previous lower close could trigger further declines to 1150.00.
USDJPY Intraday Analysis
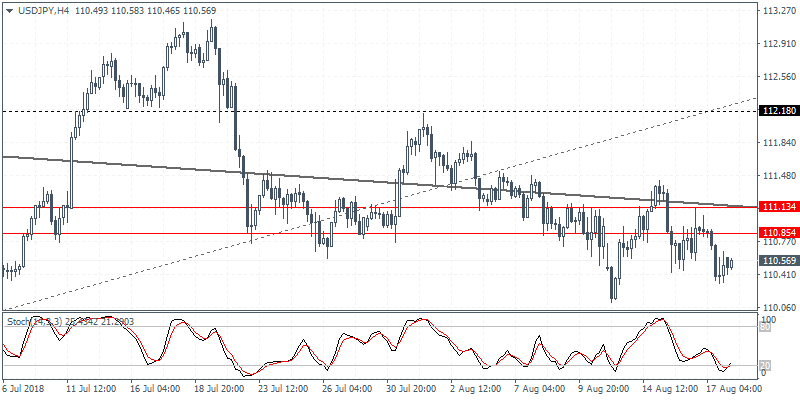
USDJPY (110.56): The U.S. dollar was seen closing with a bearish candlestick on Friday. However, price action continues to maintain the sideways trend with the declines being only gradual. On the 4-hour chart, price action cleared below the support level of 111.13 - 110.85 level. We expect to see further consolidation taking place at this level. In the event that price fails to breakout above 111.13 - 110.85 region, we expect the declines to push USDJPY lower toward 109.45 level of support.
EURUSD Intraday Analysis
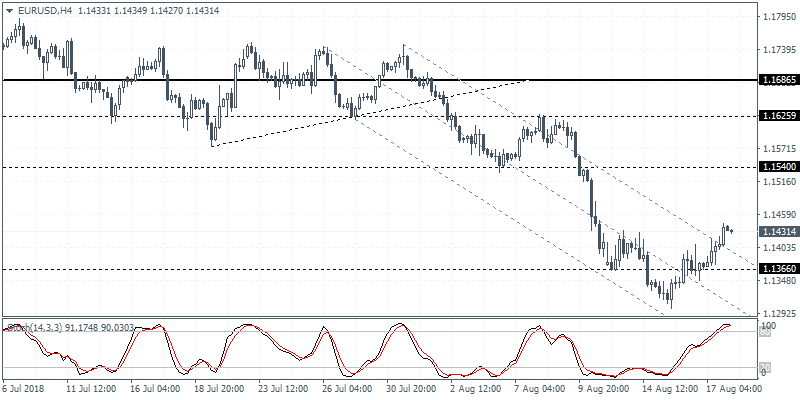
EURUSD (1.1431): The EURUSD currency pair was seen posting gains on Friday, extending the gains from Thursday. Price action posted a strong rebound off the 1.1339 - 1.1400 level. The breakout from the median line indicates a potential retracement to the upside. Following the breakout above 1.1366, the EURUSD is expected to post a modest decline to form a higher low. This could potentially mark the start of the correction to the upside. The next main resistance is seen at 1.1540 which could be tested in the near term.
USD Eases From Fresh Highs
The U.S. dollar was seen easing back from the strong gains made earlier in the week. By Friday's close, the U.S. dollar index was seen giving up the gains and closed near 95.99.
Economic data on Friday saw the release of the final inflation figures from the Eurozone. Data showed that consumer prices rose 2.1% on the headline inflation while core inflation rate also gained 1.1% as estimated.
Canada's monthly inflation report showed a 0.5% surge beating estimates of 0.1%. All other measures of inflation were also seen pushing higher.
The economic calendar today is light. The European trading session starts off with the monthly report from the German Bundesbank followed by a speech from the Bundesbank president, Jens Weidmann.
The NY session is quiet with only the FOMC member Bostic due to speak in the afternoon.
GBP/JPY Daily Outlook
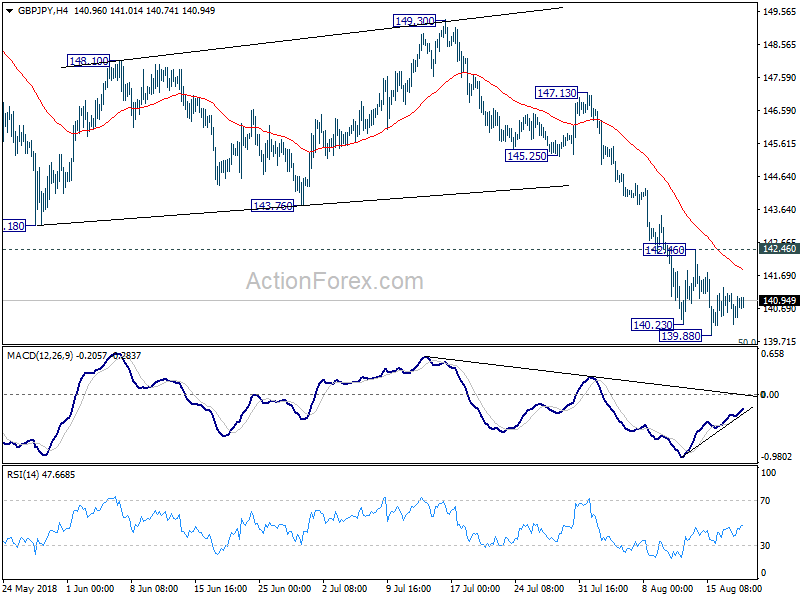
Daily Pivots: (S1) 140.36; (P) 140.76; (R1) 141.31; More...
Intraday bias in GBP/JPY remains neutral for consolidation above 139.88 temporary low. But as long as 142.46 minor resistance intact, , deeper fall is still in favor. Sustained break of 139.29/47 key support zone will carry larger bearish implication and target 135.58 support next. Though, break of 142.46 will indicate short term bottoming, on bullish convergence condition in 4 hour MACD. Intraday bias will be turned back to the upside for stronger rebound.
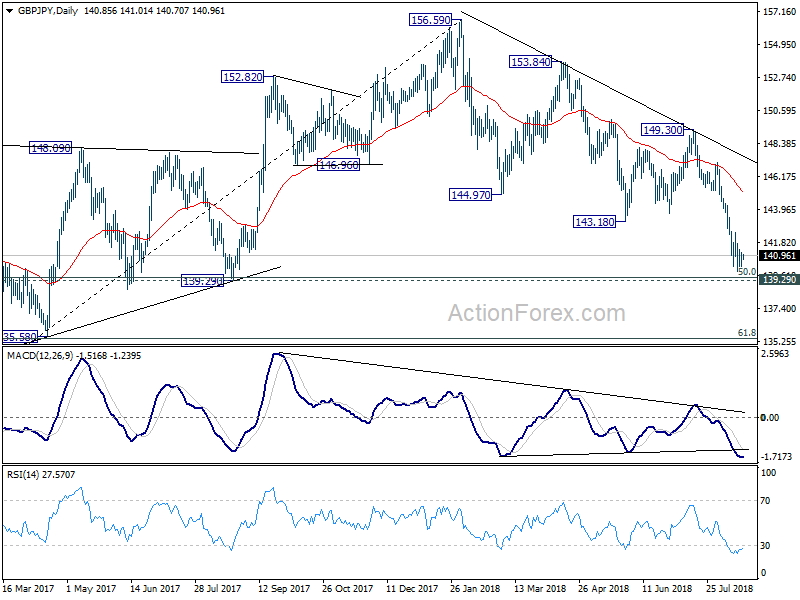
In the bigger picture, at this point decline from 156.59 is still seen as a corrective move. But the current downside accelerate makes this view shaky. Focus will be on 139.29 cluster support (50% retracement of 122.36 to 156.59 at 139.47). Strong rebound from there will re-affirm the bullish case that rise from 122.36 is still to extend through 156.59 high. However, sustained break of 139.29/47 should confirm medium term reversal. GBP/JPY would then target a retest on 122.26 (2016 low).
Sentiment Of The Financial Market Participants Turned Up
On Friday, the US currency weakened against the basket of major currencies after it had become known that China and the US intended to resolve the trade conflict. Negotiations between the countries should be held this week on Wednesday and Thursday, August 22-23. The US dollar index (#DX) closed in the negative zone (-0.58%). Currency majors are tending to recover.
Also this week, Thursday to Saturday, the international economic conference will take place in Jackson Hole, where the Federal Reserve Chairman Jerome Powell will give a speech. Experts hope to receive clues from the leaders of central banks regarding further courses of monetary policies. Investors also expect the publication of FOMC protocols on Wednesday, August 22.
The "black gold" prices are moderately declining. At the moment, futures for the WTI crude oil are testing a mark of $65.20 per barrel.
Market Indicators
On Friday, the bullish sentiment was observed in the US stock market: #SPY (+0.35%), #DIA (+0.22%), #QQQ (+0.02%).
At the moment, the 10-year US government bonds yield is at the level of 2.86%-2.87%.
The news feed on 2018.08.20:
Today, important economic data are not expected to be published.
EUR/JPY Daily Outlook
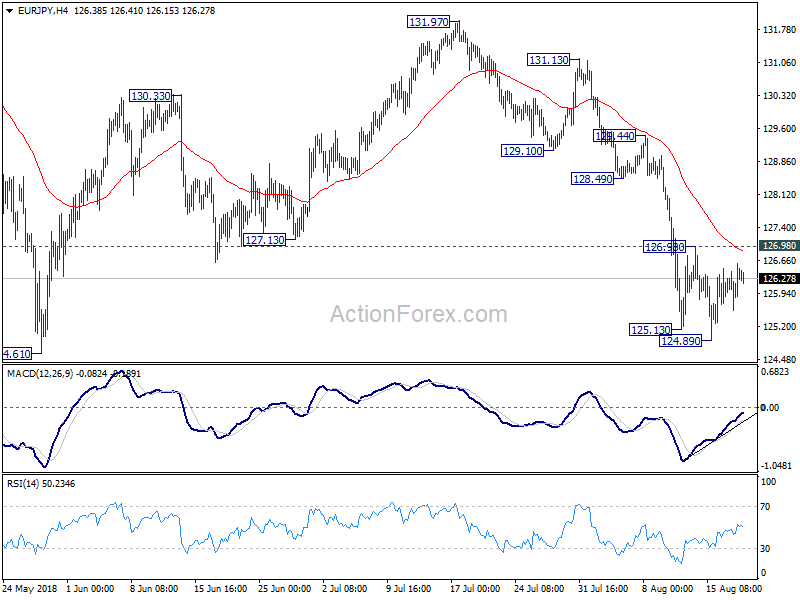
Daily Pivots: (S1) 125.78; (P) 126.19; (R1) 126.81; More....
Intraday bias in EUR/JPY remains neutral for consolidation above 124.89 temporary low. As long as 126.98 minor resistance holds, deeper fall could still be seen. But considering mild bullish convergence condition in 4 hour MACD, downside should be contained by 124.08/61 key support zone to bring rebound. On the upside, break of 126.98 will indicate short term bottoming and turn bias back to upside for stronger rebound.
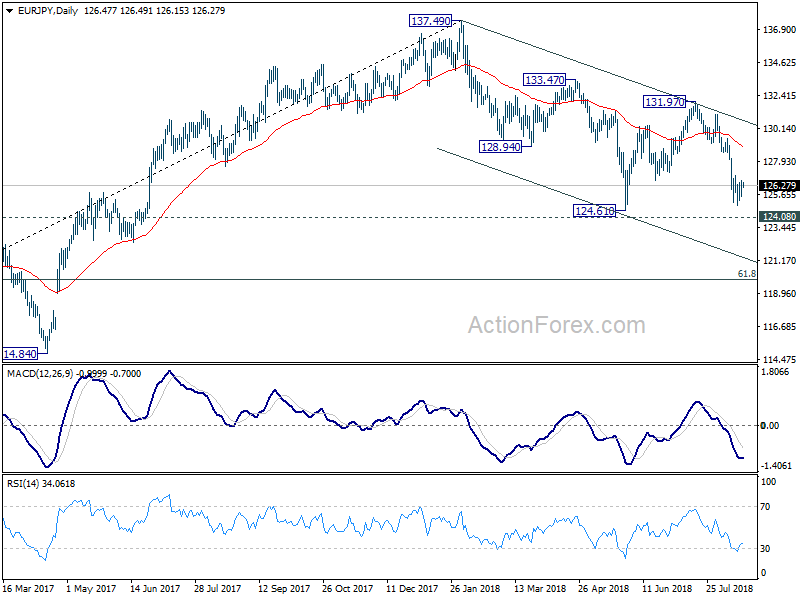
In the bigger picture, focus is back on 124.08 key resistance turned support. Decisive break there will argue that whole rise from 109.03 (2016 low) has completed at 137.49. Deeper decline would be seen to 61.8% retracement of 109.03 to 137.49 at 119.90 next. Sustained break there will pave the way to 109.03 and below. Meanwhile, rebound from 124.08 will keep medium term bullishness intact for another high above 137.49.
Weekly Wave Analysis EUR/USD, GBP/USD, USD/JPY
EUR/USD
The EUR/USD is building a potential bullish pullback after a strong bearish breakout. The price could be in a wave 3 (purple), as long as the price does not make a very deep pullback that goes above the resistance zone at 1.15-1.1525.
Daily chart:
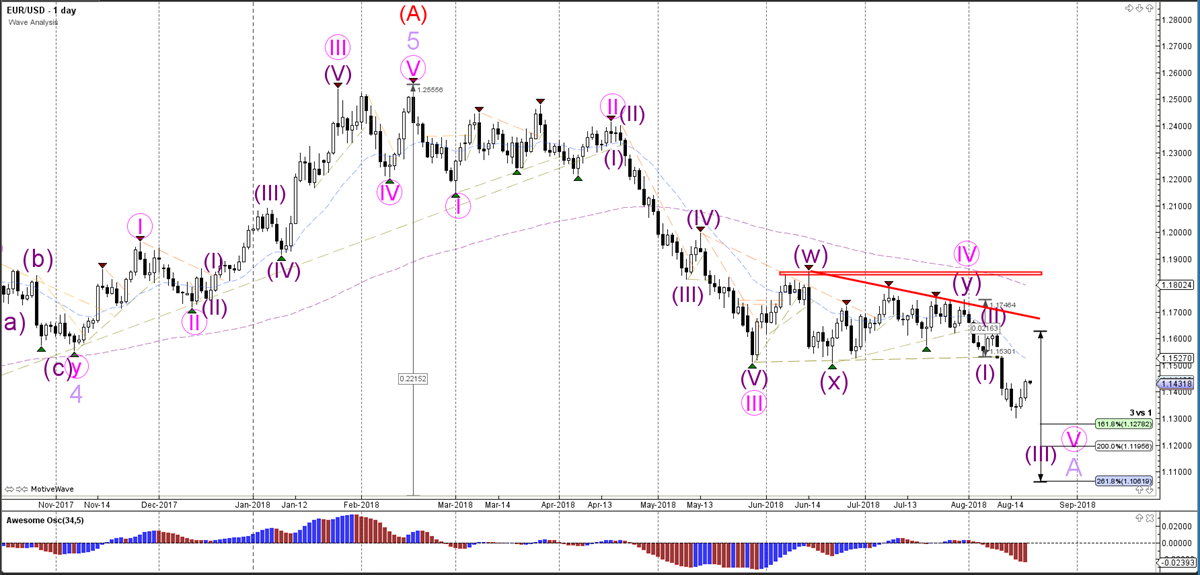
The EUR/USD seems to be building a bearish ABC (purple) correction within wave B (red).
Weekly chart:
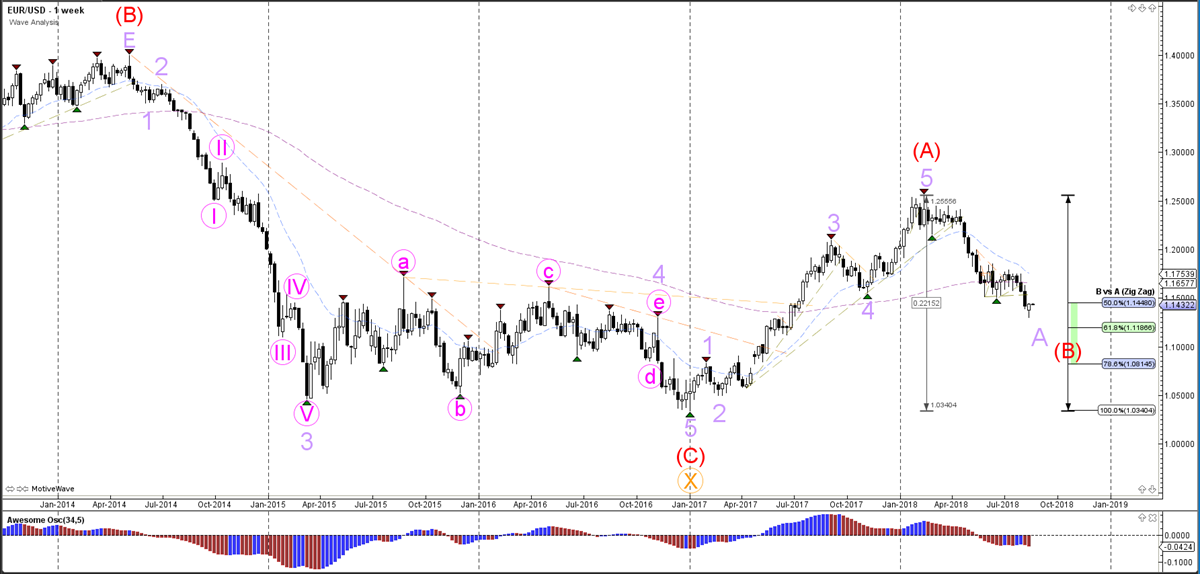
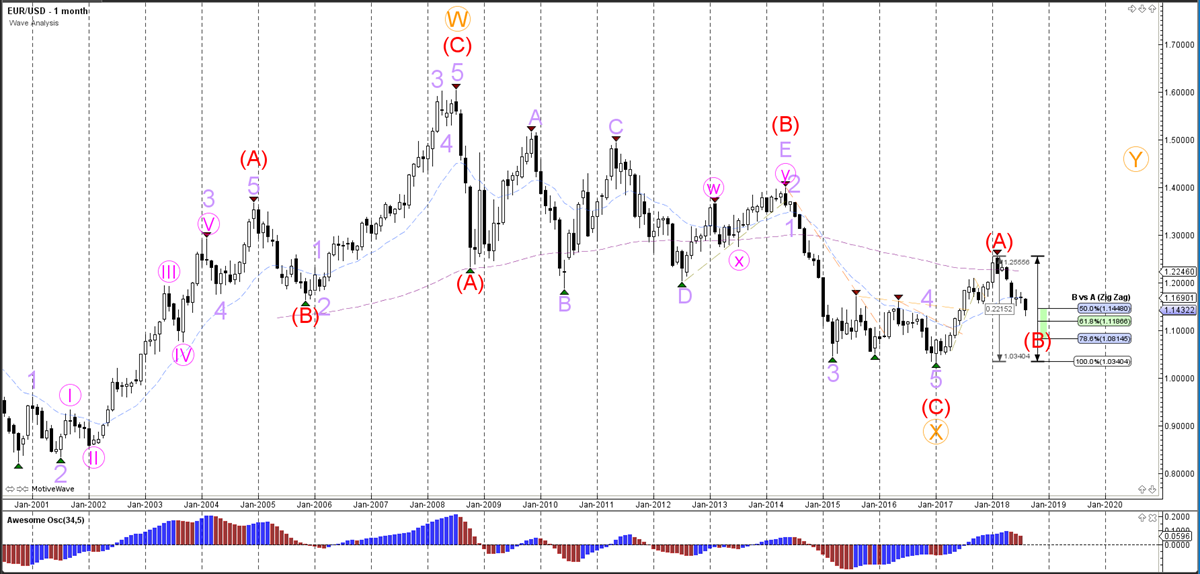
The EUR/USD has completed wave A (red), and the price is most likely retracing to the Fibonacci levels of wave B (red).
Monthly chart:
GBP/USD
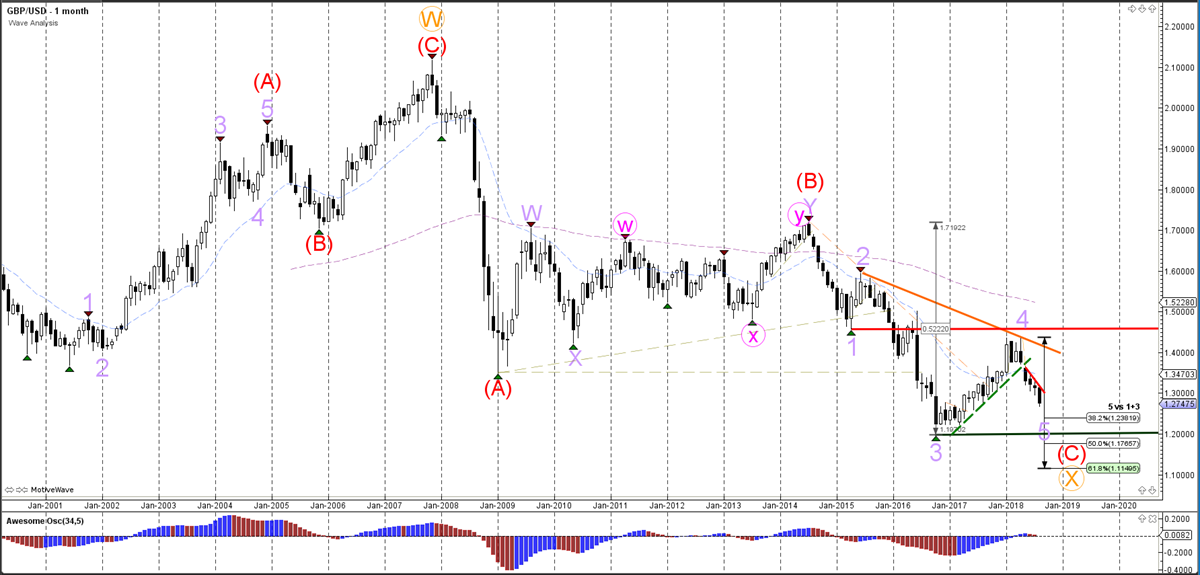
The GBP/USD bearish momentum is strong and seems to be building a wave 3 (purple).
Daily chart:
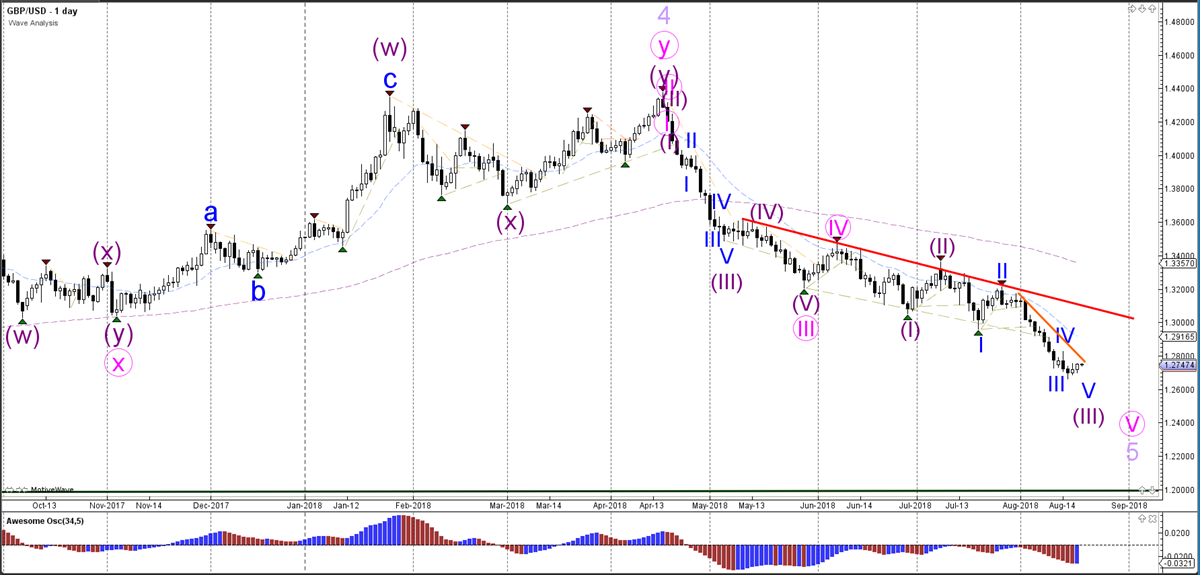
The GBP/USD has probably started the bearish wave 5 after the price has completed a wave 4 (light purple) correction.
Weekly chart:
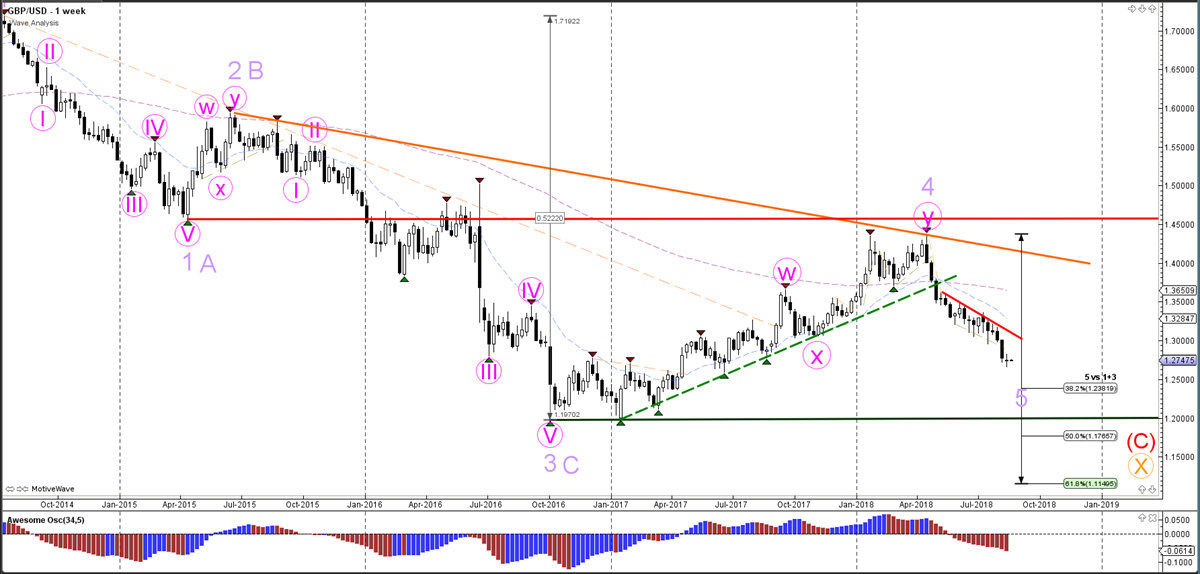
The GBP/USD bearish breakout is probably indicating the start of wave 5 (purple), whereas a bullish break above resistance (red) indicates that a different wave pattern is valid.
Monthly chart:
USD/JPY
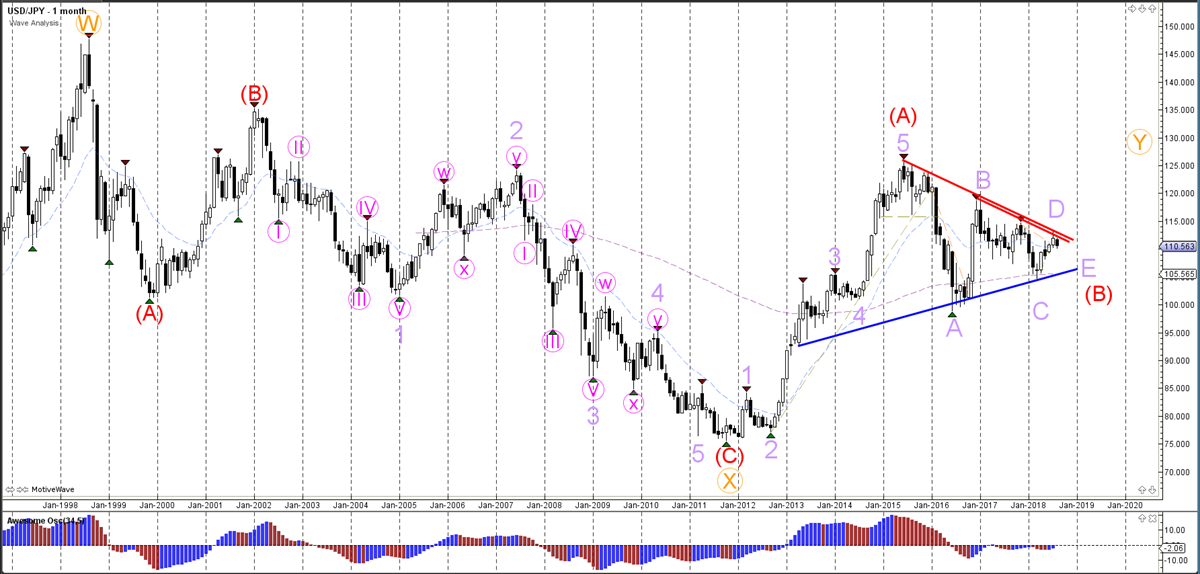
The USD/JPY broke below the support trend line (dotted blue) which is probably part of a bearish WXY (pink) within the final leg wave E (light purple) of the triangle pattern.
Daily chart:
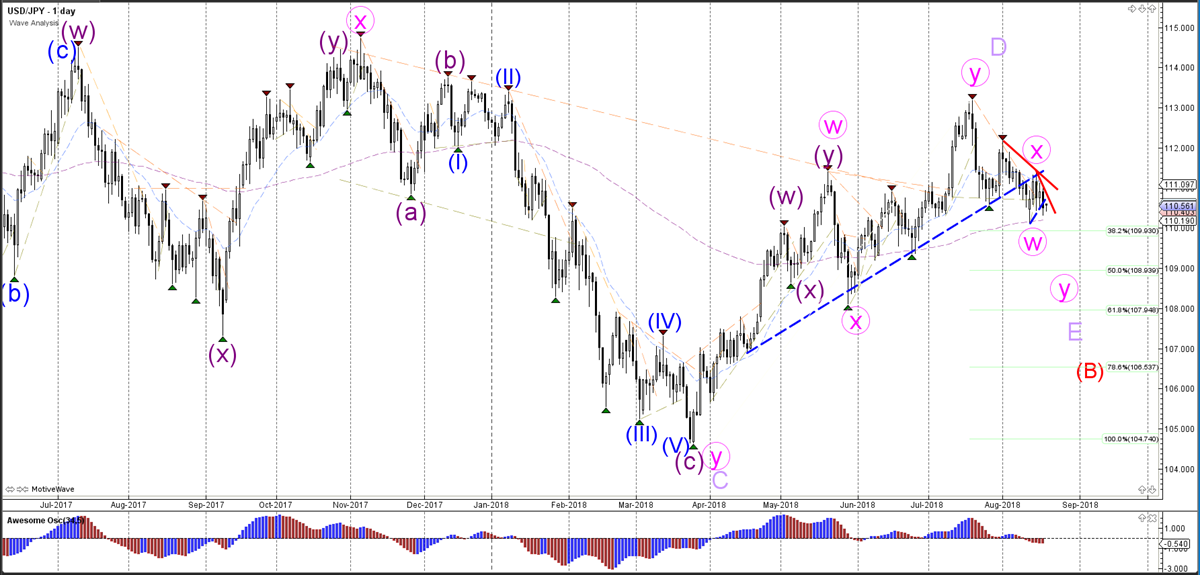
The USD/JPY could be building an ABCDE triangle (light purple) within wave B (red).
Weekly chart:
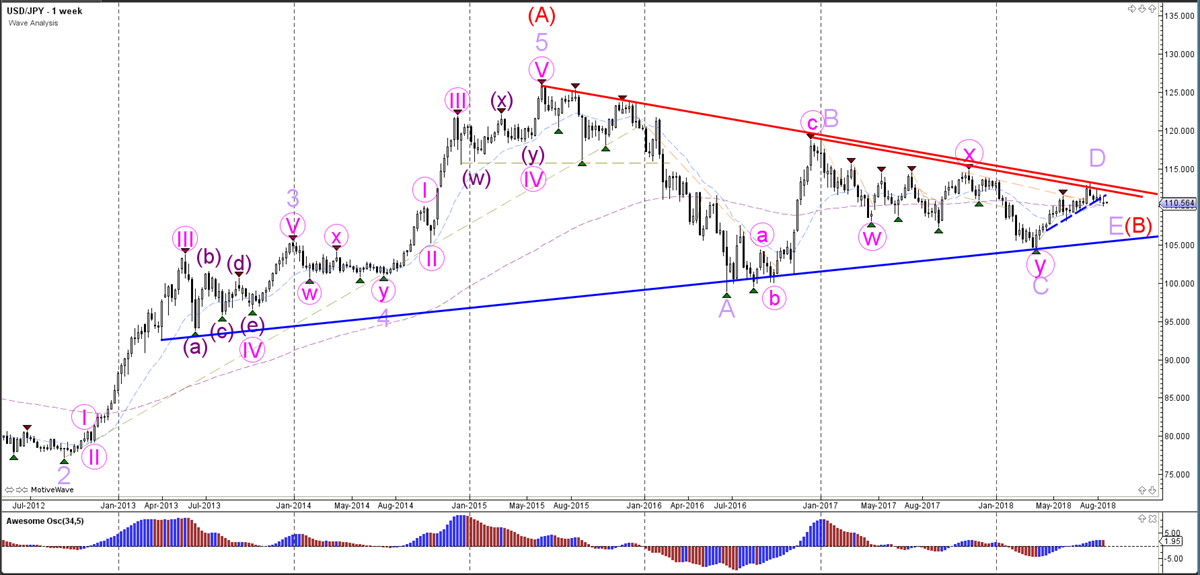
The USD/JPY is in the wave E (light purple) of the triangle pattern.
Monthly chart:
EUR/GBP Daily Outlook
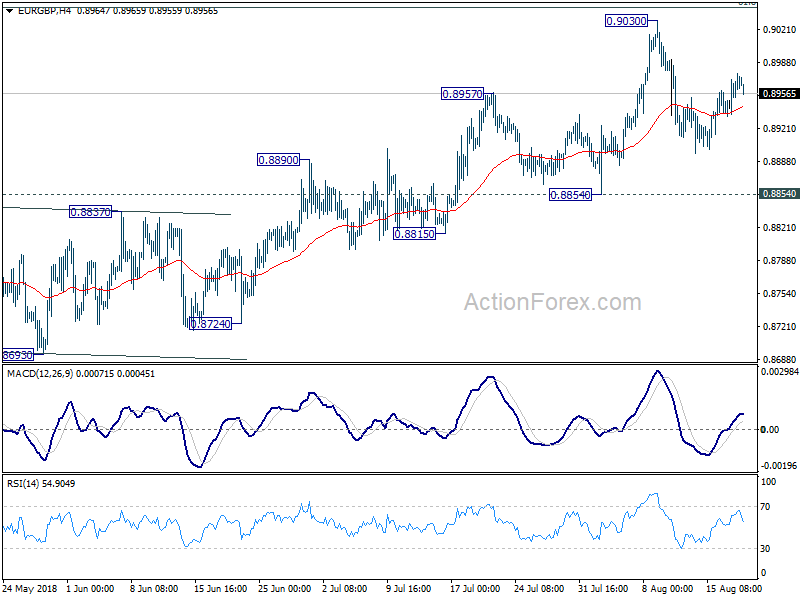
Daily Pivots: (S1) 0.8944; (P) 0.8963; (R1) 0.8989; More...
Intraday bias in EUR/GBP stays neutral as consolidation from 0.9030 short term top is extending. Deeper decline cannot be ruled out as the consolidation extends. But downside should be contained by 0.8854 support to bring rally resumption. On the upside, firm break of 61.8% retracement of 0.9305 to 0.8620 at 0.9043 will pave the way to retest 0.9305 key resistance. However, sustained break of 0.8854 will indicate near term reversal and turn outlook bearish.
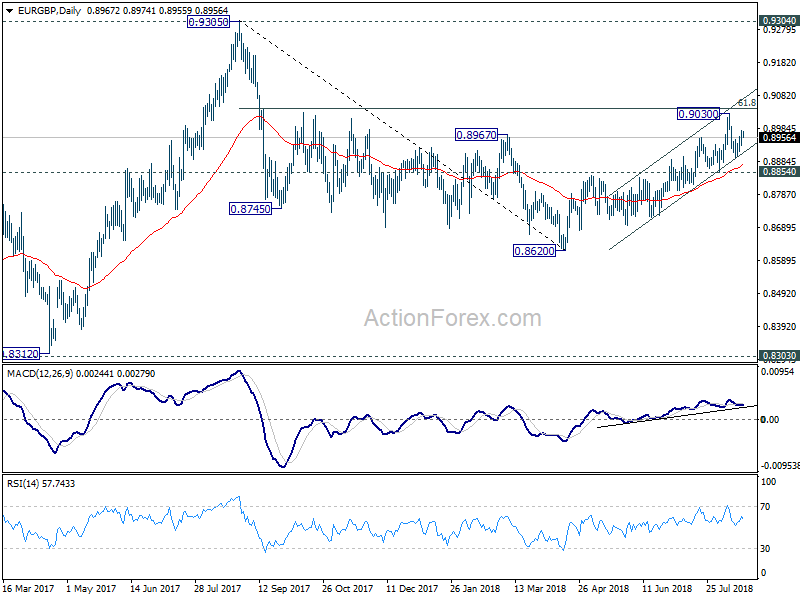
In the bigger picture, EUR/GBP is staying in long term range pattern from 0.9304 (2016 high). The corrective structure of the fall from 0.9305 to 0.8620 is raising the chance that rise from 0.8312 to 0.9305 is an impulsive move. But we're not too confident on it yet. In any case, we'd stay cautious on strong resistance from 0.9304/5 to limit upside in case of further rally. Meanwhile, if there is another medium term decline, strong support will likely be seen from 0.8303 to contain downside.
EUR/AUD Daily Outlook
Daily Pivots: (S1) 1.5618; (P) 1.5650; (R1) 1.5669; More....
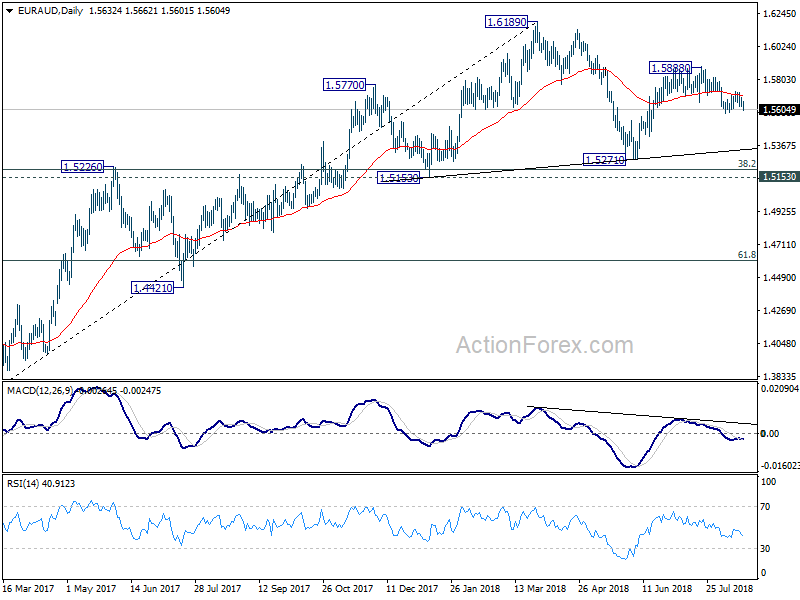
EUR/AUD drops notably today but stays above 1.5578 temporary low. Intraday bias remains neutral first. On the downside, below 1.5578 will resume the fall from 1.5888 to 61.8% retracement of 1.5271 to 1.5888 at 1.5507. Firm break there will pave the way to retest 1.5271 low. On the upside, above 1.5725 will extend the rebound form 1.5578 to retest 1.5888 high.

In the bigger picture, the rebound from 1.5271 was somewhat weaker than expected. EUR/AUD also failed to sustain above 55 day EMA and hints on some underlying bearishness. Though, for now, as long as 1.5271 support holds, medium term rise from 1.3624 (2017 low) is still mildly in favor to extend through 1.6189 high, to 1.6587 key resistance (2015 high). Nevertheless, firm break of 1.5271 will complete a head and shoulder top pattern (ls: 1.5770, h: 1.6189, rs: 1.5888). That would indicate medium term reversal and turn outlook bearish.