Sample Category Title
USD/CAD Potential Trend Line Retest
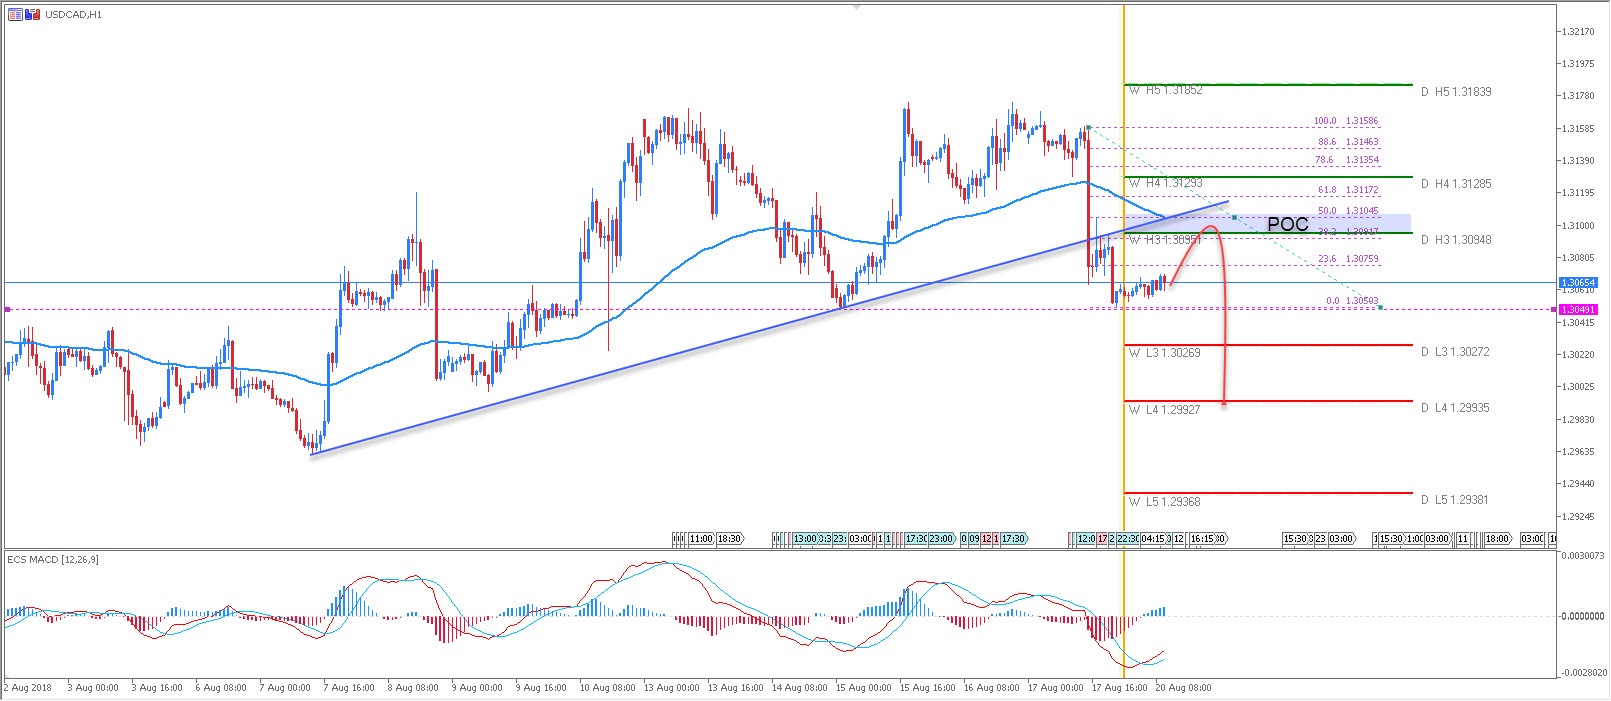
The USD/CAD has broken through the trend line and we might see a retest on a bullish retracement. 1.3094-1.3104 is the POC zone and fresh selling is expected if the price gets into the zone. Targets are 1.3049 and 1.3027. A break of 1.3025 should target the 1.2990 zone, but only if the price holds below 1.3135, then this scenario should be valid.
W L3 - Weekly Camarilla Pivot (Weekly Interim Support)
W H3 - Weekly Camarilla Pivot (Weekly Interim Resistance)
W H4 - Weekly Camarilla Pivot (Strong Weekly Resistance)
M H4 - Monthly Camarilla Pivot (Very Strong Monthly Resistance)
M L3 – Monthly Camarilla Pivot (Monthly Support)
M L4 – Monthly H4 Camarilla (Very Strong Monthly Support)
POC - Point Of Confluence (The zone where we expect price to react aka entry zone)
USD/JPY Triangle Chart Pattern Determines Next Breakout
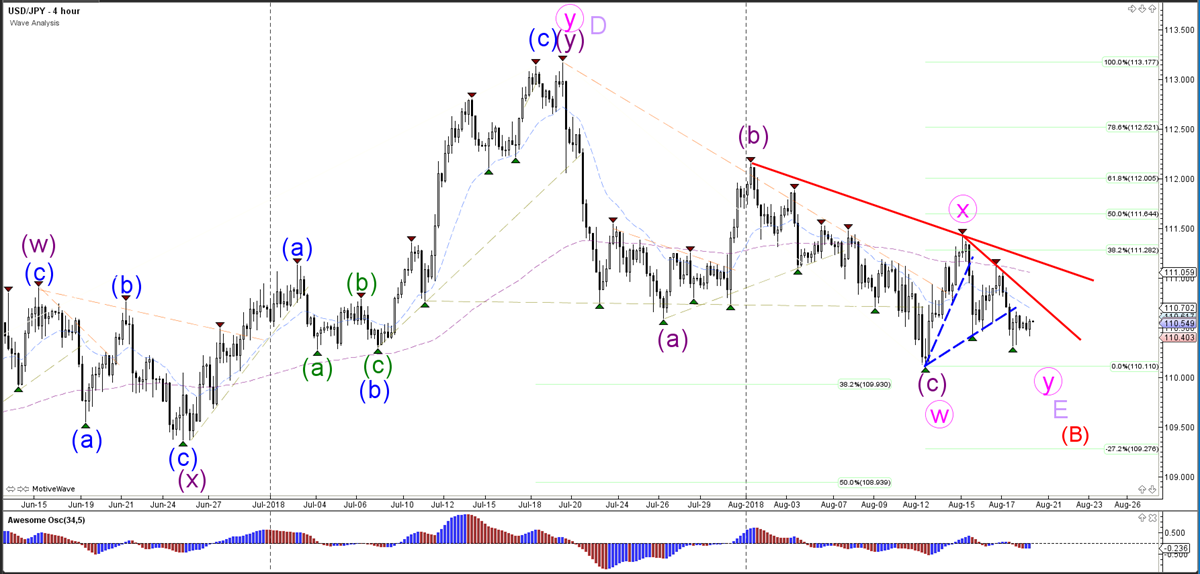
The USD/JPY broke the support trend lines (dotted blue) and could be moving lower as part of wave Y (pink) if the price manages to stay below the resistance (red) trend lines. A bearish continuation could be aiming for the -27.2% Fibonacci target.
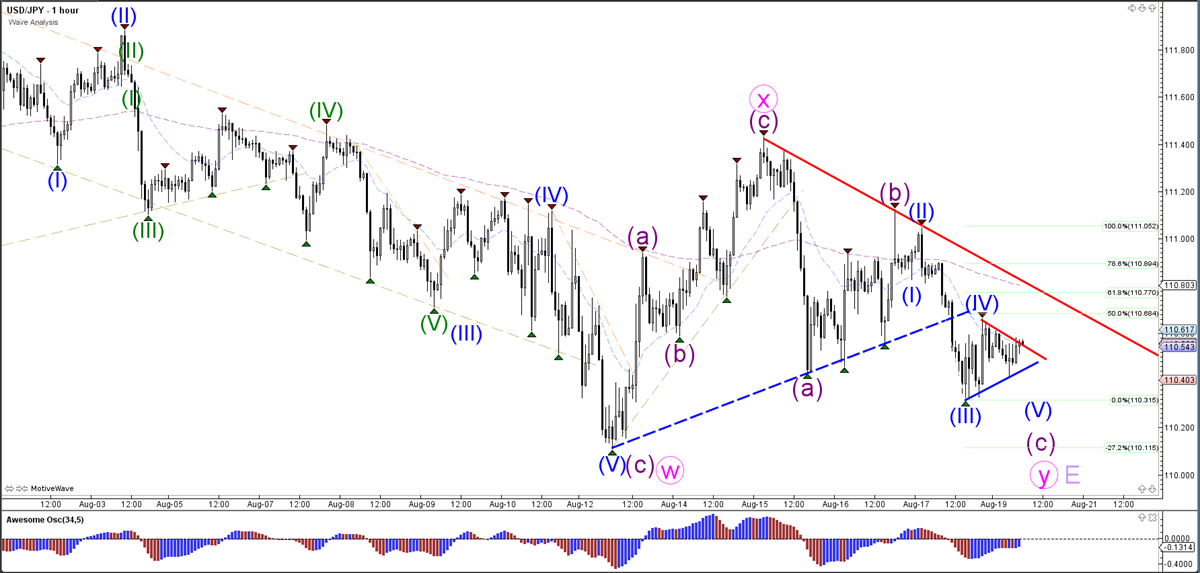
The USD/JPY is building a contracting triangle chart pattern. A break below the triangle could confirm the downtrend continuation, whereas a break above the triangle could indicate a deeper wave 4 (blue) correction. Price is likely to be in a wave 4 (blue) as long as the price stays below the 61.8% Fib.
EUR/CHF Daily Outlook
Daily Pivots: (S1) 1.1341; (P) 1.1369; (R1) 1.1416; More...
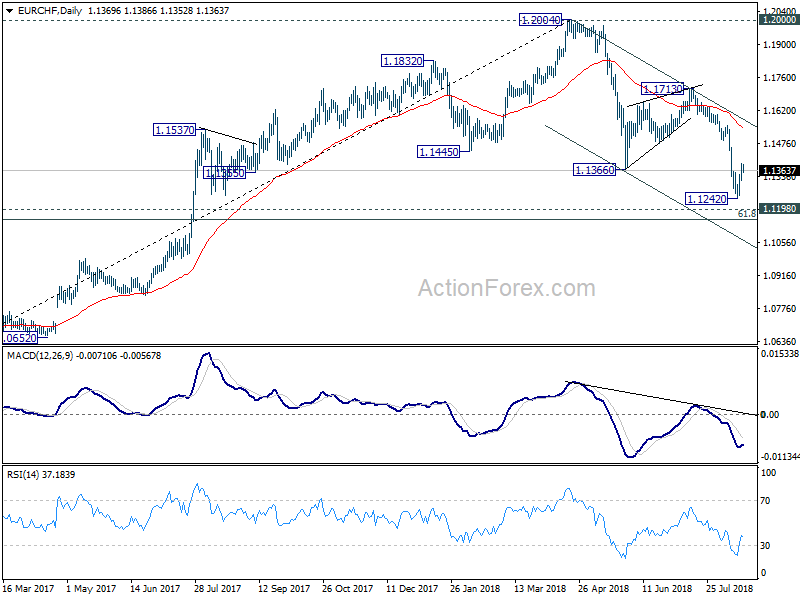
EUR/CHF retreats mildly after hitting 4 hour 55 EMA. But for now, rebound from 1.1242 short term bottom is still expected to continue for 1.1489 support turned resistance. Firm break there will add some credence in near term reversal ahead of key support zone between 1.1154/98. Nonetheless, break of 1.1242 will extend the larger corrective fall from 1.2004. But in that case, we'd expect strong support between 1.1154/98 to contain downside and bring reversal.
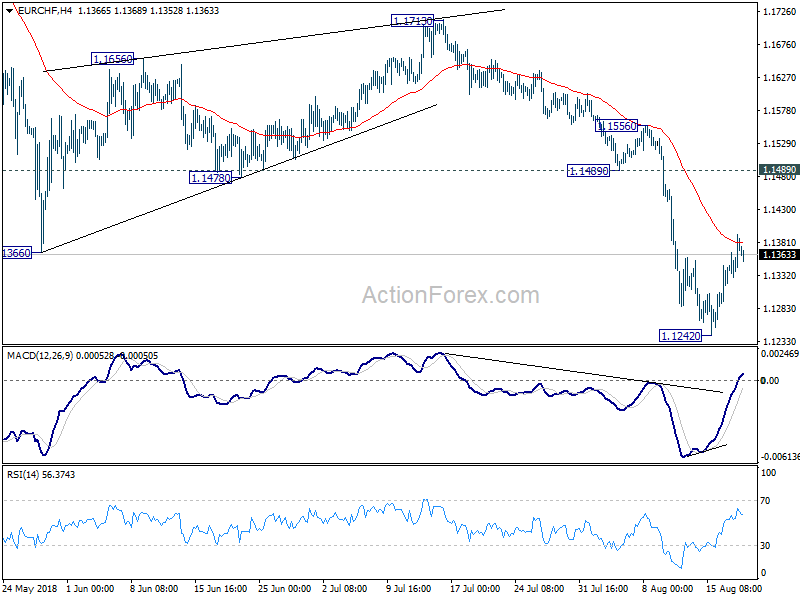
In the bigger picture, for now, the price actions from 1.2004 medium term top is seen as a correction only. Downside should be contained by 1.1198 (2016 high), 61.8% retracement of 1.0629 to 1.2004 at 1.1154 to complete it and bring rebound. This cluster level is in proximity to long term channel support (now at 1.1173) too. A break of 1.2 key resistance is still expected in the medium term long term. However, sustained break of the mentioned support zone will mark reversal of the long term trend.
Dollar Rises With Trade Developments Front And Center
Here are the latest developments in global markets:
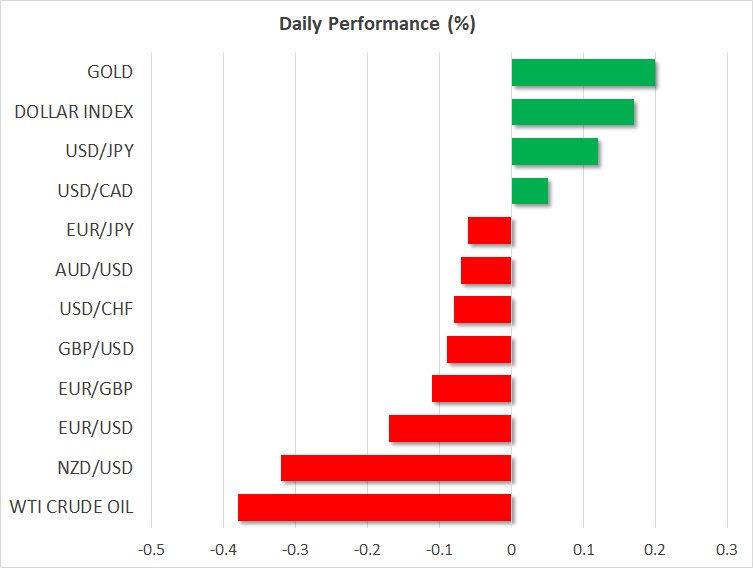
FOREX: The dollar was up by a bit less than 0.2% versus a basket of currencies on Monday. In the absence of major data releases, any updates on the Sino-US trade relationship, as well as any Turkey-related developments may act as the catalysts to steer the currency in either direction.
STOCKS: The Dow Jones, S&P 500 and Nasdaq Composite finished Friday’s trading up by 0.4%, 0.3% and 0.1% respectively, with hopes for a more constructive trade relationship between the US and China acting as one of the catalysts for the move higher. In Asian markets, the Japanese Nikkei 225 and Topix indices both fell by 0.3% on Monday, while Hong Kong’s Hang Seng added 1.3%. At 0712 GMT, futures markets were pointing to a higher open for all major European benchmarks. Meanwhile, contracts on the Dow, S&P and Nasdaq 100 were also suggesting a positive open on Wall Street as well.
COMMODITIES: WTI traded 0.4% lower at $65.84 per barrel. It is notable that the benchmark has retreated in the seven previous weeks. Brent crude was 0.1% down at $71.74/barrel. In precious metals, gold was 0.2% up, trading above its lowest since January 2017 of $1,159.96/ounce hit last week, at $1,186.74. The dollar-denominated metal was suffering lately on the back of the greenback’s strength and also looks unable to attract safe-haven flows stemming from trade and EM uncertainty.
Major movers: Dollar up following the decline late last week; trade, Turkey-related developments eyed
The dollar’s index against a basket of six major currencies was last trading at 96.25, below its highest since June 2017 of 96.98 hit on August 15, but still at relatively elevated levels. The greenback has attracted safe-haven flows recently on the back of trade uncertainty and EM worries largely stemming from Turkey.
Easing concerns on trade, as well as over weakness in the Turkish lira late last week, diverted some funds out of the US currency and threw the dollar index to as low as 96.09, its lowest since August 10. The euro, which has been suffering on the Turkey story due to fears over the exposure of European banks in the country, managed to gain some ground on Friday versus the dollar. On Monday, it is giving back some of those gains, with euro/dollar lower by roughly 0.2% at 1.1418.
Turkish financial markets will be shut for national holidays during August 21-24, which may translate into low trading volumes and large swings in lira pairs. As regards trade, the US and China are now expected to get into talks after holding a largely confrontational stance in previous weeks; August 21-22 were cited last week as the dates for discussions. Markets have been disappointed in the past on this front though and are now perhaps awaiting confirmation that the talks will indeed take place as well as on the nature of such negotiations before taking more aggressive long positions on riskier assets.
It is also noteworthy that there is some speculation in markets for a summit between US President Donald Trump and his Chinese counterpart Xi Jinping in Autumn. The offshore yuan was 0.2% lower against the dollar at 6.8460. Still it held most of its advances from late last week which pushed it away from its weakest since January 2017 of 6.9584.
Dollar/yen and pound/dollar were not much changed. Japan will see the release of inflation numbers during Friday’s Asian session, with safe-haven flows though probably determining the yen’s direction yet again. The UK will not be on the receiving end of important data this week, with any Brexit-developments likely to dictate sterling’s direction.
In the antipodean sphere, the aussie and the kiwi were lower versus their US counterpart after also advancing on Friday; the former was only marginally down. Australia and New Zealand are major commodity exporters and their currencies are sensitive to developments on the trade front.
Elsewhere, dollar/loonie was little changed after retreating considerably on Friday following Canada’s inflation beat. In the aftermath of the data, market participants have fully priced in an additional rate increase by the Bank of Canada in 2018, while they even assign a 13% probability for a second 25bps rate hike according to Canadian OIS.

Day ahead: Trade updates to move markets; US-Turkey political turmoil continues to attract attention
Monday’s economic calendar is light in terms of important data releases, with the trade story remaining on the forefront as investors wait for China and the US to confirm whether they plan to hold lower-level talks this week in Washington, as officials have indicated last week.
According to the Wall Street Journal, the US-Sino trade talks could take place on August 21 and 22 before Washington enforces its tariffs on $16 billion of Chinese imports; Beijing is expected to respond in kind. However, while the meeting could be a sign that the world’s two biggest economies are willing to solve their dispute, the talks could deliver little given that they – at least up to now – are not anticipated to be between high-level officials. Besides, both countries showed no sign of retreating on their demands, a fact that could make tensions difficult to soften.
The confrontation between the US and Turkey, which led the Turkish lira sharply lower against the greenback and spread fears relating to the eurozone’s banking sector, will be also under the spotlight. Relating to this, on Friday, ratings agency Standard & Poor’s downgraded Turkey’s sovereign credit rating further down into junk territory, predicting a recession in the country next year.
In terms of policymakers’ appearances, Bank of Canada Deputy Governor Carolyn Wilkins will be participating in a panel discussion at 1215 GMT, while Atlanta Fed President Raphael Bostic – a voting FOMC member in 2018 – will be speaking on the US economic outlook at 1500 GMT.
Technical Analysis: Gold appears bullish in the short-term
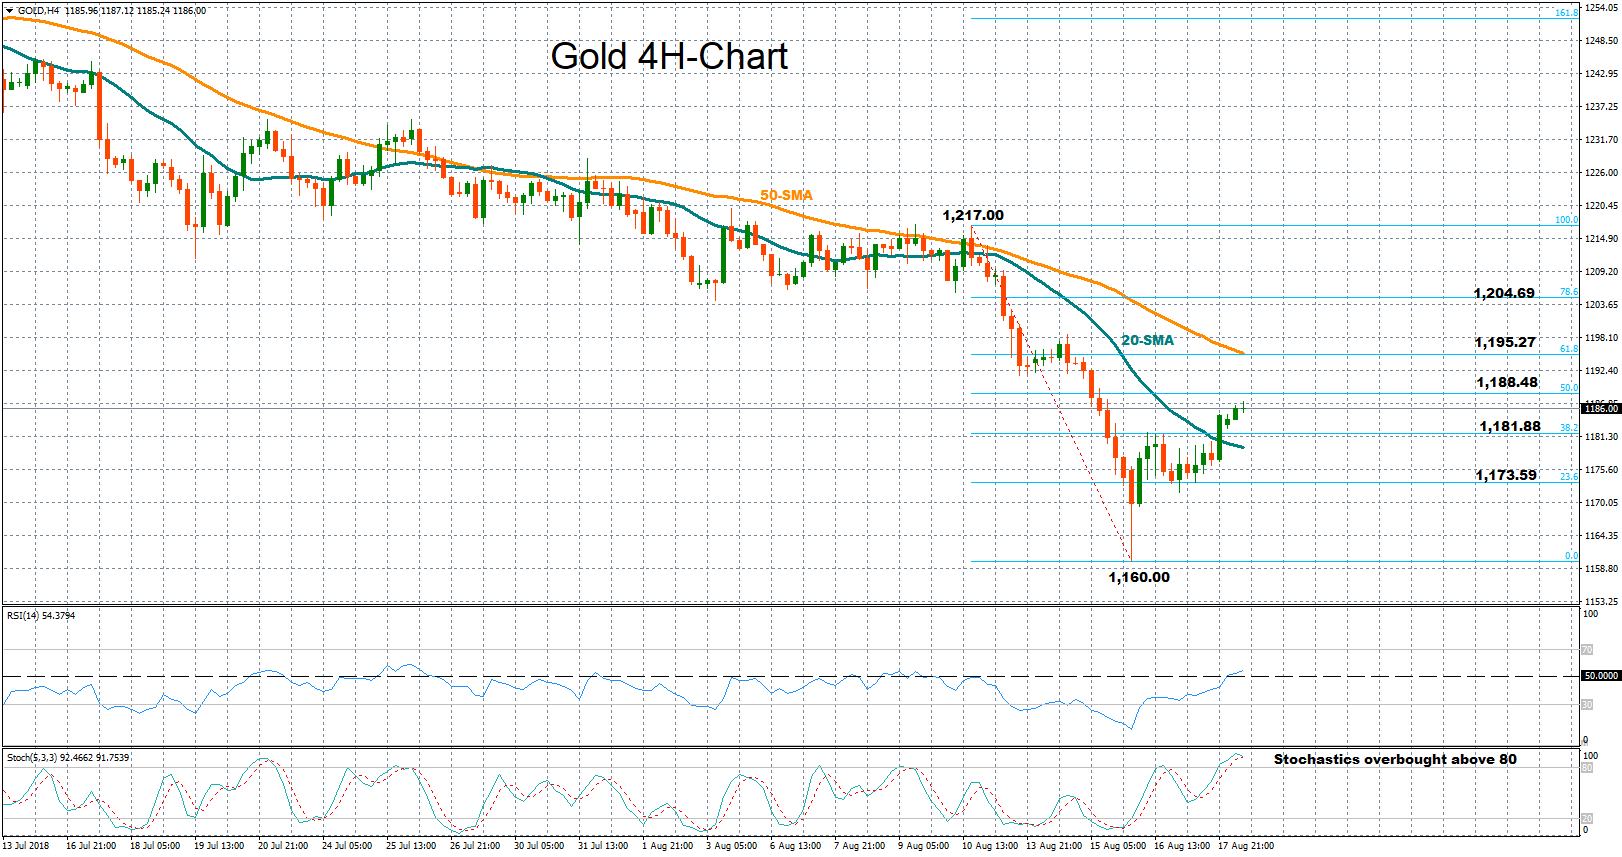
Gold has risen after touching its lowest since January 2017 of around 1,160 on August 16. The RSI continues to advance in the four-hour chart, having crossed above its neutral threshold of 50. Turning to the stochastics though, they may be cautioning against further gains: the green %K line is looking set to cross below the red %D line (both lines are above the 80 level). Should this materialize, it will constitute a bearish signal in the very short-term.
If the price extends positive momentum, immediate resistance could come at the 50% Fibonacci retracement level at 1,188.48 of the downleg from 1,217.00 to 1,160.00, while further above, the 50-period (simple) moving average and the 61.8% Fibonacci mark, both located at 1,195.27 could also act as a barrier to steeper upside movements. The 1,200 round figure which may be of psychological importance would next come into scope.
On the downside, support could first occur at the 38.2% Fibonacci level at 1,181.88 and then at the 23.6% Fibonacci of 1,173.59, where the market paused for a while last week. More bearish movement would bring last week’s multi-month low of roughly 1,160 into view.
USD/CAD Daily Outlook
Daily Pivots: (S1) 1.3123; (P) 1.3149; (R1) 1.3185; More...
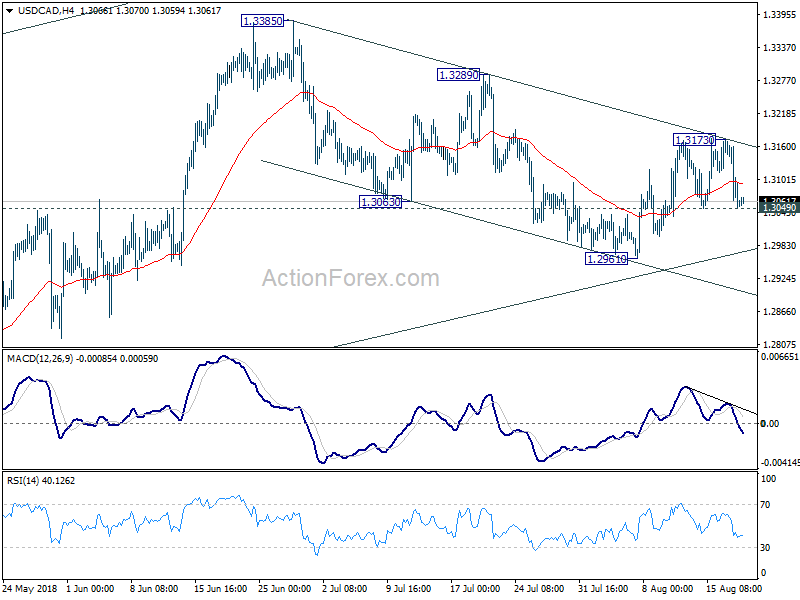
Intraday bias in USD/CAD remains neutral with focus on 1.3049 minor support. Firm break there will indicate completion of rebound from 1.2961. Intraday bias will be turned back to the downside for this support. Sustained break there will carry lower bearish implication and bring deeper fall. On the upside, above 1.3173 will revive the bullish case of near term reversal and target 1.3289 resistance next.
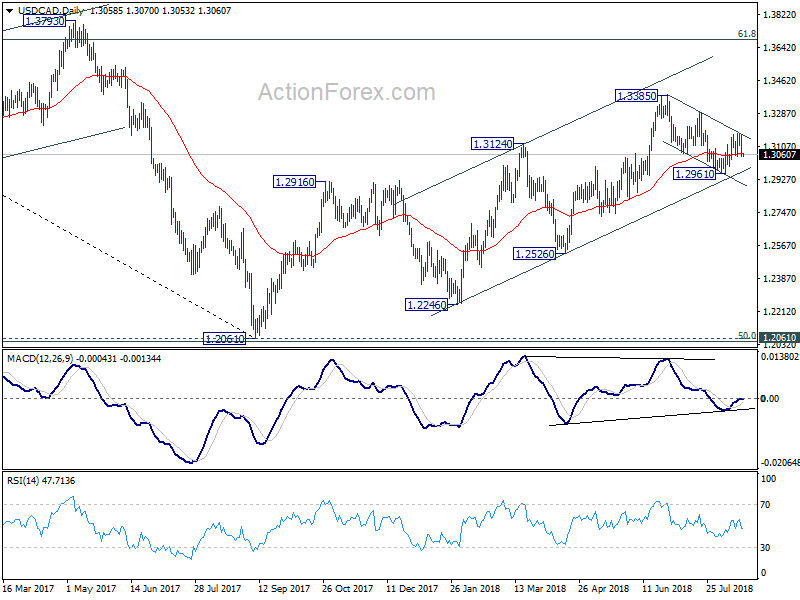
In the bigger picture, as long as channel support (now at 1.2965) holds, we're holding to the bullish view. That is, fall from 1.4689 (2015 high) has completed at 1.2061, ahead of 50% retracement of 0.9406 (2011 low) to 1.4689 (2015 high) at 1.2048. Further rally should be seen for 61.8% retracement of 1.4689 to 1.2061 at 1.3685 and above. However, sustained break of the channel support will argue that rise from 1.2061 has completed and will bring deeper fall to 1.2526 support to confirm.
AUD/USD Daily Outlook
Daily Pivots: (S1) 0.7273; (P) 0.7297; (R1) 0.7340; More...
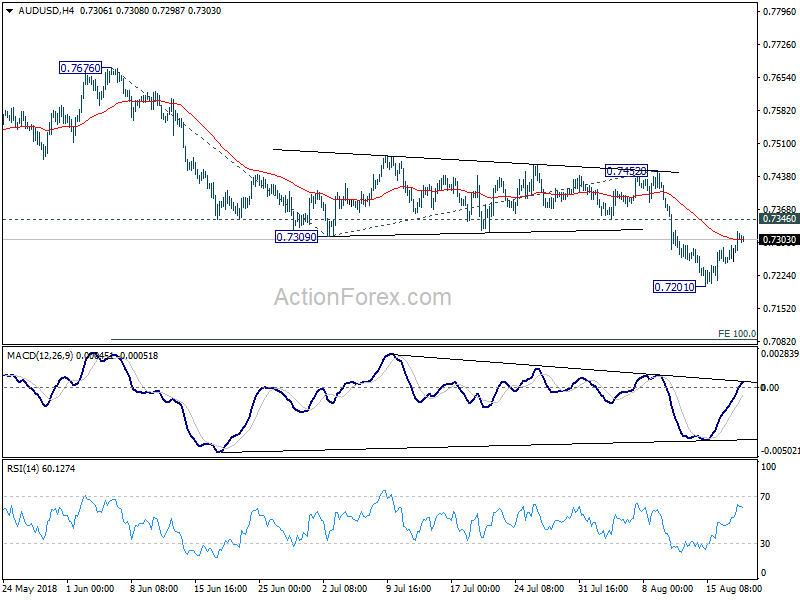
Intraday bias in AUD/USD stays mildly on the upside at this point. Rebound from 0.7201 short term bottom is in progress for 0.7346 support turned resistance. Buy upside is expected to be limited there to bring larger decline resumption. On the downside, break of 0.7201 will extend the fall from 0.8135, to 100% projection of 0.7676 to 0.7309 from 0.7452 at 0.7085.
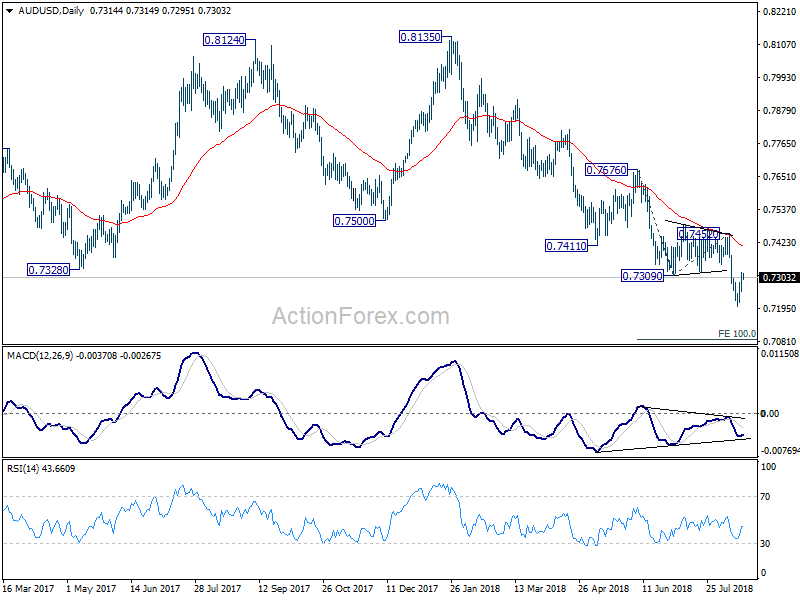
In the bigger picture, medium term rebound from 0.6826 (2016 low) is seen as a corrective move that should be completed at 0.8135. Fall from there should now have a test on 0.6826. There is prospect of resuming long term down trend from 1.1079 (2011 high). But we'll look at downside momentum to assess at a later stage. On the upside, break of 0.7452 resistance is needed to indicate medium term bottoming. Otherwise, outlook will remain bearish even in case of strong rebound.
USD/JPY Daily Outlook
Daily Pivots: (S1) 110.20; (P) 110.62; (R1) 110.94; More...
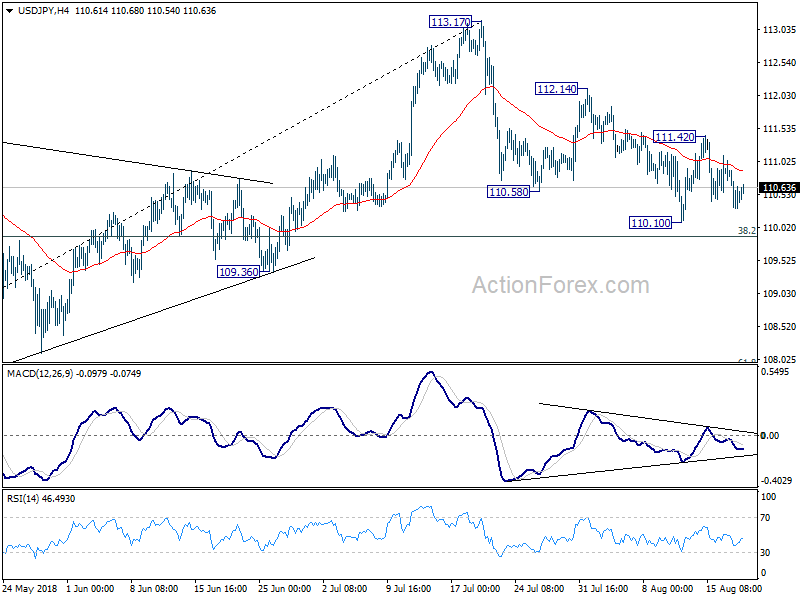
Intraday bias in USD/JPY remains neutral at this point. And near term outlook remains unchanged too. The corrective decline from 113.17 might extend lower. But downside should be contained by 38.2% retracement of 104.62 to 113.17 at 109.90 to bring rebound. On the upside, above 111.42 will target 112.14 minor resistance first. Break will argue that larger rally is possibly resuming for above 113.17.
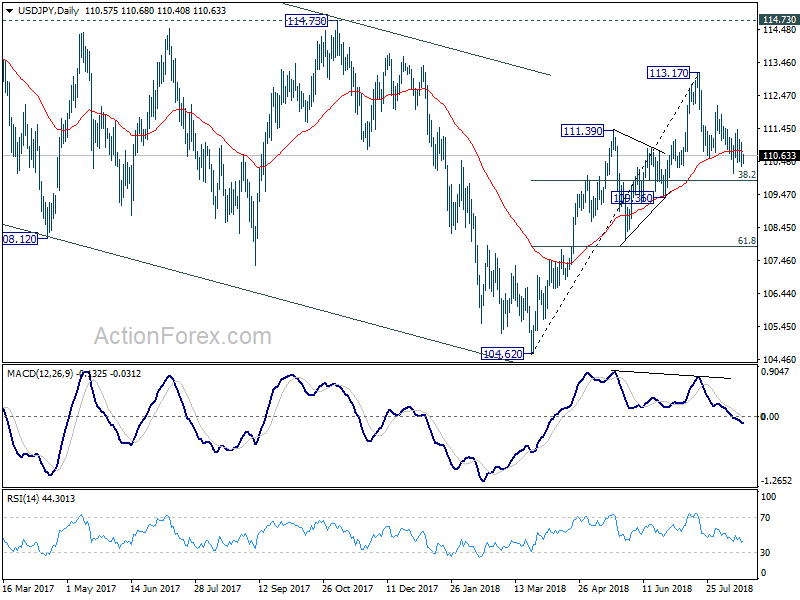
In the bigger picture, corrective fall from 118.65 (2016 high) should have completed with three waves down to 104.62. Decisive break of 114.73 resistance will likely resume whole rally from 98.97 (2016 low) to 100% projection of 98.97 to 118.65 from 104.62 at 124.30, which is reasonably close to 125.85 (2015 high). This will stay as the preferred case as long as 109.36 support holds.
USD/CHF Daily Outlook
Daily Pivots: (S1) 0.9933; (P) 0.9956; (R1) 0.9980; More....
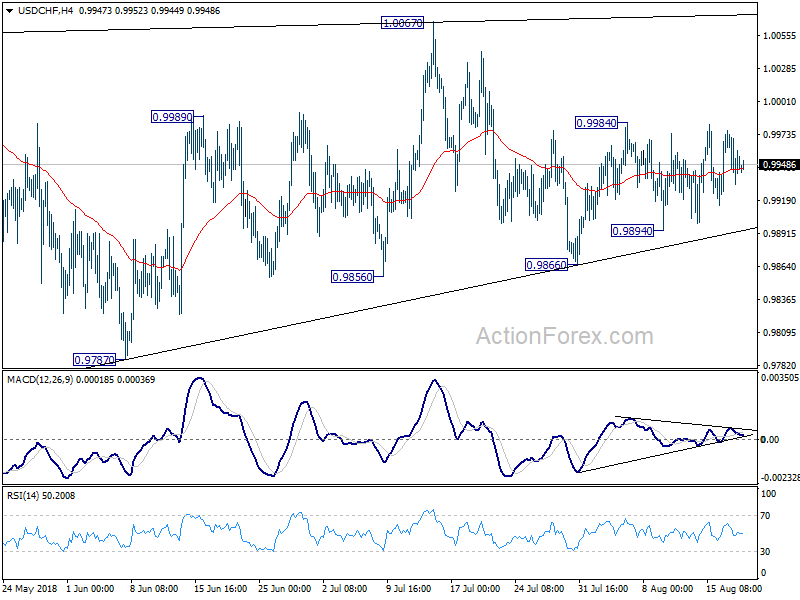
Intraday bias in USD/CHF remains neutral for consolidation inside 0.9894/9984. On the upside, above 0.9984 will resume the rebound from 0.9866 to retest 1.0067 high. Decisive break there will resume whole rally from 0.9186. On the downside, below 0.9894 might extend the consolidation pattern from 1.0056 with another falling leg, possibly through 0.9787 support. But downside should be contained by 38.2% retracement of 0.9186 to 1.0056 at 0.9724 to bring rebound.
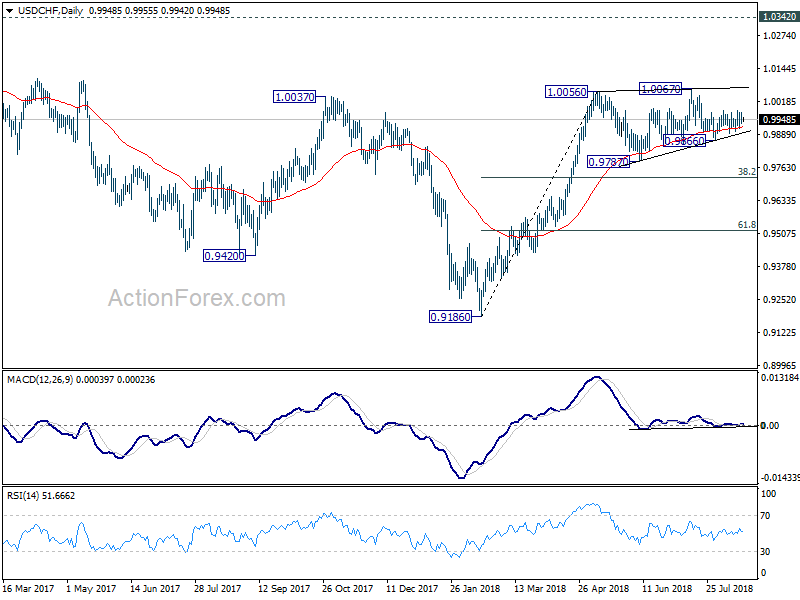
In the bigger picture, current development suggests that the consolidation pattern from 1.0056 is extending. As long as 38.2% retracement of 0.9186 to 1.0056 at 0.9724 holds, we'd expect rise from 0.9186 to resume at a later stage to retest 1.0342 key resistance (2016 high). However, sustained break of 0.9724 fibonacci level will bring deeper fall, as another declining leg in the long term range pattern.
GBP/USD Daily Outlook
Daily Pivots: (S1) 1.2713; (P) 1.2735; (R1) 1.2771; More...
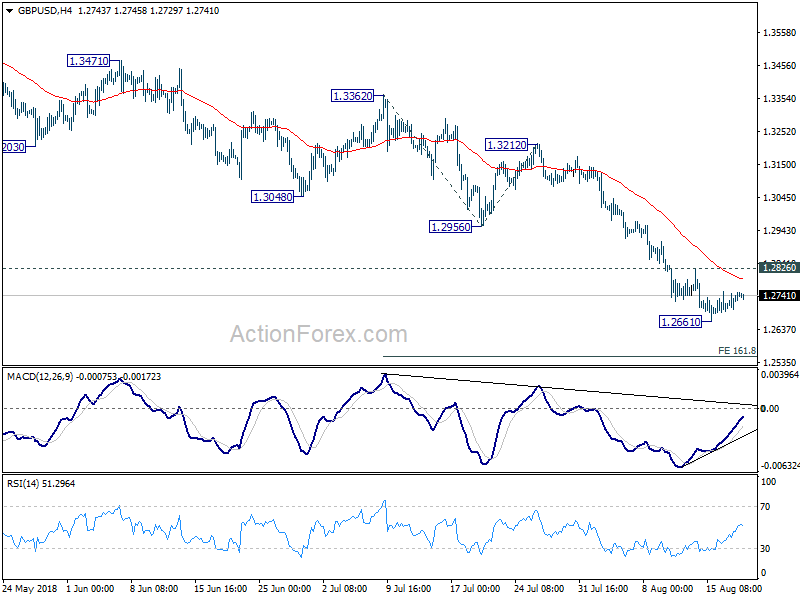
Intraday bias in GBP/USD remains neutral at this point. Some more consolidations would be seen above 1.2661 temporary low. But as long as 1.2826 minor resistance holds, deeper decline is expected. On the downside, break of 1.2661 will resume the whole fall from 1.4376 and target 161.8% projection of 1.3362 to 1.2956 from 1.3212 at 1.2555. Though, break of 1.2826 will indicate short term bottoming on bullish convergence condition in 4 hour MACD. And that would bring stronger rebound and lengthier consolidation first.
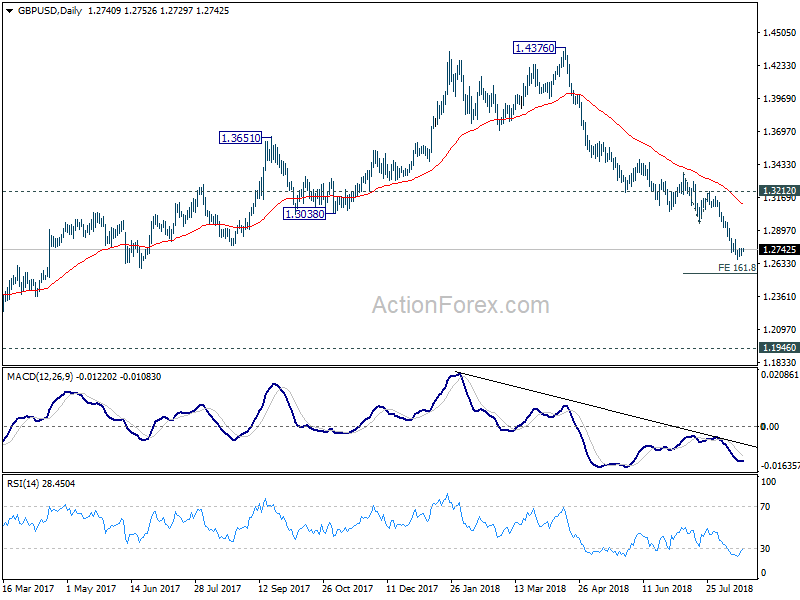
In the bigger picture, whole medium term rebound from 1.1946 (2016 low) should have completed at 1.4376 already, after rejection from 55 month EMA (now at 1.4091). Current downside acceleration argues that it's possibly resuming long term down trend. In any case, outlook will stay bearish as long as 1.3212 resistance holds. Retest of 1.1946 should be seen next.
EUR/USD Daily Outlook
Daily Pivots: (S1) 1.1387; (P) 1.1417 (R1) 1.1467; More.....
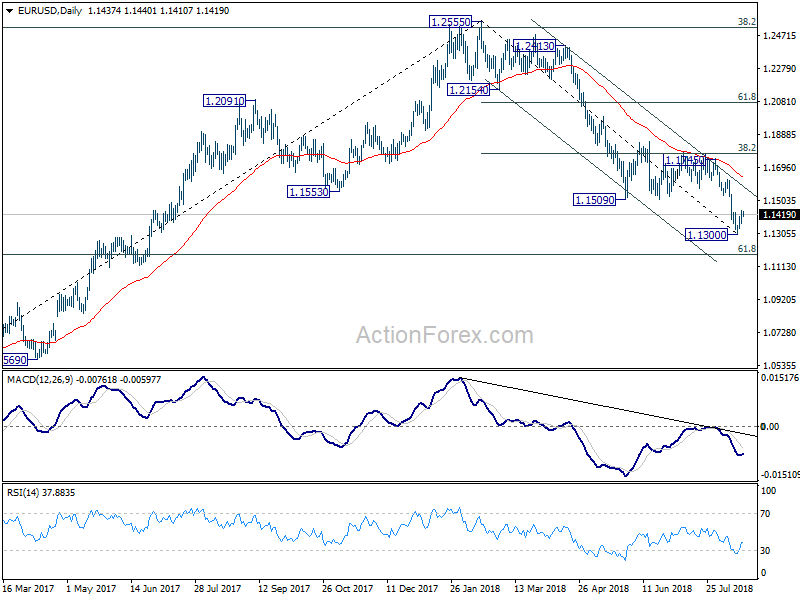
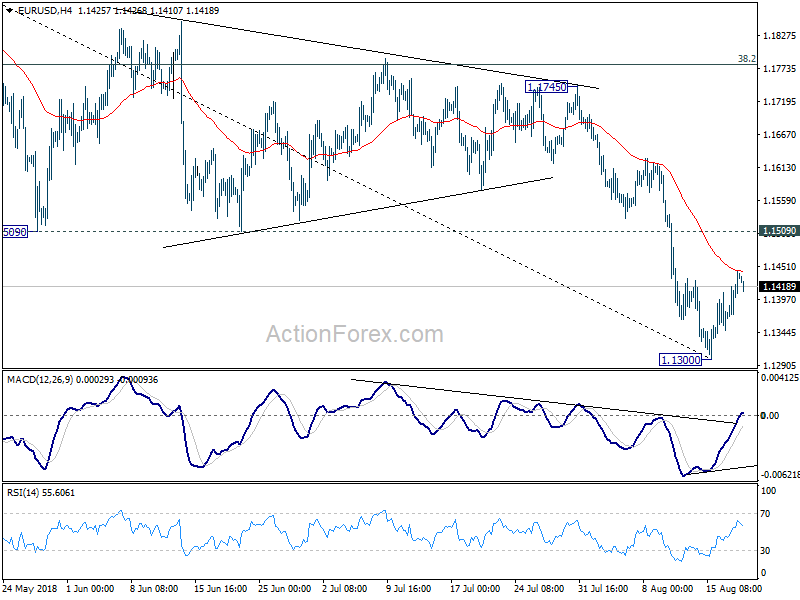
EUR/USD faces some resistance from 4 hour 55 EMA (now at 1.1442) and retreats mildly. But for now, recovery from 1.1300 short term bottom is still in favor to extend higher for 1.1509 support turned resistance. However, we'd expect upside to be limited below 1.1745 resistance to bring down trend resumption. On the downside, break of 1.1300 support is now needed to confirm down trend resumption. Otherwise, near term outlook is neutral for more consolidation first.
In the bigger picture, the down trend from 1.2555 medium term is in progress for 61.8% retracement of 1.0339 to 1.2555 at 1.1186. Note again that EUR/USD was rejected by 38.2% retracement of 1.6039 (2008 high) to 1.0339 (2017 low) at 1.2516. That carries some long term bearish implications. Sustained break of 1.1186 could pave the way back to retest 1.0339 low. For now, outlook will remain bearish as long as 38.2% retracement of 1.2555 to 1.1300 at 1.1779 holds, even in case of strong rebound.