Sample Category Title
EUR/USD Rebound Is Facing Tough Challenges
Key Highlights
- The Euro started an upward move after trading as low as 1.1301 against the US Dollar.
- There is a major bearish trend line in place with resistance near 1.1485 on the 4-hours chart of EUR/USD.
- The Euro Zone CPI in July 2018 decreased 0.3%, compared with the last 0.1% increase.
- The yearly change was 2.1%, similar to the last reading and forecast.
EURUSD Technical Analysis
The Euro was under a lot of pressure this past week below the 1.1400 support level against the US Dollar. The EUR/USD pair declined sharply, tested the 1.1300 support area, and later started a correction.
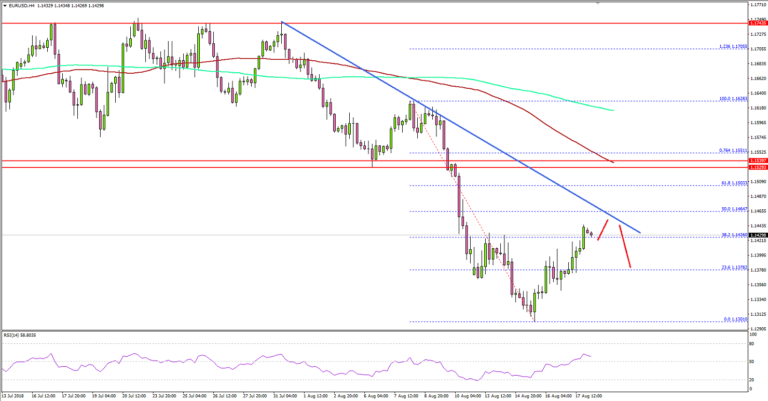
Looking at the 4-hours chart, the pair started a decent upward move and traded above the 1.1350 and 1.1370 resistances. There was also a break above the 23.6% Fib retracement level of the last decline from the 1.1628 high to 1.1301 low.
However, the pair is now approaching a crucial resistance zone near 1.1480-1.1500. There is also a major bearish trend line in place with resistance near 1.1485 on the same chart.
Moreover, the 61.8% Fib retracement level of the last decline from the 1.1628 high to 1.1301 low is at 1.1503 to act as a major resistance. Finally, the 100 simple moving average (red, 4-hours) is positioned near the last support area at 1.1540, which is likely to act as a barrier for buyers.
Therefore, if the pair continues to move higher, it could face many resistances like 1.1480, 1.1500 and 1.1540. On the downside, supports are aligned at 1.1400, 1.1365 and 1.1310.
Recently, the Euro Zone CPI report for July 2018 was released by Eurostat. The market was looking for a decline of 0.3% in the CPI in July 2018 compared with the previous month.
The actual result was similar to the forecast as there was a decrease of 0.3% decrease in the CPI, compared with the last 0.1% increase. Moreover, the yearly change was 2.1%, similar to the last reading and forecast. The report added that:
In July 2018, the highest contribution to the annual euro area inflation rate came from energy (+0.89 percentage points, pp), followed by services (+0.64 pp), food, alcohol & tobacco (+0.49 pp) and non-energy industrial goods (+0.12 pp).
Overall, the Euro could continue to move higher, but it won’t be easy for buyers to clear the 1.1500 and 1.1540 resistance levels in the near term.
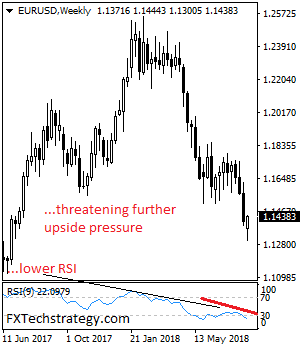
EURUSD – Halts Weakness, Eyes Further Recovery Higher
EURUSD - The pair looks to correct further higher in the new week as it faces further recovery threats. On the upside, resistance comes in at 1.1450 level with a cut through here opening the door for more upside towards the 1.1500 level. Further up, resistance lies at the 1.1550 level where a break will expose the 1.1600 level. Conversely, support lies at the 1.1400 level where a violation will aim at the 1.1350 level. A break of here will aim at the 1.1300 level. Below here will open the door for more weakness towards the 1.1250. All in all, EURUSD faces further downside pressure
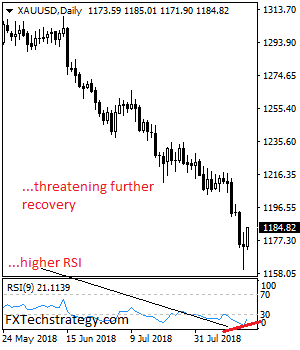
GOLD – Triggers Correction, Remains On The Offensive
GOLD - The commodity continues to hold on to its downside pressure but faces a recovery threats. On the downside, support comes in at the 1,160.00 level where a break will turn attention to the 1,150.00 level. Further down, a cut through here will open the door for a move lower towards the 1,140.00 level. Below here if seen could trigger further downside pressure targeting the 1,130.00 level. Conversely, resistance resides at the 1,170.00 level where a break will aim at the 1,180.00 level. A turn above there will expose the 1,190.00 level. Further out, resistance stands at the 1,200.00 level. All in all, GOLD looks to weaken further lower.
Eco Data 8/20/18
[php_everywhere instance="1"]
CFTC Commitments of Traders: Gold and Silver Turned to Net Shorts
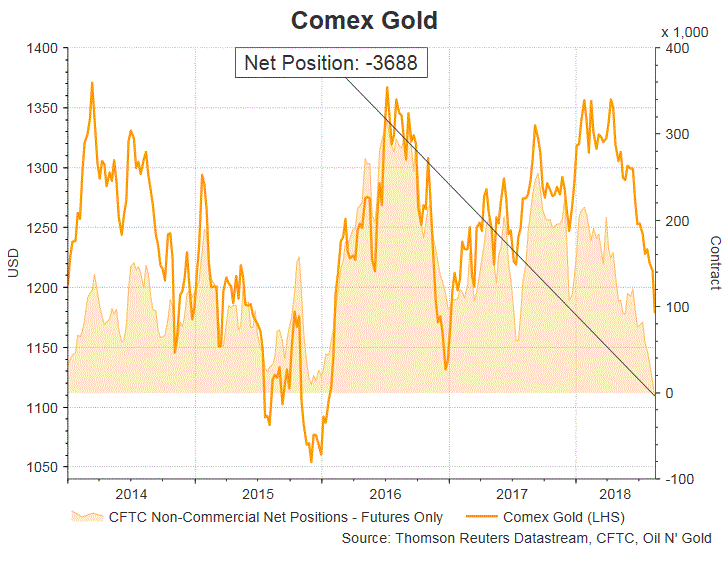
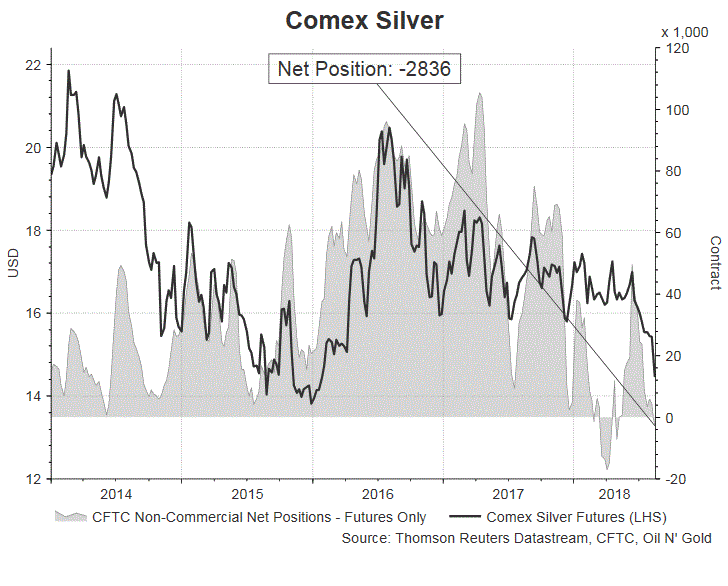
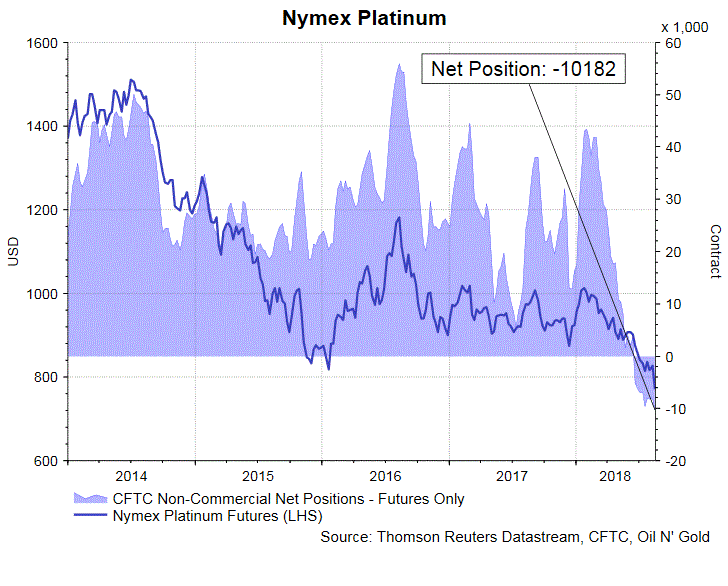
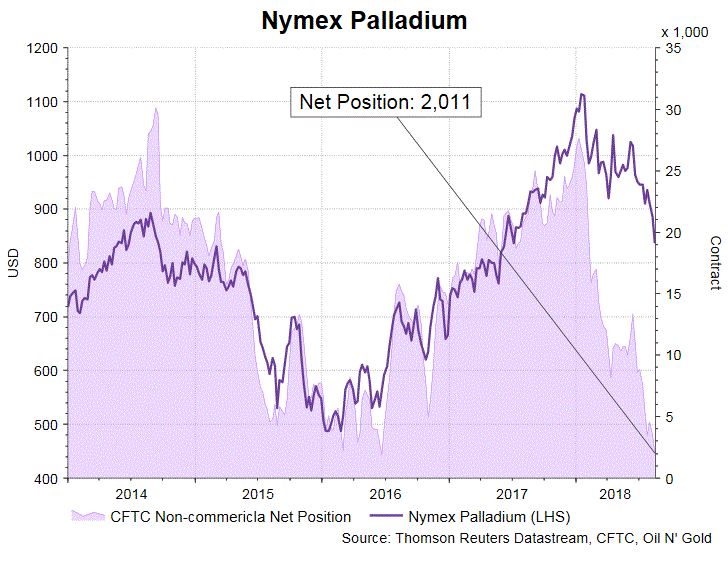
According to the CFTC Commitments of Traders report for the week ended August 14, gold and silver futures surprisingly recorded NET SHORTS, as traders expected prices to weaken further. NET SHORT for for the former was 3 688 contracts, compared with NET LENGTH of 12 688 contracts in the prior week. Silver futures recorded NET SHORT of 2 836 contracts, following NET LENGTH of 4 341 a week ago. For PGMs, NET SHORT of platinum rose +2 039 contracts to 10 182 while NET LENGTH for palladium was down -1 531 contracts to 2 011.
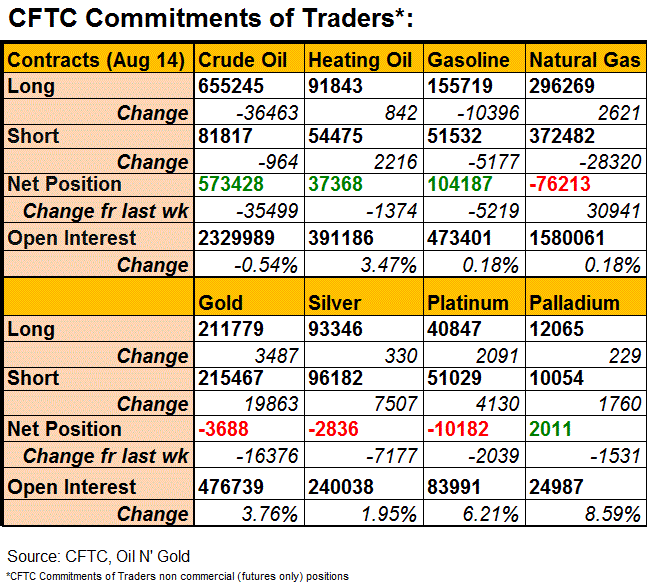
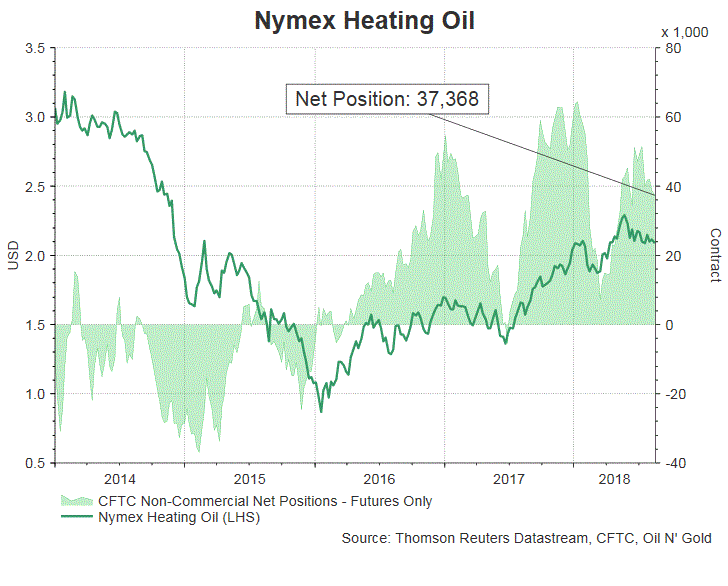
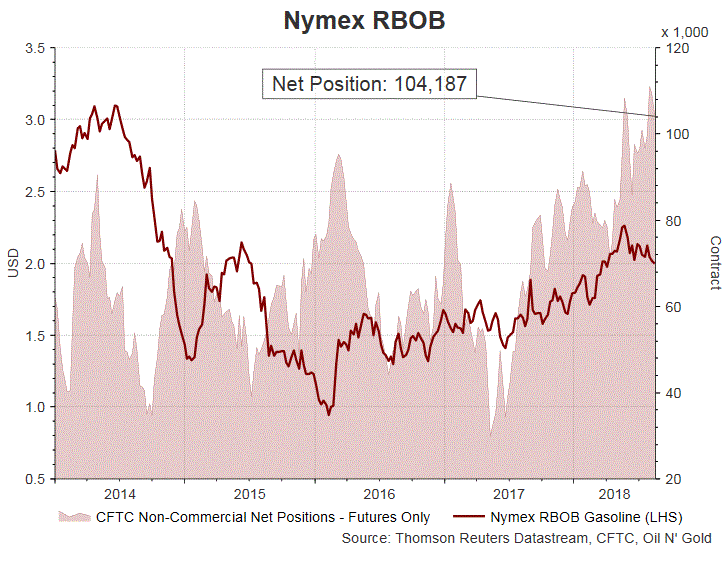
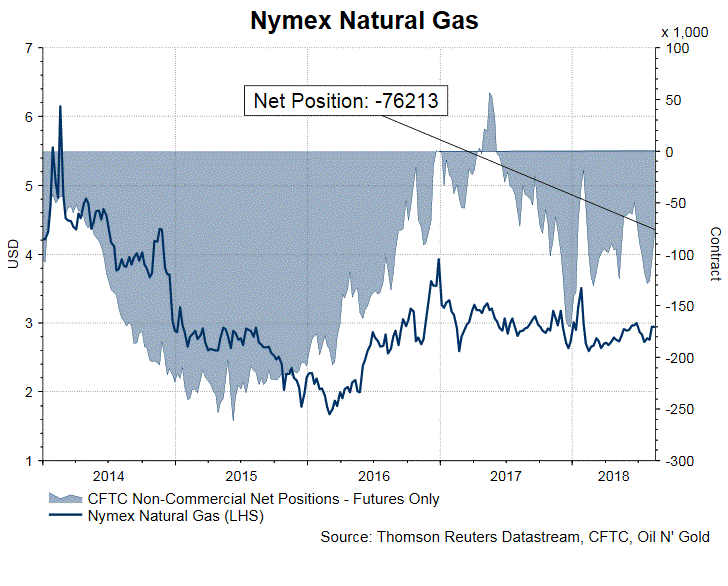
Meanwhile, traders turned more bearish towards the energy complex. They trimmed bets on both sides on crude oil and gasoline futures. For the former, speculative long positions slumped -36 463 contracts while shorts dropped -964 contracts, resulting in a decline of -35 499 contracts in NET LENGTH for the week. Similarly, speculative long positions for gasoline fell -10 396 contracts while shorts dropped -5 177, resulting in a decline of -5 219 contracts in NET LENGTH for the week. Net LENGTH for heating oil futures fell -1 374 contracts to 37 368. The increase in long positions (+842 contracts) more than offset the increase in shorts (+2 216 contracts). Net SHORT for natural gas plunged -30 941 contracts to 76 213 for the week. Traders increased bets for price increase while bets for further price fall were reduced remarkable.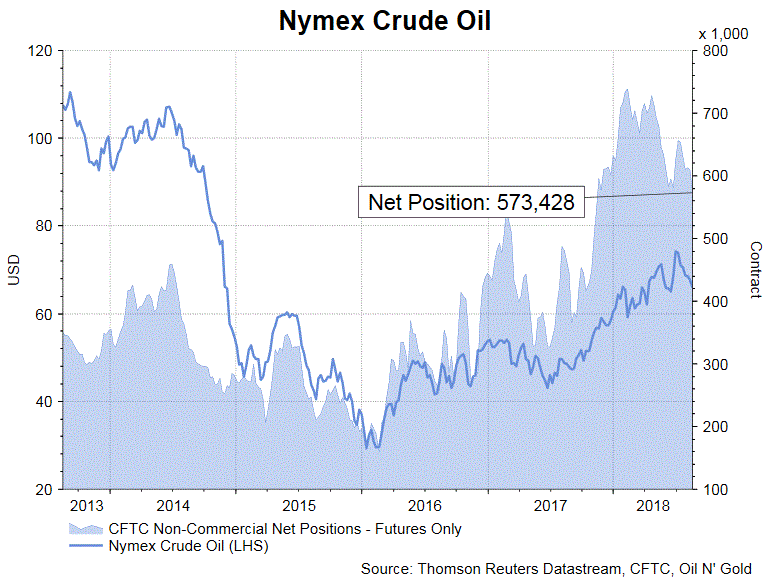
Forex Forecast and Cryptocurrencies Forecast
First, a review of last week’s events:
EUR/USD. Most analysts (60%), supported by graphical analysis and indicators, expected the pair to fall to the 1.1120-1.1300 zone. And indeed, the pair reached the level of 1.1300 on Wednesday August 15, but did not go lower, turned around and returned to zone 1.1400 by the end of the week .Analysts call the stabilization of the situation with the Turkish lira as one of the main reasons for the trend change, although they do not rule out that the lull is temporary, and soon the storm will come again;
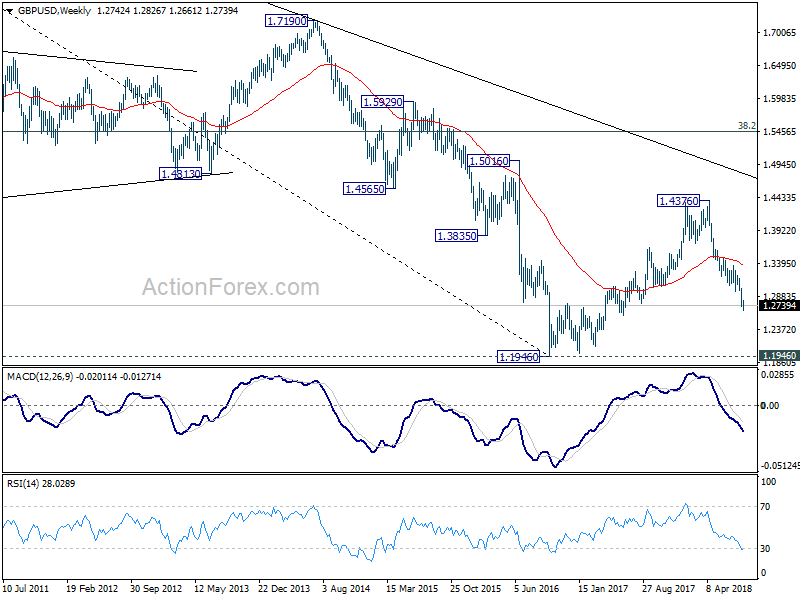
GBP/USD. 45% of experts, supported by 20% of the oscillators, who signaled that this pair is oversold, were expecting a correction, which occurred earlier this week: on Tuesday the pair rose to the level of 1.2825. However, the main forecast was that the downward trend will continue. Problems with Brexit have not gone away, so most analysts agreed that the pair would reach the zone 1.2675-1.2720 in its fall last week. Taking into account the standard backlash, this forecast also proved to be absolutely correct: the pair found the local bottom at 1.2660, and completed the five-day session at the mark 1.2745;
USD/JPY. The expansion of the trade war between the United States and China continues to play into the hands of the Japanese yen as a safe haven. There was a hint for breakdown of the lower boundary of the medium-term rising channel of the pair in the first half of August, which began at the end of March this year. At that time, it was still too early to consider this as a real breakthrough, but almost 70% of the experts voted that the strengthening of the yen would continue, and the pair would drop at least to the horizon 110.30. This forecast was accurate as well: the minimum value of the week was fixed at 110.10, and the final chord sounded in the zone of 110.50;
Cryptocurrencies. News from the bitcoin battlefields can be considered positive: the pair BTC/USD could not break the level of 5.760 and, as we predicted, it stayed in the corridor of $5.760-6.800. And this was despite a powerful correction, as a result of which the crypto market capitalization dropped to $189 billion at the beginning of the week. The main reason for this BTC "stability" is that mining becomes almost unprofitable below the $6,000-6,100 zone, and most miners are working on the recoupment verge right now. That is why the level of 5.760 is the support that the pair could not overcome from the very beginning of its fall on December 17, 2017.
Litecoin (LTH), ripple (XRP) and many other top coins have regained their positions after a fall in the middle of the week. The second largest crypto-currency, Ethereum (ETH), has gone up, but it is much more difficult to do it for Ethereum than for its "colleagues". Its own popularity played against the Ethereum. According to the Invest in Blockchain study, 60 of the 100 largest crypto-currencies are not based on a working product, not mentioning smaller tokens. And, recall, most ICOs were held basing on ETH, and now few successful projects are rushing to cash their Ethereum, fearing further decline of the market.
As for the forecast for the coming week, summarizing the opinions of a number of analysts, as well as forecasts made on the basis of a variety of methods of technical and graphical analysis, we can say the following:
EUR/USD. The main factors determining the movement of dollar pairs in the coming week will be the next stage of negotiations between the US and China, as well as the Federal Reserve head Jerome Powell's speech at the economic symposium in Jackson Hole.
The investors do not pin hopes on the US-China talks. But they expect some clarity from Powell regarding the policy of quantitative tightening and raising interest rates. According to a number of economists, if instability in world markets continues, it could lead to a crisis in emerging markets, and that, in turn, will lead to a new global financial crisis. And the current problems of Turkey are just the first sign.
In the meantime, the experts' opinions are divided as follows: 55% of them, supported by graphical analysis and oscillators on D1, are for the further fall of the pair, 45% along with graphical analysis and oscillators for H4, are for its growth. In this case, it should be taken into account that on H4, it is already 10% of the oscillators that signal the pair is overbought.
The nearest target for the bulls is 1.1525, the following targets are 1.1575 and 1.1630. The bear target is the zone 1.1270-1.1300, then a support follows at 1.1165;
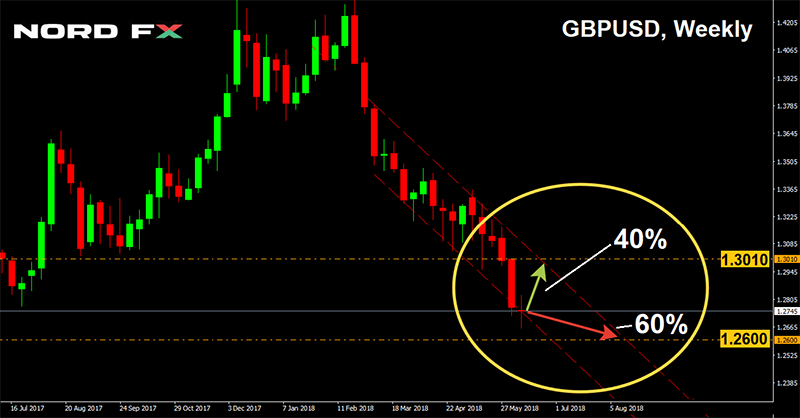
GBP/USD. It seems that even the impressive volume of retail sales cannot assist the British pound: fears about the tough scenario Brexit outweigh everything. Most analysts (60%) predict further strengthening of the dollar and decline of the pair first to the level of 1.2660, and then on to zone 1.2600.
An alternative point of view is expressed by 40% of experts who expect a correction and a return of the pair to the upper boundary of the medium-term downtrend channel, 1.3010. Intermediate resistance levels are 1.2825, 1.2910 and 1.2950. It is important to note that when we move from a weekly forecast to a monthly one, the number of bulls' supporters among experts increases from 40% to 65%;
USD/JPY. Despite the fact that it is already 15% of the oscillators that signal the pair is oversold, the overwhelming majority of experts believe that the global trends, or rather, the economic wars unleashed by US President Trump, will determine the trends in this case. They are expecting continued mutual reproaches and threats to introduce new import duties from the upcoming US-China talks, and therefore the demand for the yen as a safe haven will grow. 75% of analysts expect the pair to fall into the 109.00 zone, and only 25% voted for its return to the levels of 111.00-112.00. The next target is the height of 113.15.
If we talk about the medium-term forecast, 65% of experts are confident that the pair will not be able to overcome the very strong support of 2017-18. in the 108.00 zone in its fall and will eventually return to the upper boundary of the two-year horizontal channel 114.45;
Cryptocurrencies. Negative sentiment continues to dominate this market, severely limiting the new investment flow. However, the growth of capitalization in the second half of the previous week higher than the $204 billion mark is a good signal: traders continue to buy bitcoin and altcoins in times of recessions. Nevertheless, you cannot call such trades long-term investments. Rather, it is intraday and intraweek trade, when traders quickly close their bullish positions. That's why it will be difficult enough for bitcoin to rise above the resistance of $6,830. Any significant positive news may serve as the driver in this case, thanks to which the pair BTC/USD will be able to move to the level of $6,850-7,150.
The breakdown of the support of $5.760 will, most likely, be a very strong signal for the mass sale of cryptocurrencies. Although, according to experts, such a scenario is unlikely in the near future for the reasons described in the first part.
AUD/JPY: A head and shoulder bottom failure in the making?
AUD/JPY could be a very interesting pair to watch this week. From the hourly chart, there's clearly a beautiful head and shoulder bottom pattern (ls:79.97, h: 79.69, rs: 80.09). Bullish convergence condition is also seen in hourly MACD. So, is AUD/JPY ready for a powerful upside move?
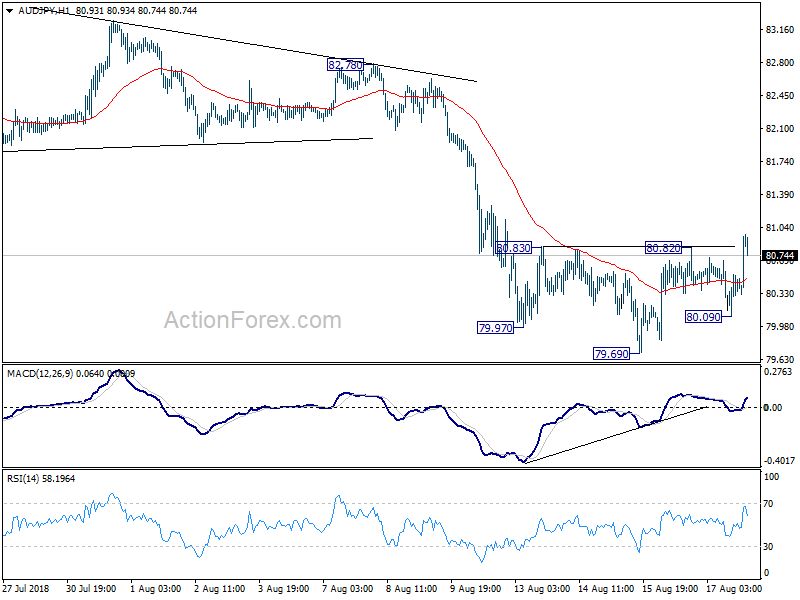
We're quite skeptical on it. First of all, we'd like to reiterate that head and shoulder is a classic "reversal" pattern. Believe nobody would disagree to that. But we'd like to clarify that meaning of "reversal". It means both a) ending the prior trend to start a new trend in the opposite direction, OR b) halting the current trend, starting a counter trend move to correct the prior move. In case of b) the subsequent move could be in form of any corrective pattern, a rectangle, a wedge, a triangle, etc.
To assess the chance a) for AUD/JPY, we'll have to see if the pair has completed a down trend that's in a larger degree of the head and shoulder pattern. That is, we'll have to look at the bigger picture to see if the conditions are in place for a larger reversal.
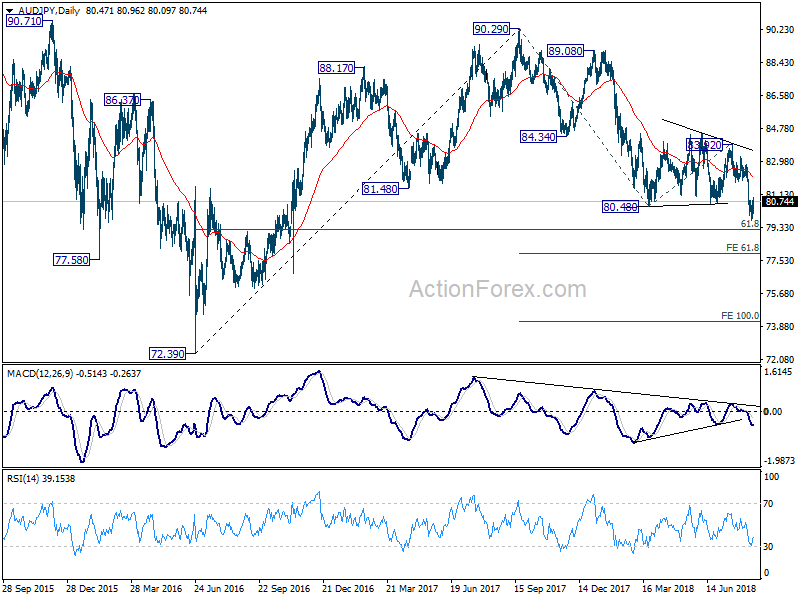
Firstly, AUD/JPY has just resumed the down trend from 2017 high at 90.29, by breaking 80.48 key support level, with solid downside momentum. From the daily MACD, we see that downside momentum is increasing, rather than decreasing.
Fall from 90.29 is either correcting the up trend from 72.39 to 90.29, or starting a new long term down trend. But even for the former case (less bearish), it hasn't matched target of 61.8% retracement of 72.39 to 90.29 at 79.22 yet. So, we don't think conditions are in place to reverse the trend from 90.29 yet.
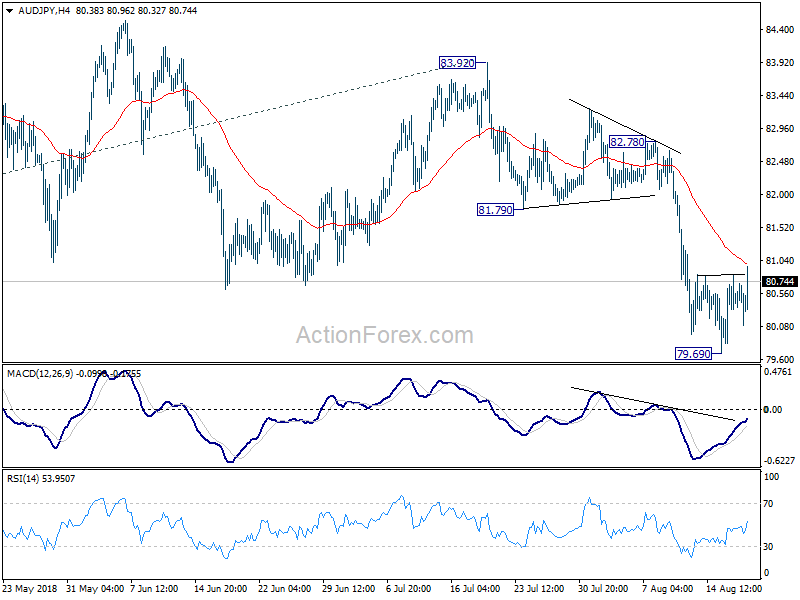
Looking a bit closer, if the above view is correct, then fall from 83.92, which started the downside breakout, should be a five-wave sequence. Having a look at the 4 hour chart, 79.69 should be, at worst the end of the third wave from 83.92. Hence, rebound from there is not even reversing the fall from 83.92.
So in our view, the rebound from 79.69 is likely just a counter trend move that corrects the fall from 82.78. That is, the above mentioned case b). With that in mind, 4 hour 55 EMA (now at 80.99) is the first hurdle. But more importantly, an important cluster resistance zone lies ahead. That is, 100% projection of 76.69 to 80.82 from 80.09 at 81.22, 50% retracement of 82.78 to 79.69 at 81.23, 38.2% retracement of 83.92 to 76.69 at 81.30. We do not expect, as a corrective move, the rise from 79.69 to pass through this 81.22/30 resistance zone.
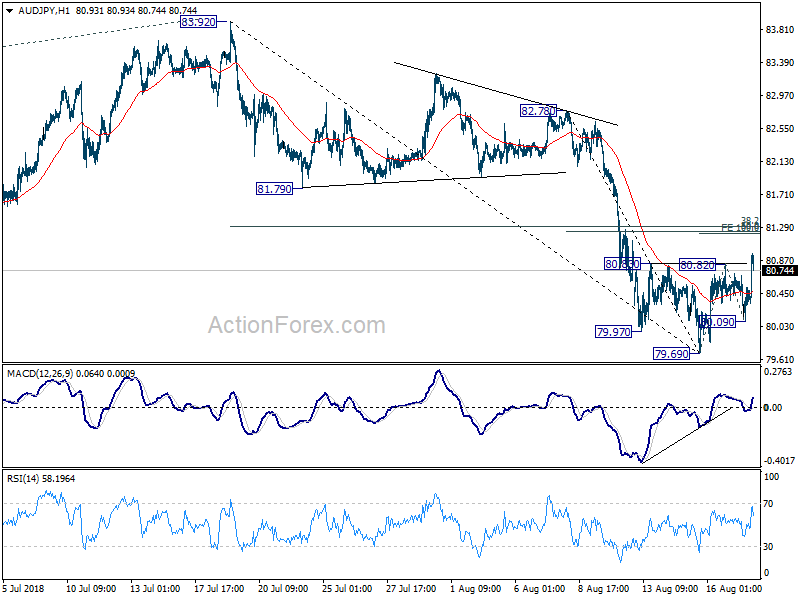
For head and should pattern, the target is usually calculated by adding the depth of the head to the neck line. That is, in this case, depth of the head is 80.82-79.69= 1.13. The target is thus 80.82+3.13=81.98. It's "substantially" higher than the above mentioned 81.22/30 resistance zone. Hence, we'd believe it's going to be a head and shoulder pattern failure.
As usual, we could be wrong. Let's see.
Tell us your views too.
EUR/USD Weekly Outlook
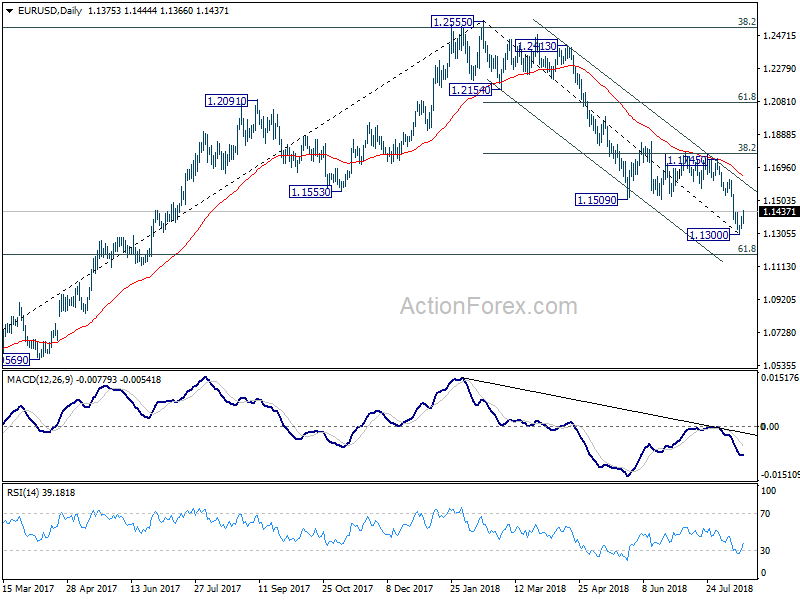
EUR/USD recovered after initial fall to 1.1300 last week. The break of 1.1430 minor resistance indicates short term bottoming, on mild bullish convergence condition in 4 hour MACD. Initial bias is mildly on the upside this week, for rebound to 1.1509 support turned resistance and possibly above. However, we'd expect upside to be limited below 1.1745 resistance. On the downside, break of 1.1300 support is now needed to confirm down trend resumption. Otherwise, near term outlook is neutral for more consolidation first.
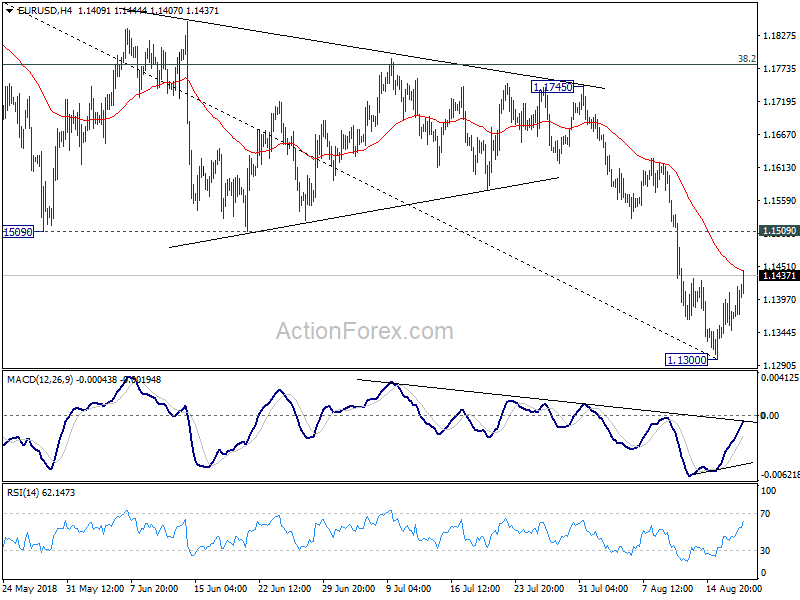
In the bigger picture, the down trend from 1.2555 medium term is in progress for 61.8% retracement of 1.0339 to 1.2555 at 1.1186. Note again that EUR/USD was rejected by 38.2% retracement of 1.6039 (2008 high) to 1.0339 (2017 low) at 1.2516. That carries some long term bearish implications. Sustained break of 1.1186 could pave the way back to retest 1.0339 low. For now, outlook will remain bearish as long as 38.2% retracement of 1.2555 to 1.1300 at 1.1779 holds, even in case of strong rebound.
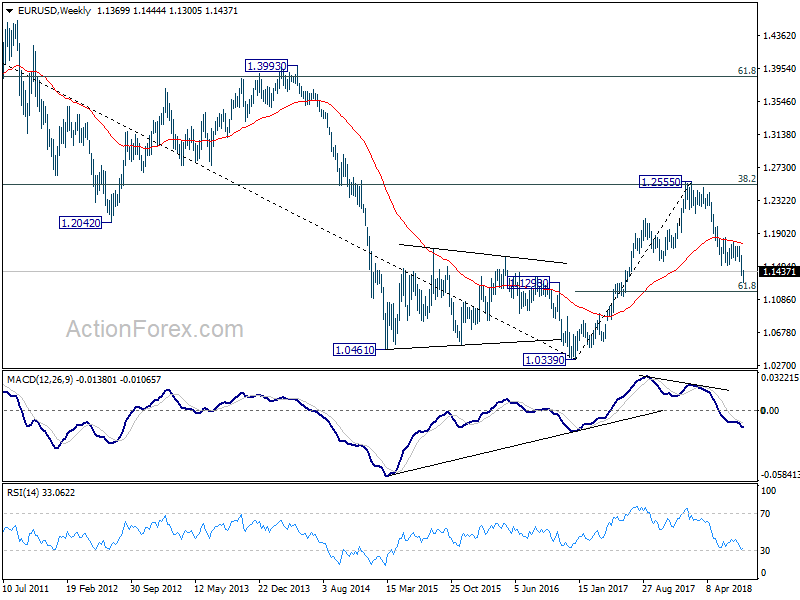
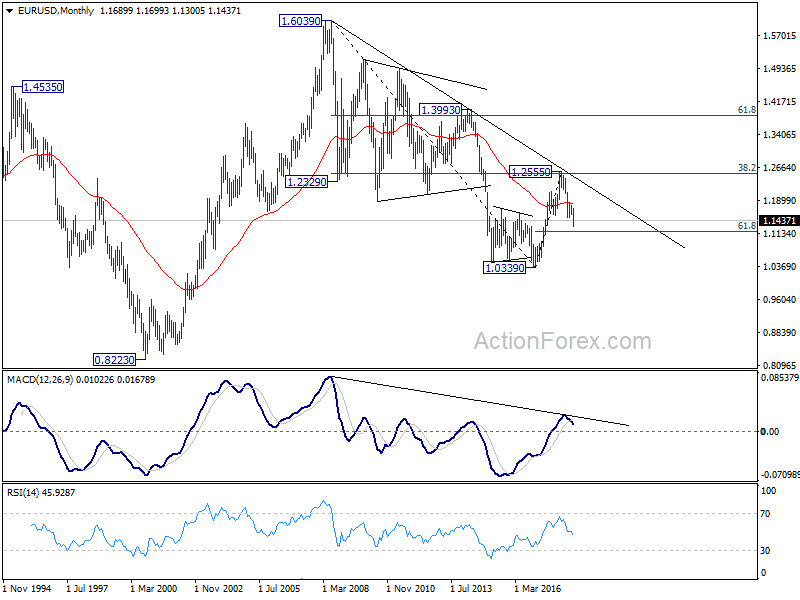
In the long term picture, the rejection from 38.2% retracement of 1.6039 to 1.0339 at 1.2516 argues that long term down trend from 1.6039 (2008 high) might not be over yet. EUR/USD is also held below decade long trend line resistance. Sustained trading below 55 week EMA adds bearishness to the case. Firm break of 61.8% retracement of 1.0339 to 1.2555 at 1.1186 should at least bring a retest on 1.0339 low.
USD/JPY Weekly Outlook
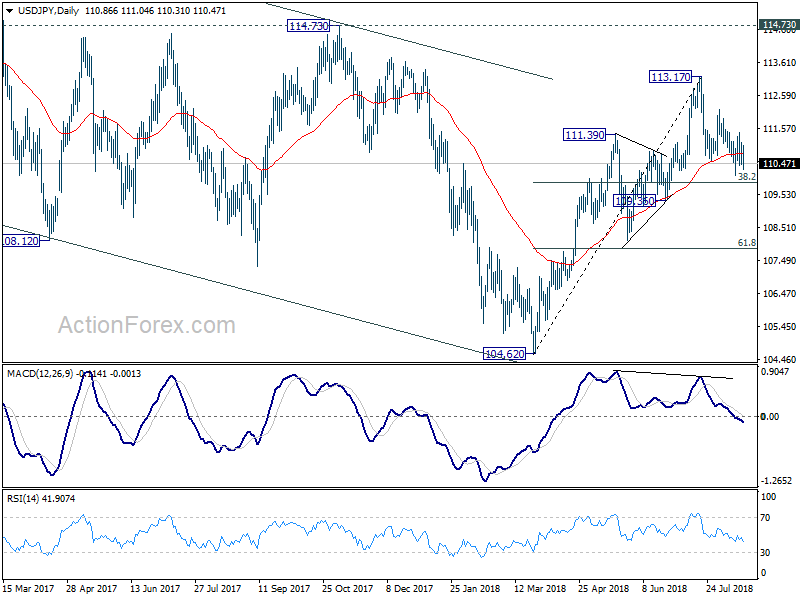
USD/JPY recovered to 111.42 last week but failed to extend gain and retreated. Initial bias is neutral this week first. And near term outlook is unchanged. The corrective decline from 113.17 might extend lower. But downside should be contained by 38.2% retracement of 104.62 to 113.17 at 109.90 to bring rebound. On the upside, above 111.42 will target 112.14 minor resistance first. Break will argue that larger rally is possibly resuming for above 113.17.
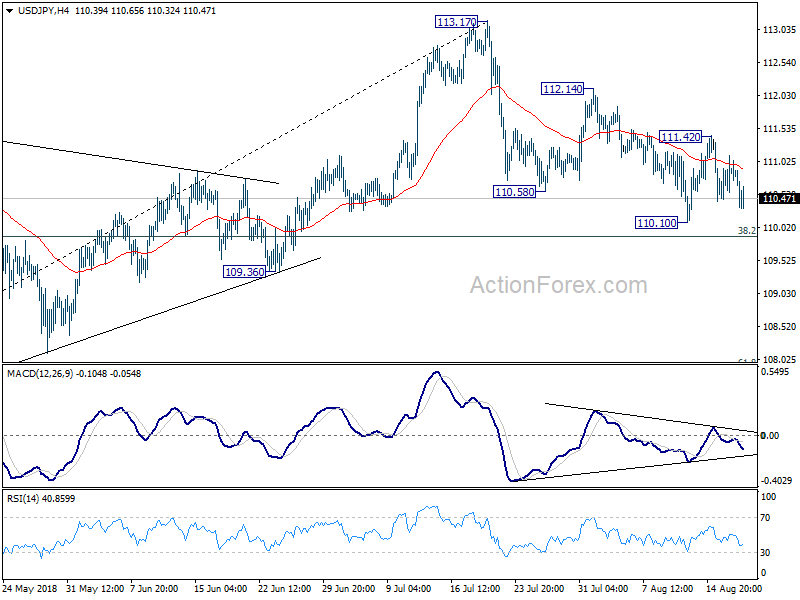
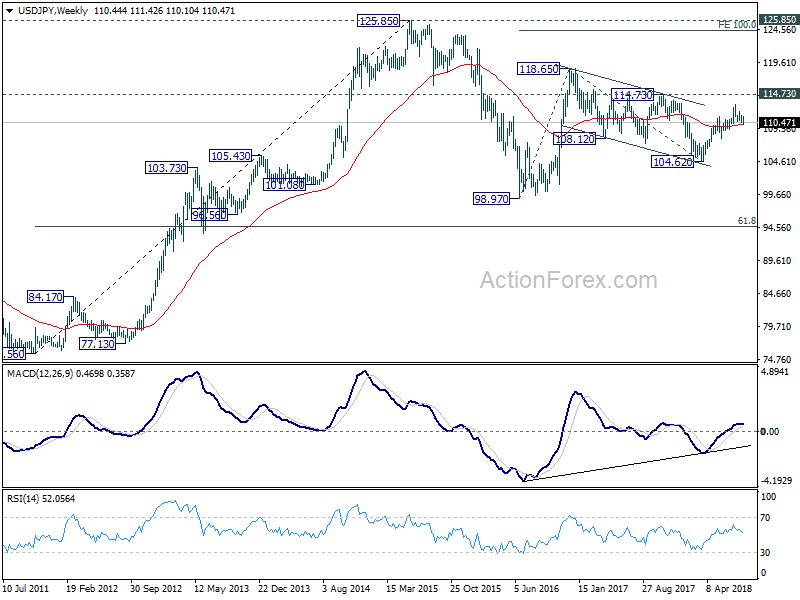
In the bigger picture, corrective fall from 118.65 (2016 high) should have completed with three waves down to 104.62. Decisive break of 114.73 resistance will likely resume whole rally from 98.97 (2016 low) to 100% projection of 98.97 to 118.65 from 104.62 at 124.30, which is reasonably close to 125.85 (2015 high). This will stay as the preferred case as long as 109.36 support holds.
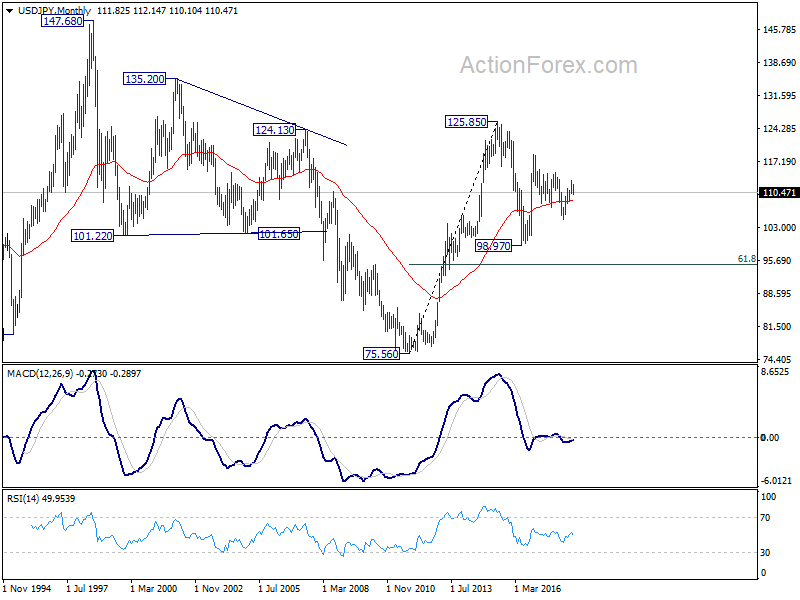
In the long term picture, the rise from 75.56 (2011 low) long term bottom to 125.85 top is viewed as an impulsive move, no change in this view. Price actions from 125.85 are seen as a corrective move which could still extend. In case of deeper fall, downside should be contained by 61.8% retracement of 75.56 to 125.85 at 94.77. Up trend from 75.56 is expected to resume at a later stage for above 135.20/147.68 resistance zone.
GBP/USD Weekly Outlook
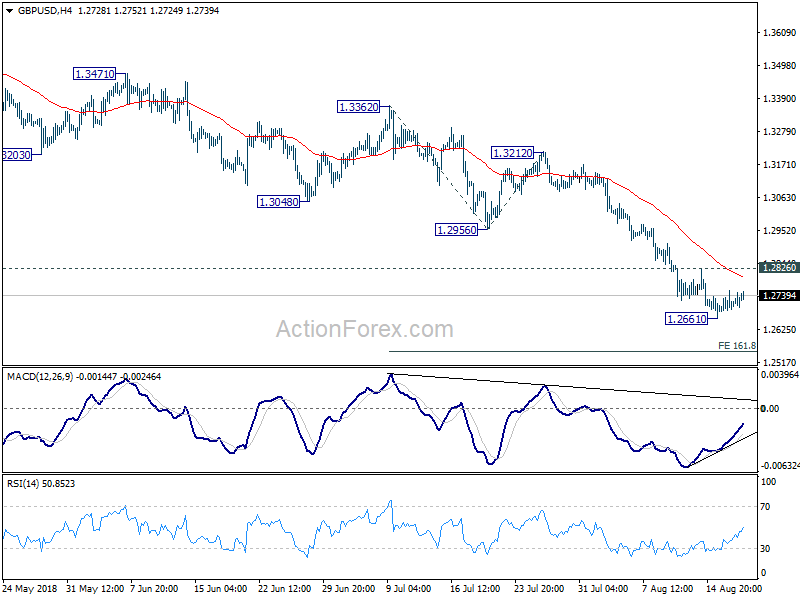
GBP/USD's decline continued last week and hit as low as 1.2661 before turning sideway. Initial bias stays neutral this week for consolidation first. As long as 1.2826 minor resistance holds, deeper fall is still expected. Break of 1.2661 will resume the whole fall from 1.4376 and target 161.8% projection of 1.3362 to 1.2956 from 1.3212 at 1.2555. Though, break of 1.2826 will indicate short term bottoming on bullish convergence condition in 4 hour MACD. And that would bring stronger rebound and lengthier consolidation first.
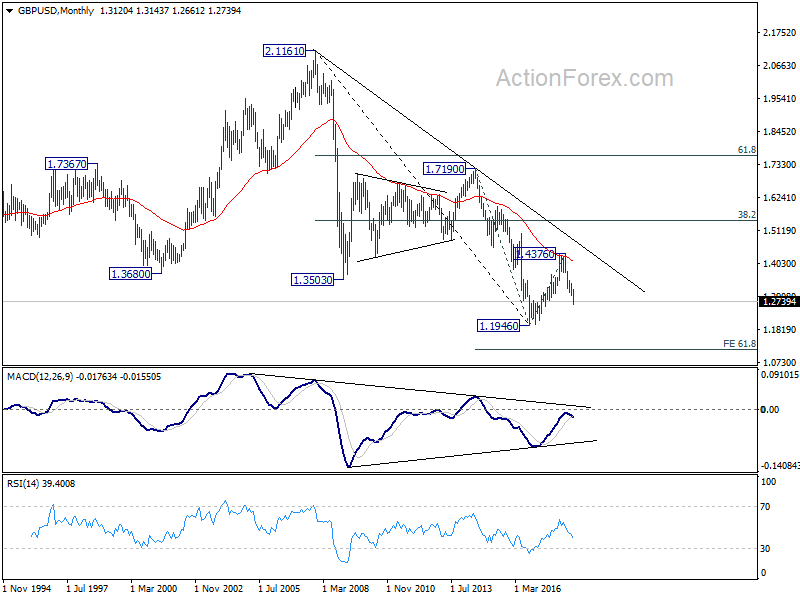
In the bigger picture, whole medium term rebound from 1.1946 (2016 low) should have completed at 1.4376 already, after rejection from 55 month EMA (now at 1.4091). Current downside acceleration argues that it's possibly resuming long term down trend. In any case, outlook will stay bearish as long as 1.3212 resistance holds. Retest of 1.1946 should be seen next.
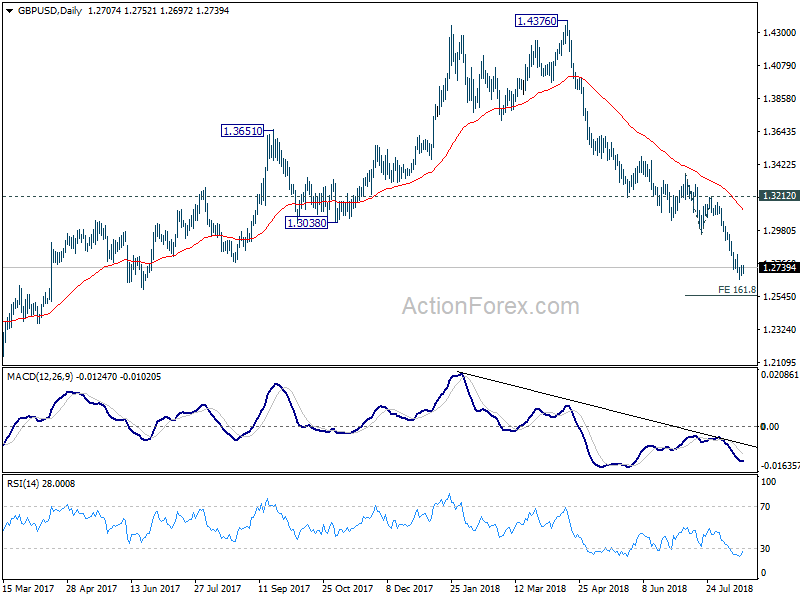
In the longer term picture, outlook in GBP/USD is held bearish. Rebound from 1.1946 was rejected solidly by falling 55 month EMA. The pair was limited well below 38.2% retracement of 2.1161 (2007 high) to 1.1946, as well as the decade long falling trend line. On break of 1.1946, next target will be 61.8% projection of 1.7190 to 1.1946 from 1.4376 at 1.1135.