Sample Category Title
Summary 8/20 – 8/24
Monday, Aug 20, 2018
[php_everywhere instance="1"]
Tuesday, Aug 21, 2018
[php_everywhere instance="2"]
Wednesday, Aug 22 2018
[php_everywhere instance="3"]
Thursday, Aug 23, 2018
[php_everywhere instance="4"]
Friday, Aug 24, 2018
[php_everywhere instance="5"]
Weekly Economic and Financial Commentary: Global Economy Displays Relative Calm
U.S. Review
Summer Spending at Restaurants, Bars Surges
- Retail sales data for July showed the U.S. consumer continuing to exhibit strength, with broad-based sales growth and a notable acceleration in food service & drinking places sales.
- Housing starts rose in July, led by small gains in both singleand multifamily starts, but the increase was below the Bloomberg consensus.
- Upward revisions to the June data helped offset a weak July reading for industrial production. The trend in industrial production remains solidly upward, with production over the past year notching the biggest one-year gain since early 2011.
Summer Spending at Restaurants, Bars Surges
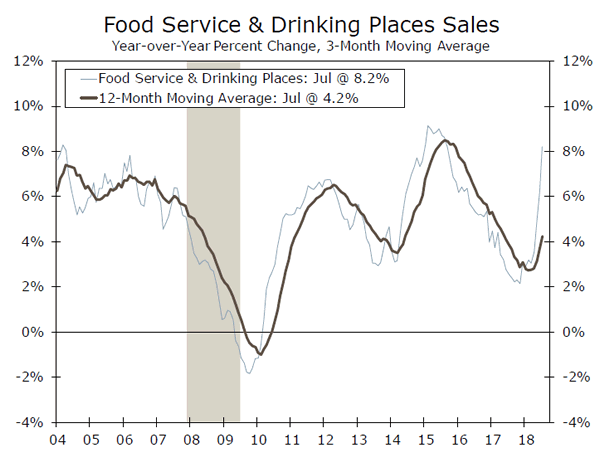
Broad-based strength in retail sales in July stole the show this week in U.S. economic data. Retailers reported a 0.5 percent monthly sales increase in July, led by surging spending at food service & drinking places. The year-over-year pace of sales at restaurants and bars has sharply accelerated (see chart on front page), and the three-month average annualized pace is the highest on record dating back to 1992. The strength in retail sales extended beyond this sector, as clothing sales, non-store retailers and even department stores posted strong starts to the third quarter. After a weak Q1 in which real personal consumption rose at just a 0.5 percent annualized pace, consumer spending bounced back to a robust 4.0 percent pace in Q2. The early data for Q3 suggest the weak Q1 was just an aberration and the underlying pace of consumption growth remains strong.
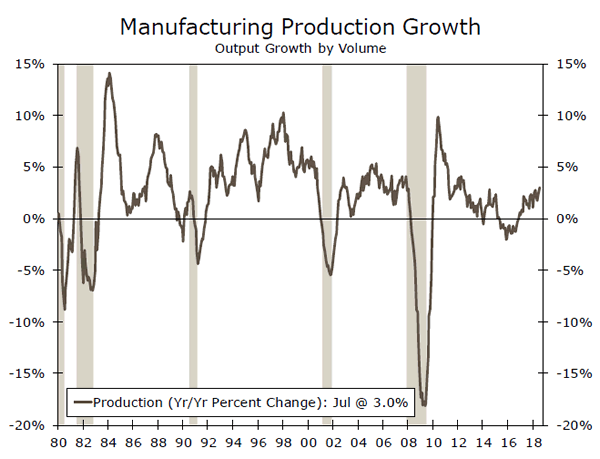
Industrial production expanded a scant 0.1 percent in July, which missed the mark of the 0.3 percent increase expected by markets. The miss can largely be traced to a 0.5 percent decline in the volatile utilities component, however, and an upward revision to June more than made up for the shortfall. Mining output dipped, the first monthly drop in more than a year, but the manufacturing sector showed no sign of slowing down as factory output rose 0.3 percent in July and 3.0 percent over the year (top chart). While the outlook for the industrial sector remains hazy amid trade war concerns, the near-term trend in industrial production remains solidly upward, with production over the past year notching the biggest one-year gain since early 2011. Job growth has matched the higher sentiment and output, as the 12-month change in manufacturing payrolls through July (+327,000) is the largest since April 1995.
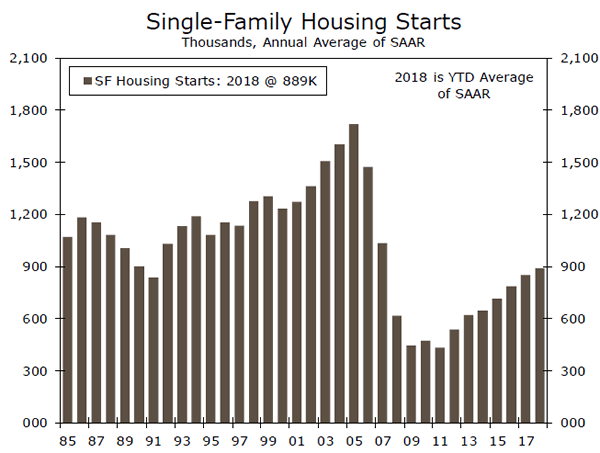
Total housing starts increased to a 1.168-million unit pace, rising 0.9 percent in July. While new units started in July came in below expectations for the second straight month, starts are still running 6.2 percent ahead of last year on a year-to-date basis. Despite the number of starts falling short of expectations, builder confidence remains high. That builders continue to express such a high degree of confidence in current market conditions supports our stance that housing starts will be stronger in coming months even though our expectations have been slightly scaled back recently. Singlefamily starts are still grinding higher as they have for most of this cycle (middle chart), though new homebuilding remains a much smaller portion of the economy than it was in the last expansion.
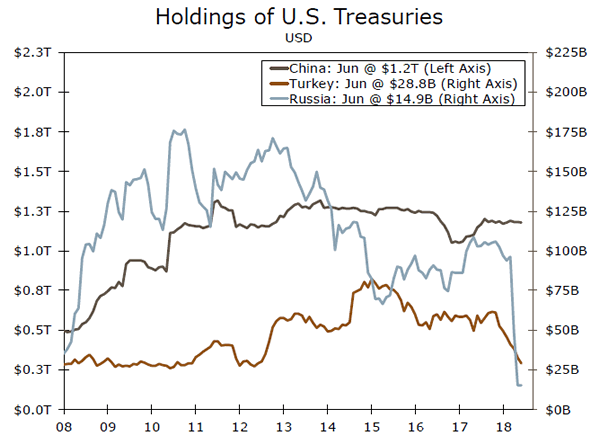
Finally, data on capital flows garnered some attention this week amid emerging market fears centered on Turkey. Holdings of U.S. Treasuries fell significantly in Turkey and Russia through the first half of the year (bottom chart). This multi-year low in June potentially signals that these countries had fewer foreign exchange reserves on hand to grapple with the softness in their currencies that has occurred over the past few weeks. For the U.S. Treasury market as a whole, however, Russia and Turkey are relatively small players compared to other foreign holders such as China, which holds more than $1 trillion in U.S. Treasuries. For now, China's holdings have been relatively steady, helping to limit any upward pressure on Treasury yields from foreign selling.
U.S. Outlook
Existing Home Sales • Wednesday
Existing home sales slowed to an annualized pace of just 5.38 million in June. Low inventories are still the primary problem holding back sales. However, there looks to be some improvement on this front. Total inventories climbed to 1.95 million in June, a large enough gain to make the year-over-year growth rate in inventories positive for the first time in three years. However, shortages remain a barrier to sales, especially in the South and West.
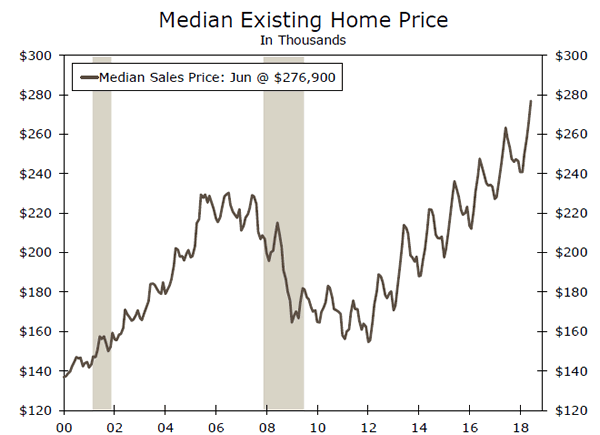
The median price of an existing home rose to $276,900 in June, a fresh all-time high. On a nominal basis, median home prices are 20 percent above their pre-recession peak. The debt service ratio (principle and mortgage payments as a share of disposable income) for mortgage debt remains historically low, as a result of household deleveraging and low interest rates since the financial crisis. However, higher home prices and rising mortgage rates risk putting homeownership out of reach for more households.
Previous: 5.38M Wells Fargo: 5.42M Consensus: 5.43M (SAAR)
New Home Sales • Thursday
New home sales fell 5.3 percent in June to a 631,000-unit pace. All regions saw declines, though the largest drop was in the South, which accounts for slightly more than half of new home sales. Sales have now fallen in two of the last three months, meaning weakness is becoming harder to dismiss as transitory.
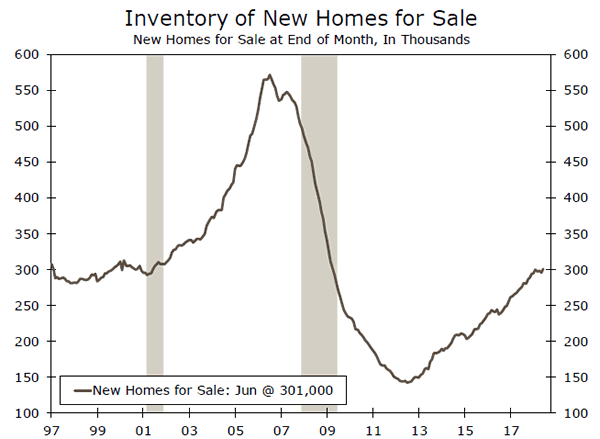
Lack of supply has been a persistent factor holding back sales, as the number of homes available for sale has failed to meet demand for homeownership. This remains a major part of the story; though inventories of homes rose in June, completed inventories remain near historic lows. However, another factor to watch is whether higher home prices and rising mortgage rates are serving to erode demand. In the University of Michigan's Consumer Sentiment Index, the share of consumers stating that now is a good time to buy a home continues to slide. We will be watching home sales and sentiment data for indications of further weakening.
Previous: 631K Wells Fargo: 648K Consensus: 650K (SAAR)
Durable Goods Orders • Friday
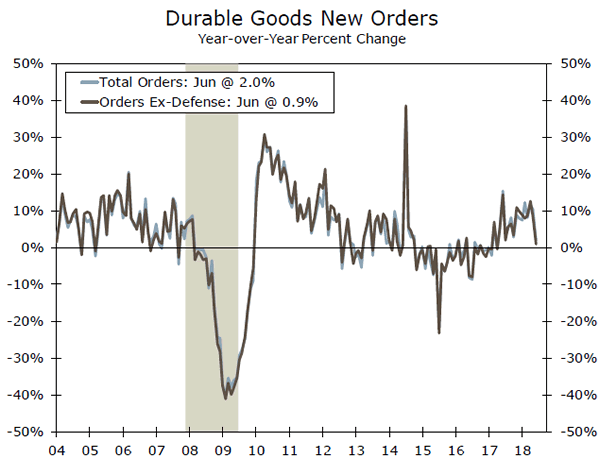
Durable goods orders rose 0.8 percent in June, well below preliminary expectations for 3.0 percent. Excluding the volatile transportation sector, however, orders were closer to expectations, up 0.2 percent versus a consensus estimate of 0.5 percent. In addition, May durable goods orders ex-transportation were revised higher from flat to a 0.3 percent gain. All-in-all, we see further indication of a modest expansion in the factory sector. Equipment spending contributed 0.2 percentage points to the strong 4.1 percent annualized pace of GDP growth in Q2. This was below the previous five quarters, but remained solid. We expect a larger contribution in Q3 given a pickup in core capital goods orders over the past several months, which we expect to continue in July. We are calling for 0.4 percent growth in durable goods orders ex-transportation in July. However, we expect a decline in aircraft orders to weigh on headline durable goods orders growth.
Previous: 0.8% Wells Fargo: -0.8% Consensus: -0.3% (Month-over-Month)
Global Review
Global Economy Displays Relative Calm
- While global markets have been somewhat volatile this week, in particular in Turkey, global economies have continued to display relative calm. U.K. retail sales recovered in July but employment growth has eased, though with inflation pressures absent the Bank of England should be on hold for some time.
- The latest round of Chinese economic data points to an economy that remains on a gradually slowing path, a trajectory that should see a continued pause in Chinese authorities' effort to reduce leverage in the economy. Meanwhile, Australia's economy is only slowly improving, suggesting Reserve Bank of Australia rate hikes are likely still some way away.
U.K.: Keep Calm and Carry On
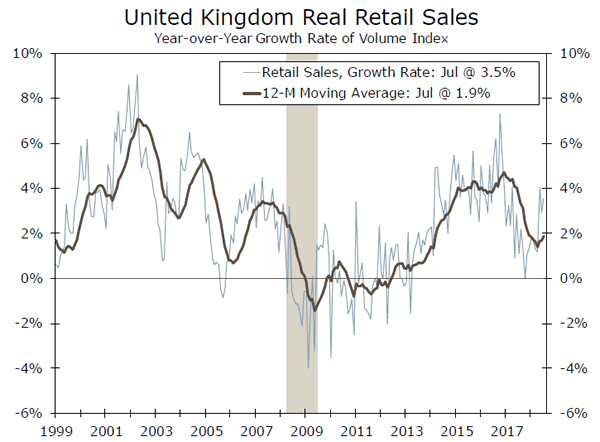
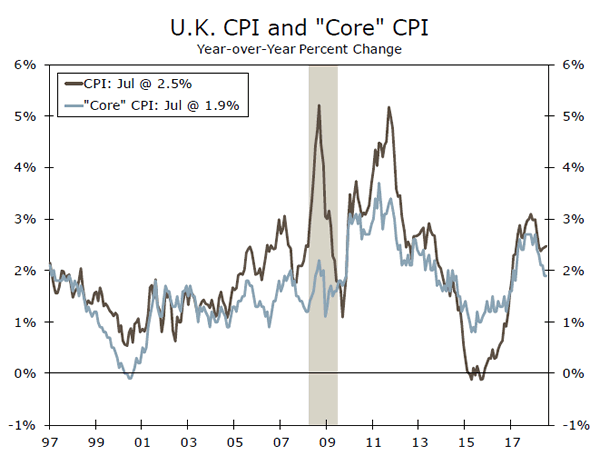
The British economy continues to show resilience, with the 0.4 percent gain in Q2 GDP (not annualized) representing a 22nd straight quarter of positive growth. That said, the economy's advance is steady rather than strong. July retail sales rose 0.7 percent month-on-month, essentially reversing their sizeable June drop, while the employment gain for the three months to June slowed to just 42,000. Meanwhile, wage and price pressures are dissipating. Although July CPI inflation ticked up to 2.5 percent year-on-year, core inflation was steady at 1.9 percent, slightly below the Bank of England's target, while wage growth also eased in June.
In addition, uncertainty surrounding Brexit persists. Brexit negotiations between the U.K. and European Union resumed this week, and so far there are no reports of significant progress, while the key issue of the Irish border has yet to be resolved. Given sluggish growth, little inflation and ongoing Brexit uncertainty we see little reason for the Bank of England to adjust policy further for now, and do not expect the next U.K. rate hike until well into 2019.
China's Economic Slowdown Continues
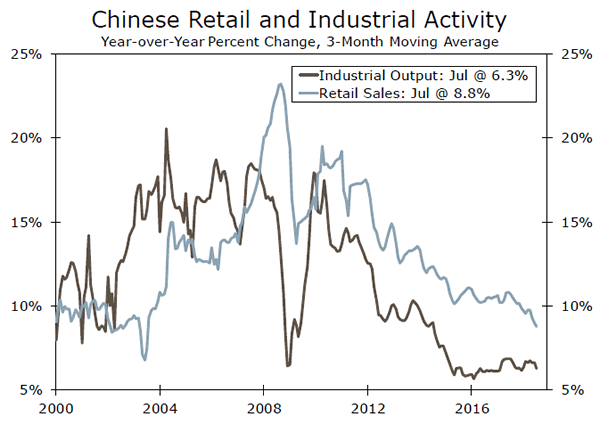
The latest round of Chinese data point to a continued slowdown in China's economy. July retail sales growth slowed to 8.8 percent year-over-year, while industrial production rose 6.0 percent yearover year, both below the consensus forecast. Growth in fixed asset investment also slowed, to 5.5 percent year-to-date in July. These latest economic figures come after confidence surveys also showed some softening in July.
Given the ongoing slowdown in China's economy and with some increase in global market volatility in recent weeks, Chinese authorities have temporarily paused their efforts to reduce leverage in the Chinese economy. Over the past few months the People's Bank of China has reduced the amount of funds that commercial banks need to hold as reserves against deposits, while the central bank has only occasionally and partially followed the Federal Reserve's rate hikes with its own interest rate moves. As a result, market interest rates in China have declined so far in 2018. Nonetheless, the central bank's policy actions have so far seemed to gain little traction, and a further growth slowdown and further Chinese policy moves remain possible.
Australia's Labor Market Gradually Improving
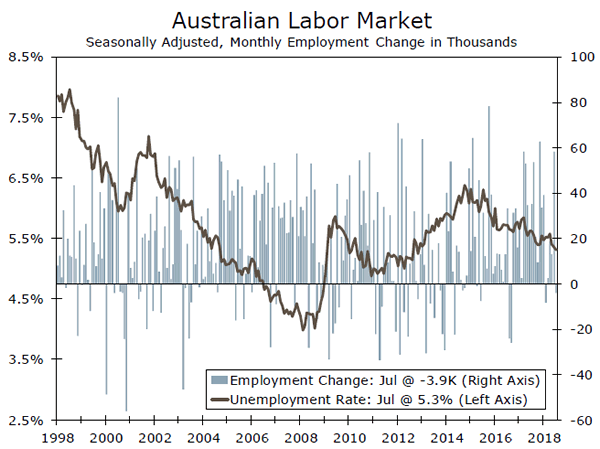
China's moderate economic performance has also translated into a modest performance for the Australian economy. Perhaps one on of the more encouraging areas has been the labor market. Even with July employment showing a fall of 3,900, the average monthly gain so far this year has been 17,100. The jobless rate dipped to 5.3 percent, while wage growth –as measured by the Wage Price Index– ticked higher to 2.1 percent year-over-year. Although there has been some improvement in the labor market, it has been gradual and not enough to prompt action from the Reserve Bank of Australia. Accordingly, the central bank should be on hold for some time, with an initial rate hike not expected until sometime next year.
Global Outlook
Canada Retail Sales • Wednesday
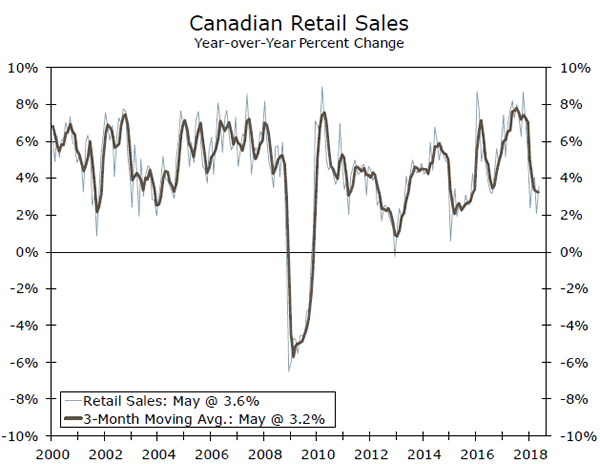
Canada's consumer spending started 2018 on a sluggish note, with growth of just 1.1 percent annualized in Q1. While high levels of household debt may be contributing to consumer caution, steady job gains and faster wage growth could see some moderate strengthening in household spending in Q2. Canada's May retail sales rose 2.0 percent month-on-month, and even with a forecast 0.7 percent payback in June, retail sales should be relatively healthy for Q2 as a whole. With consumer spending accounting for around 60 percent of overall GDP, and given firmer wages and inflation, the strength or otherwise of consumer spending could be important in determining when the Bank of Canada takes its next rate hike step.
On Wednesday, Mexico also releases June retail sales. Retail spending has firmed moderately this year, and for June we expect a small 0.2 percent month-on-month gain.
Previous: 2.0% Wells Fargo: -0.7% (Month-over-Month)
Eurozone PMIs • Thursday
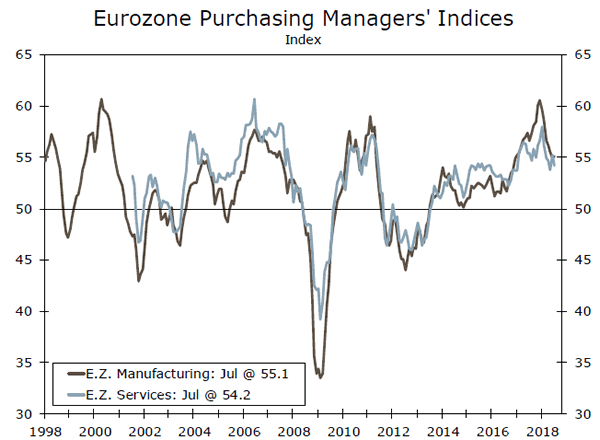
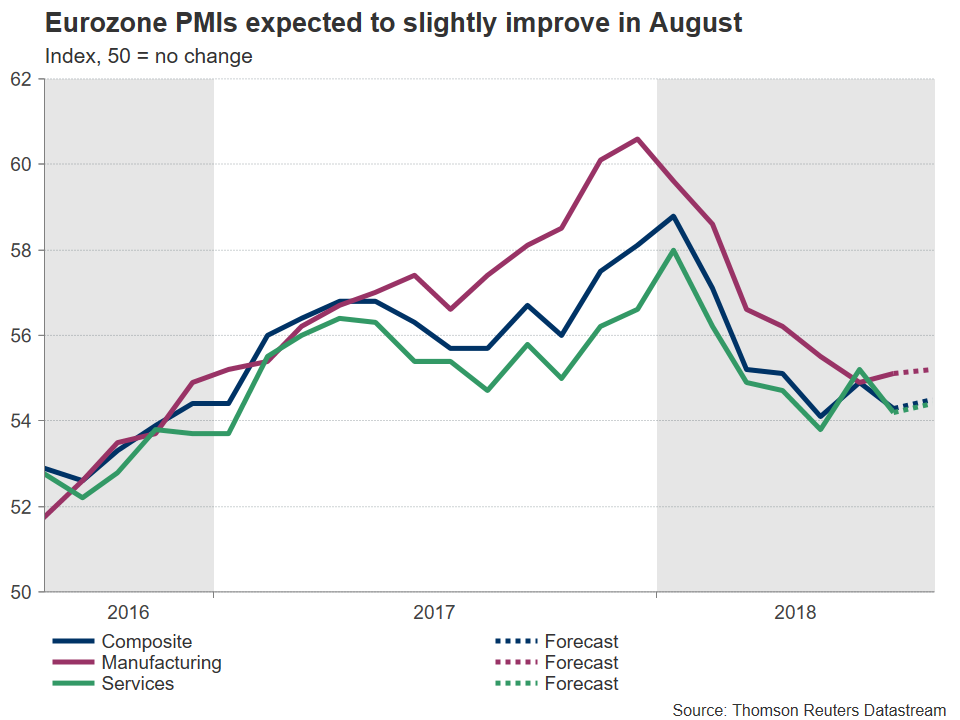
Next week sees one of the timeliest readings on the Eurozone economy, in the form of Markit's Purchasing Manager Indices. As the chart at left illustrates, these sentiment surveys have fallen markedly for both the manufacturing and service sectors this year, a decline that has also coincided with a perceptibly slower pace of growth. Eurozone GDP has advanced at just a 1.4 percent pace during the first half of this year.
The August PMIs surveys should offer insights into the prospects for a Eurozone growth recovery in the second half of 2018. The manufacturing PMI rose to 55.1 in July, and is expected to remain steady at 55.1 in August. There will likely be more interest in the services PMI, which fell to 54.2 in July, and should partially recover to 54.4 in August. With services accounting for the majority of the economy, it is the services PMI outcome that may be most influential for expectations of the path of the Eurozone economic growth.
Previous: 54.2 (Services); 55.1 (Manufacturing) Consensus: 54.4 (Services); 55.1 (Manufacturing)
Japan CPI • Friday
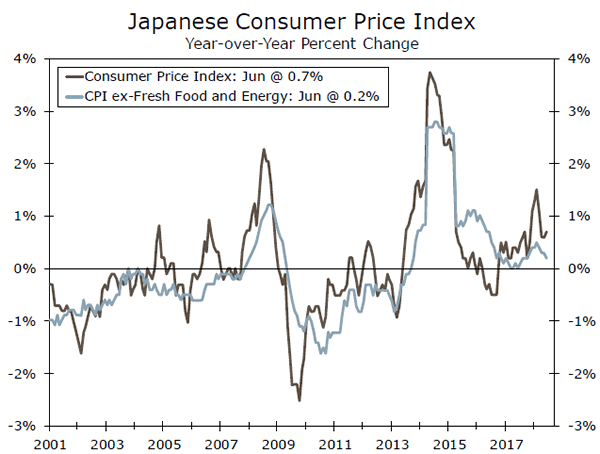
Japan's July CPI is released late next week, which has the potential to show modestly faster inflation than June. The overall CPI should pick up to 0.9 percent year-over-year (reflecting a similar quickening seen in Tokyo's July CPI), while the closely followed CPI ex-fresh food measure should rise by 0.9 percent year-over-year.
While Japanese inflation has risen gradually over the past several quarters, and there have even been signs of firmer wage growth, the rate of inflation has levelled out in recent months. Indeed, at its late July monetary policy announcement the Bank of Japan said it "intends to maintain the current extremely low levels of short- and long-term interest rates for an extended period of time", and lowered its CPI forecasts, even as it allowed for greater variability in 10-year government bond yields. Even if there is a modest uptick of inflation, Bank of Japan policy will likely remain on hold for some time.
Previous: 0.7% Wells Fargo: 0.9% Consensus: 1.0% (Year-over-Year)
Point of View
Interest Rate Watch
Will Turkey Affect Fed Policy?
Volatility returned to financial markets this week due to concerns about potential spillover effects related to the financial crisis in Turkey. We are sometimes asked what effect volatility in foreign financial markets will have on Fed monetary policy. The answer is "very little."
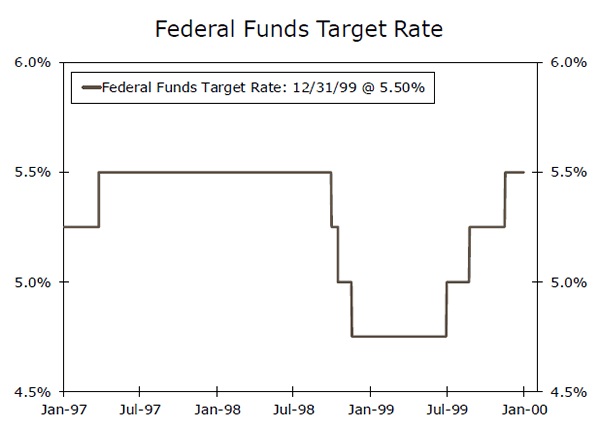
Fed officials fully understand that their actions have effects on foreign economies and financial markets. But they view the Federal Reserve as the central bank of the United States, not the central bank of the world. They are mandated by law to maintain "price stability" and to achieve "full employment." If the volatility abroad affects those variables, then Fed officials will respond. If it does not, then they won't. A look back to the "Asian financial crisis" is instructive. Prices of financial assets in many emerging market (EM) economies swooned in 1997 and 1998 as a series of financial and economic crises engulfed the developing world. Yet, the Fed left it target for the fed funds rate unchanged during most of that period (top chart). Only when the failure of Long-Term Capital Management threatened the U.S. financial system did Fed policymakers act, cutting the fed funds rate by a cumulative 75 bps in the autumn of 1998.
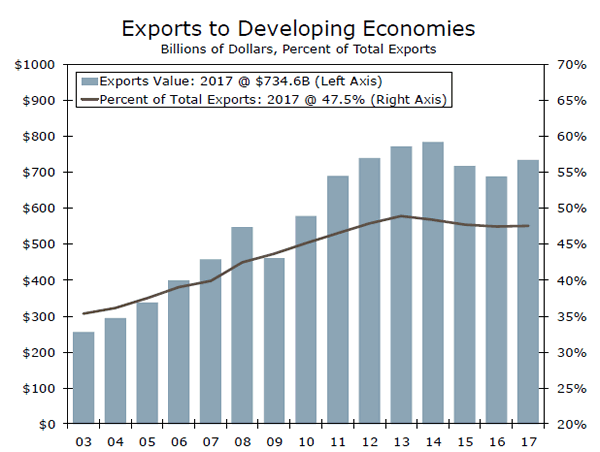
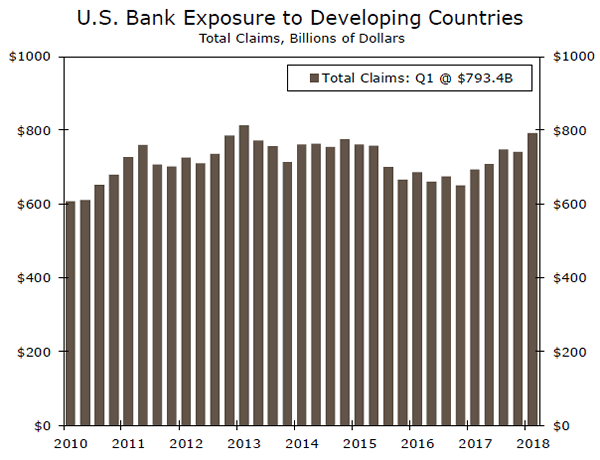
As we pointed out in a report this week, the financial and economic exposure of the United States to EM economies is limited. (See "How Exposed Is the U.S. Economy to EM Economies?" which is posted on our website.) American exports of goods to all EM economies totaled about $700 billion last year (middle chart), which is equivalent to only 4 percent of U.S. GDP. So American exports to the developing world would need to collapse to have a meaningful effect on U.S. GDP growth. In that regard, the value of U.S. exports to EM economies fell by only 4 percent between 1998, the worst year of the crisis, and 1999. American banks have nearly $800 billion worth of exposure to developing economies (bottom chart), but that amount represents only 5 percent of their total financial assets. The bottom line is that the weakness in EM financial markets today would need to become much worse to prevent the Fed from tightening further later this year.
Credit Market Insights
Household Debt Continues Its Rise
The New York Fed's Quarterly Report on Household Debt and Credit, released this week, revealed that total household debt rose for the 16th consecutive quarter. Debt outstanding rose a modest 0.6 percent in Q2 to $13.3 trillion, or roughly 65 percent of GDP, and is now 19 percent higher than the post-recession trough reached in Q2-2013.
Despite Fed policy normalization driving interest rates higher across the economy, the health of household credit appears to remain strong. The aggregate delinquency rate improved slightly to 4.5 percent, as Fed officials cited an improved labor market and income repayment plans in particular as drivers of the improvement in the student loan delinquency rate. Notably, the proportion of consumers with a collection account has plummeted 23 percent over the past three quarters. However, this was largely anticipated and reflects changes to reporting standards enacted under the National Consumer Assistance Plan. That said, eight million fewer individuals now have a collection account on their credit report. Of those, the majority had low credit scores to begin with and 18 percent saw their credit scores rise 30 points or more.
Methodology changes aside, household debt's steady climb indicates consumers have thus far been largely undeterred by rising interest rates. We expect the Fed to hike again in September and December and will continue to monitor monetary tightening's effects on the consumer.
Topic of the Week
Emerging Market Contagion Risks
Turkish assets have been hammered in the past two weeks, due largely to concerns about the amount of Turkey's foreign currency-denominated debt. This situation has raised questions about parallels to the emerging market (EM) financial crises of 1997-1998, which started in Thailand and spread through much of East Asia. Are other EM economies vulnerable to an external debt crisis à la Turkey?
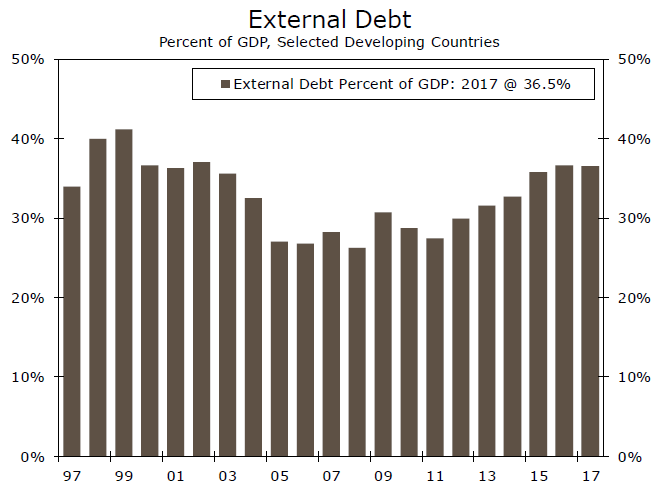
To answer this question, we start by looking at the external debt loads of EM economies. In our sample of 19 large developing countries (excluding China), the external debt-to-GDP ratio is 37 percent, higher than in 1997. These countries collectively owe more than $5.0 trillion in external debt, a significant sum.
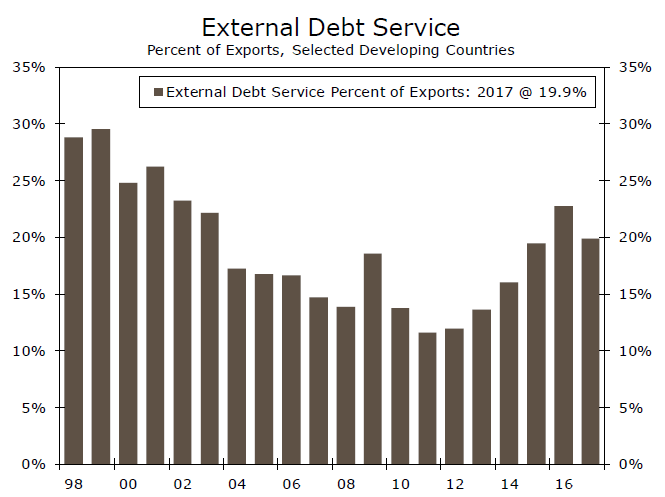
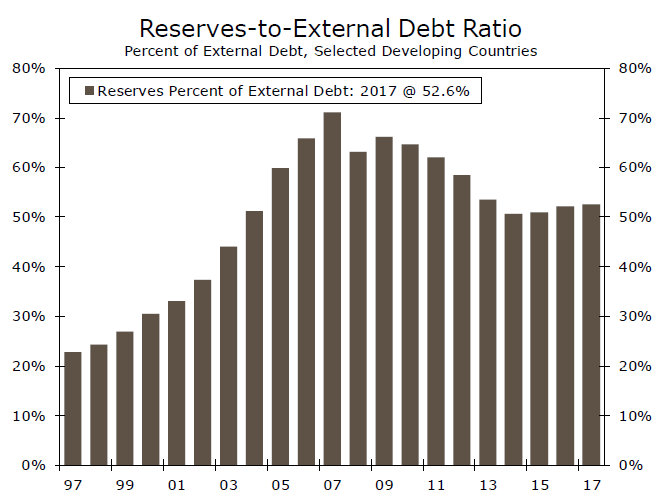
However, many developing countries are better equipped to deal with external debt loads than they were 20 years ago. Most developing countries now allow their currencies to float, which means that central banks can let currencies adjust gradually downward in response to financial stress. This contrasts with the 1997-1998 period, where EM central banks in countries with fixed exchange rates were forced to drastically hike interest rates to defend their currencies. Furthermore, EM economies have lower external debt service-to-export ratios than 20 years ago, meaning better ability to service their debt (top chart). Larger war chests of foreign exchange reserves can also help developing countries counter some of the downward pressure on their currencies.
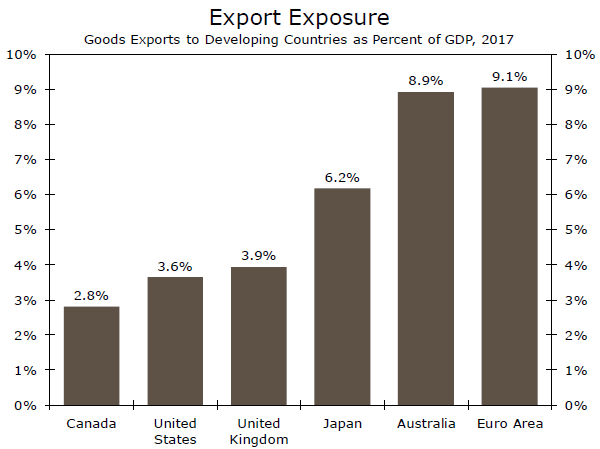
Based on these considerations, we think that any Turkeylike financial crises would be country-specific rather than systematic as in 1997-1998. Even if we are proved wrong on this front, we are not overly concerned about the exposure of advanced economies, including the United States. Exports to developing countries make up a relatively small share of GDP in major economies (bottom chart). The exposure of the banking systems is also relatively small as a share of financial assets.
The Weekly Bottom Line: Bench Strength
U.S. Highlights
- Concerns about Turkey drove market volatility this week, but U.S. equity markets managed a rebound.
- Strong retail sales and historically-high small business optimism suggest a strong economic expansion in the U.S. this quarter.
- Although concerns eased by week's end, Turkey is not out of the woods yet. It remains in the early stages of a balance of payments crisis, and is likely to trigger further bouts of market volatility.
Canadian Highlights
- Canadian economic data continued to impress this week. A solid resale housing report, respectable manufacturing numbers and surprisingly strong inflation all paint a picture of a healthy economy.
- Of particular note, home sales rose for a third straight month, as did average sale prices. Evidence continues to mount that, as expected, the impact of cooling measures early in the year have been short-lived, even if there remains lots of lost ground left for sales to make up.
- Economic risks remain very real, but continued solid out-turns suggest that the next policy interest rate hike is not that far off.
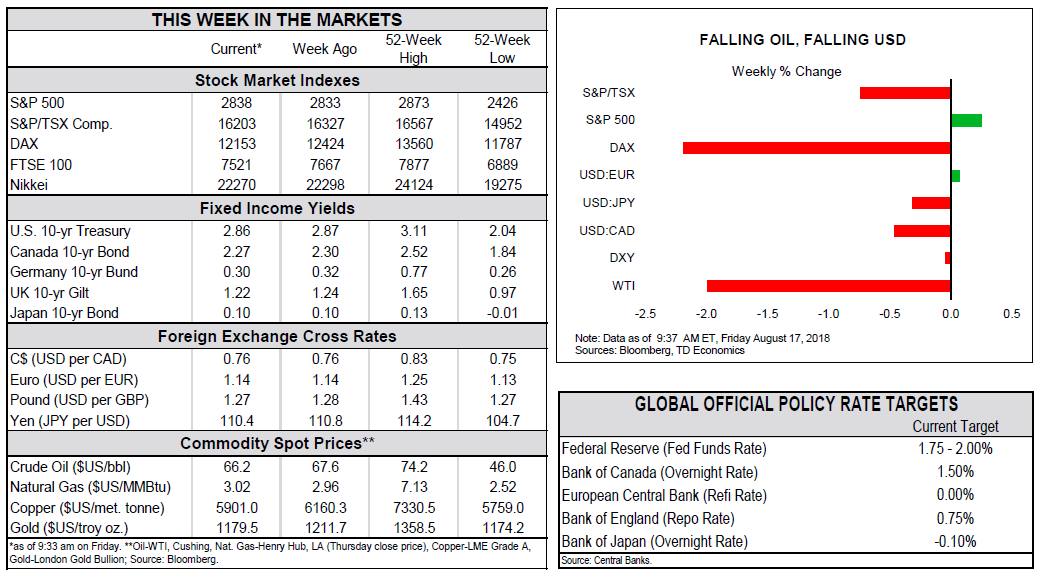
U.S. - Markets Brush Aside Emerging Market Fears For Now
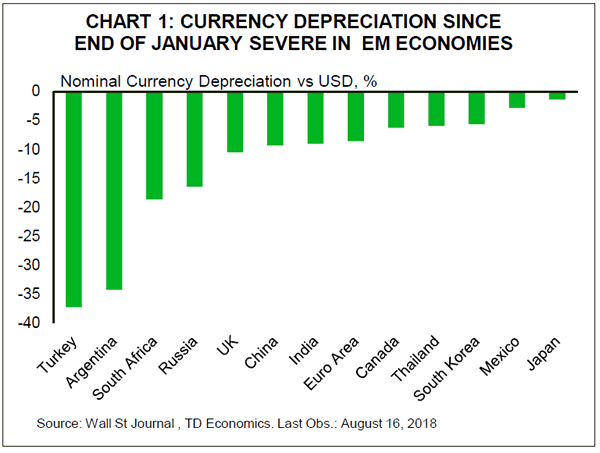
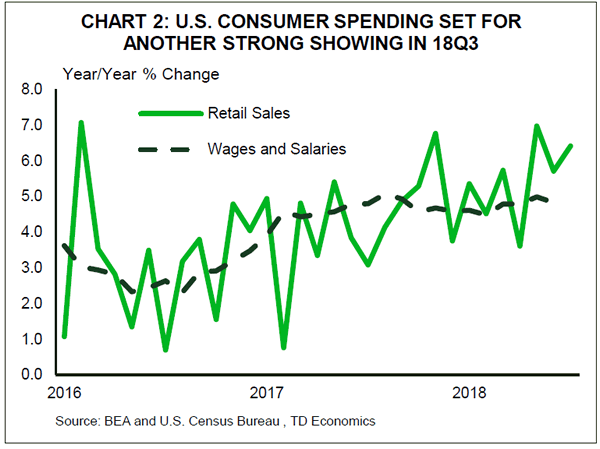
Concerns about Turkey drove volatility in global financial markets this week, but U.S. equity markets rebounded as contagion fears diminished. A key factor driving emerging market concerns is the strong U.S. economy. Robust economic growth and rising interest rates favor U.S. assets, and the safe haven flows driven by emerging market fears drives dollar strength (Chart 1). This week, we received further affirmation that the U.S. economy is on course to post another strong showing this quarter. Retail sales, a key indicator of consumer spending, expanded 0.5% in July, well above expectations (Chart 2). Moreover, despite trade policy uncertainty and ever more acute labor shortages, small business optimism remains at a historical high. Although housing starts in July were somewhat disappointing, the combination of strong permits and rising wages should support a gradual uptick in construction in upcoming months.
As the U.S. economy hums along nicely, other economies are not faring so well. Turkey experienced a large selloff of assets and the lira as it failed to take action to calm debt fears. Last quarter, concerns about the financial outlook for Argentina drove a dramatic depreciation in the peso, forcing the central bank to raise domestic policy interest rates to 40% in an attempt to slow capital outflows. Like Argentina, Turkey depends heavily on foreign capital to finance domestic spending. Moreover, President Erdogan has weakened Turkey's political institutions and refused to allow domestic interest rates to rise. This has amplified concerns that Turkey is headed for a debt crisis.
Like Argentina, Turkey is too small in the scope of the global economy to trigger a broader global crisis. Turkey's economy is responsible for about 1.7% of global annual output (2016 purchasing power parity), a little more than Canada at 1.4%. Contagion risk via trade linkages is low, although Europe is most exposed. Similarly, financial contagion is limited, with Spanish, Italian, and French banks at risk to lose a tiny proportion of foreign loans.
That said, contagion to other economies can still occur through confidence and sentiment channels. That was evident this week with the turmoil in global financial markets that drove a selloff in risk assets and emerging market currencies, and a bid for developed market bonds. Further bouts of volatility are likely as emerging market economies with large imbalances are targeted one-by-one by increasingly discerning investors.
Although concerns eased by week's end, Turkey is not out of the woods yet. It remains in the early stages of a balance of payments crisis. A sudden stop to capital inflows has occurred, and the next step for Turkey involves spending cuts and an emphasis on boosting exports to help generate foreign currency required to pay for its large external obligations. The medicine will be bitter, but the sooner Turkish authorities follow through with interest rate increases, capital controls, and fiscal spending cuts, the more likely they can mitigate the economic fallout.
Canada - Bench Strength
Concerns over the situation in Turkey dominated the economic headlines this week, but here in Canada, it was a much more constructive story, with a string of positive economic data out this week. How solid was the data? In the spirit of summer levity, perhaps a baseball analogy is in order.
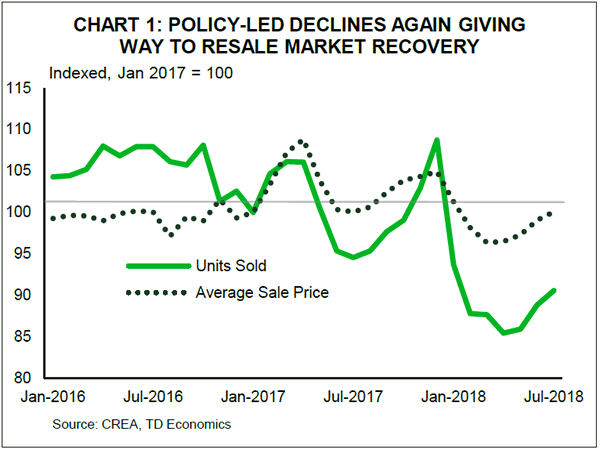
First up to bat, hitting a double, was the latest read on the resale housing market. Sales activity was up for a third straight month, with more than half of local markets reporting activity gains. Why a double and not a homer? Activity in the GVA was stagnant, and some key markets, such as Calgary and Winnipeg, saw sales slip. Nevertheless, with the key Toronto market leading the way, average national price rose again for a third straight month, back to January 2017 levels (Chart 1). Past experience has shown that macroprudential cooling measures, such as the mortgage underwriting rules brought in at the start of this year, tend to have dramatic but short-lived impacts on activity (usually on the order of about 6 months). It seems this latest round is no different.
Next up was manufacturing sales. Back at it after an earlier injury (unexpected production disruptions in the energy sector), it hit a single. Sales rose a respectable 1.1% month-on-month in June, with volumes gaining 0.7%. Non-durable goods led the way – no big surprise as petroleum and coal product sales shot up 15.9% as facilities were back online. Durable goods came in a bit softer, flat in volume terms as gains in autos were offset by a decline in the volatile aerospace sector.
Given the respectable gain in overall sales, why does this data qualify as just a single? The forward-looking parts suggest some trouble on the horizon, with new orders falling on the month and unfilled orders up only a few ticks. What's more, that old injury is set to flare back up: disruptions late in June at a sizeable Syncrude facility should serve to slow down over the summer months.
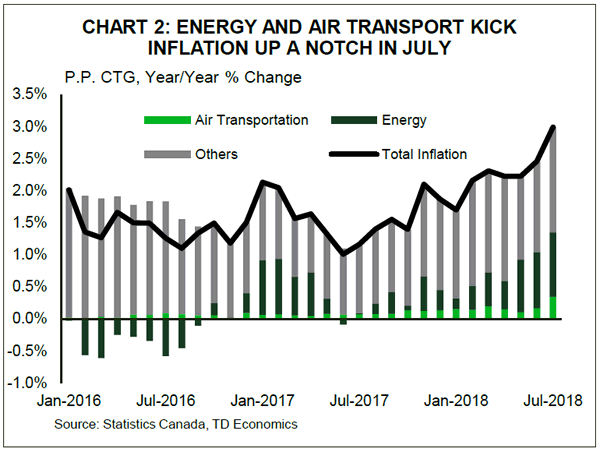
Inflation rounded things out. This data typically rates as a single, but July gave us a surprise double. Headline price growth hit 3% y/y for the first time since 2011 on the back of oil prices and surprise gains in transportation services (Chart 2: for the stats nerds out there, air transportation's contribution was a six standard deviation event). Still, inflation pressures were not widespread, as the Bank of Canada's core measures stayed at the 2% mark – on target and consistent with more rate increases, but rushing to hike on seeming one-offs would be an unforced error.
So, two doubles and a single: not a bad performance for this part of the lineup. There is, of course, still a risk of a bench-clearing brawl stemming from the trade front, where progress continues to be slow. Plus, housing may have turned in a double, but it can be injury prone. With elevated debt levels and adjustments ongoing in some markets, the team doctor will be watching this player closely. But, if you're the Bank of Canada, the economic performance is clearly encouraging. So long as we stay brawl-free, more rate hikes are in store, with the next most likely to come this October.
Canada: Upcoming Key Economic Releases
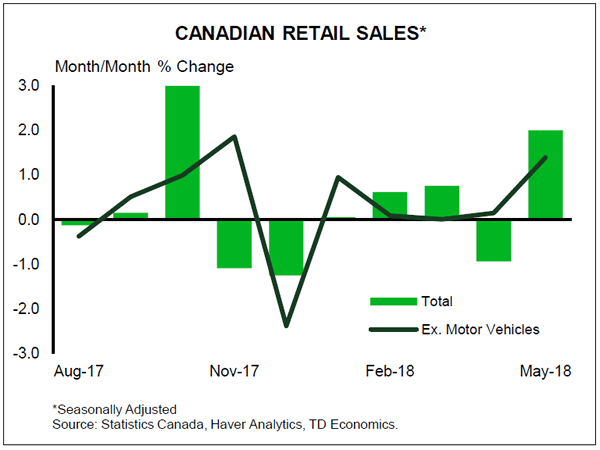
Canadian Retail Sales - June*
Release Date: August 22, 2018
Previous: 2.0%, ex-auto: 1.4%
TD Forecast: -0.5%, ex-auto: -0.2%
Consensus: N/A
TD looks for retail sales to fall by 0.5% in June on a pullback in motor vehicles, while core measures should see a more modest decline. Preliminary data indicates a slowdown in auto sales but we do not expect a full unwind of May's increase, which was largely a rebound from cold weather. Outside of autos, gasoline stations will also act as a modest headwind on lower prices at the pump, leaving ex-auto sales down 0.2%. In real terms, retail sales should decline by roughly 0.7% but rise by 2.9% (saar) for Q2 as a whole, consistent with a rebound in household consumption from the 1.1% pace in Q1.
Which Major Economies Have Exposure to EM Economies?
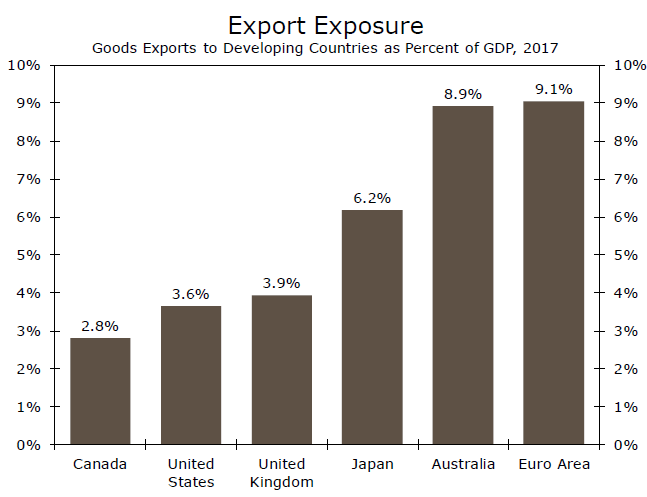
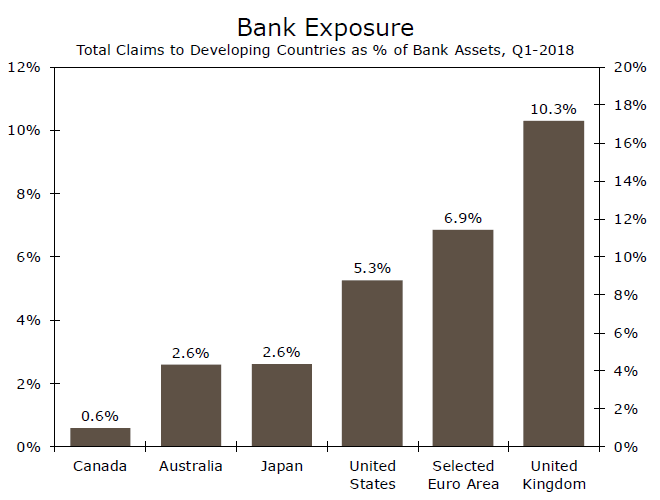
The Eurozone appears to have the most financial and economic exposure to EM economies. However, if external debt issues in the developing world are not systemic, then we are not overly concerned about that exposure.
The Eurozone May Be the Most at Risk
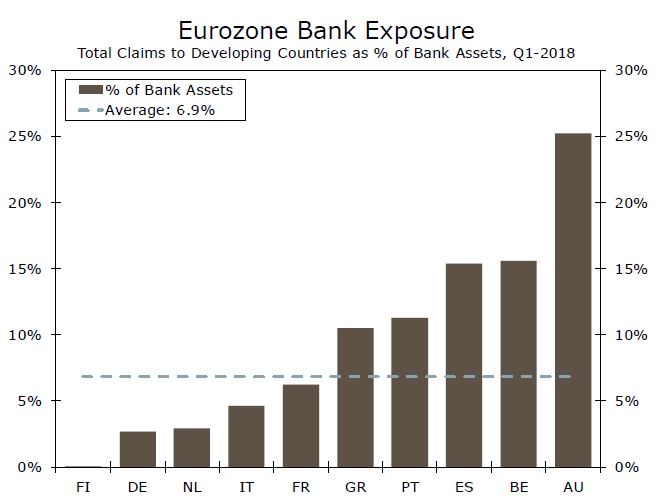
In the third of three reports on the fallout from financial crises potentially sweeping through the developing world, we analyze the amount of economic and financial exposure that major economies have to emerging market (EM) economies.1 In terms of exports, the euro area and Australia have the most to lose among major economies, as exports of goods to EM economies are equivalent to 9 percent of their respective GDPs (top chart). Developing Asia accounts for the vast majority of Australia's export exposure to EM economies, while the export exposure of the Eurozone is more broadly distributed among EM regions. On the other end of the spectrum, exports to the developing world are equivalent to only 3 percent of Canadian GDP.
Moving on to bank exposure, the United Kingdom appears to have the most to lose among major economies, with claims on developing economies representing 10 percent of the financial assets of British banks (middle chart). U.K.-based banks have broad exposure to EM economies, but their exposure to developing Asia is especially pronounced. In our view, developing Asia probably is the least vulnerable among EM regions to external debt crises due in part to the vast war chests of foreign exchange reserves that many countries in developing Asia possess. In other words, the risk to U.K.-based banks from potential external debt crises in EM economies likely is not as high as first meets the eye.
Claims on EM economies account for about 7 percent of the financial assets of the banking system in the euro area. The Eurozone of course consists of 19 individual economies, and we have banking data for 10 of these countries. (These 10 individual economies account for 95 percent of Eurozone GDP.) The Eurozone country with the most absolute amount of bank exposure to EM economies is Spain, which has more than $640 billion worth of claims on EM economies. But Spain also has some fairly large banks, which may be able to absorb some losses on their EM financial assets. So what we are really interested in is the amount of EM exposure that each country has as a percentage of its banking system assets. By that measure, Austria, which has extensive banking ties with countries in Central and Eastern Europe, has the most relative exposure to EM financial assets among Eurozone countries.
To reiterate the gist of our first two reports, however, we do not think that the financial issues that Turkey is now facing are systemic to the entire developing world. Individual economies, such as Turkey and a few others, could indeed face financial difficulties in coming weeks and months. But we do not think that a wave of financial crises will engulf the developing world à la 1997-1998. Consequently, we are not overly concerned about the economic and financial exposure that the Eurozone has to EM economies.
Is Turkey a Canary in the Emerging Market Coal Mine?
Some other individual emerging market (EM) economies could have their own financial problems à la Turkey. But we think any financial crises in the EM world would be individual episodes rather than systemic.
Are External Debt Problems in Developing Economies Systemic?
Turkish assets have been hammered over the past few days due largely to concerns about the amount of Turkey's foreign currency-denominated debt, and fear of "contagion" has led to selling pressure on other emerging market (EM) assets more broadly. Are other EM economies vulnerable to an external debt crisis à la Turkey? Is Turkey the canary in the EM coal mine like Thailand was in 1997?
In this report, we update an analysis that we did last year.1 Yes, the external debt of a sample of 19 large developing economies (less China) has swelled from less than $2 trillion in 1997 to more than $5.0 trillion today. Those economies have grown over the past two decades, which has increased their capacities to incur debt, so we should scale their external debt by their GDP. But there still may be cause for concern because their collective external debt-to-GDP ratio is 37 percent, which is higher than in 1997 (top chart).
But in our view, many developing economies are better equipped to deal with their external debt loads than they were 20 years ago. For starters, most developing economies allow their currencies to float at present, rather than maintain fixed exchange rates, as they did heading into the financial crises of 1997-1998. Consequently, central banks can allow the exchange rate to adjust gradually downward, and they do not need to jack up interest rates to defend their currencies to the same extent as they would under fixed exchange rate regimes. Less monetary tightening means that their economies are more resilient than they would be under fixed exchange rates.
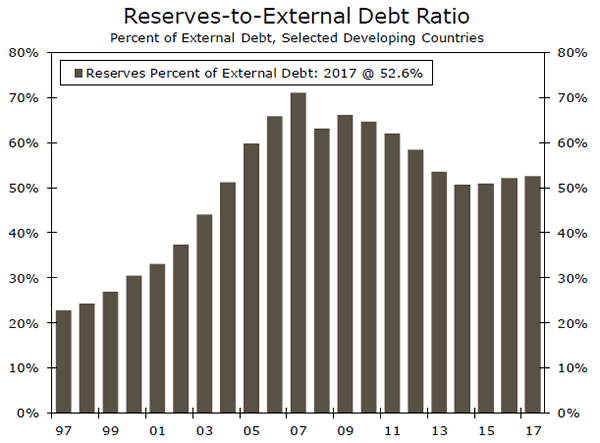
Furthermore, the ability of many EM economies to service their external debt is a bit better today than it was two decades ago. In 1997, the debt service-to-export ratio of the developing economies in our sample was nearly 30 percent (middle chart). It is only 20 percent today. In addition, EM economies have larger war chests of foreign exchange reserves, which they can use to counter some of the downward pressure on their currencies. Reserves as a percent of external debt stand at 53 percent today, more than twice as high as it was twenty years ago (bottom chart).
That said, some individual economies other than Turkey could potentially face financing challenges. In the report we wrote last year, we developed a simple methodology that we used to order countries that may be most vulnerable to a financial crisis. Interestingly, our methodology ranked Turkey as one of the most vulnerable countries to financial crisis, and we refer interested readers to our earlier report to the full list of countries. Vulnerable counties could experience their own external debt crises if their currencies continue to come under downward pressure and/or if the Fed hikes rates further. But we think that any other Turkey-like financial crises would be country specific rather than systemic à la 1997-1998.
Yen Gains Ground as Greenback Loses Luster
The Japanese yen has posted losses in the Friday session. In the North American session, USD/JPY is trading at 110.45, down 0.40% on the day. On the release front, Preliminary UoM Consumer Sentiment disappointed, dropping from 97.1 to 95.3 points. This missed the forecast of 98.1 points. There are no Japanese events on the schedule.
After a summer of tit-for-tat tariffs between the U.S and China, the two economic giants are scheduled to hold trade talks at the end of August. Although the talks will be held by low-level delegations, the fact that the parties are talking rather than imposing tariffs has raised hopes that trade tensions will ease. The U.S dollar has benefited from the trade war and the report of U.S-China talks has improved risk sentiment and has sent the U.S currency lower. The Japanese yen, although a safe-haven asset, has jumped on the bandwagon and posted gains in Friday trade.
The imposition of U.S steel and aluminum tariffs on Japanese exporters has soured economic relations between the two economic superpowers, and Japan has warned that it could retaliate, although Japan has refrained from slapping tariffs on U.S products. The sides met last week in Washington, but there has been no breakthrough in the impasse. Japan is still smarting from the U.S decision to withdraw from the Trans-Pacific Partnership and is intensifying efforts to reduce its economic dependence on the United States, and signed a free trade agreement with the European Union in July. Still, the U.S is Japan’s second-biggest trading partner and accounts for 19% of Japanese exports, so Japan will need to find a way to smooth relations with the unpredictable Donald Trump.
Australia & New Zealand Weekly: Inflation Expectations Might be Anchored Despite the Official 2.5% Policy Target
Week beginning 20 August 2018
- Inflation expectations might be anchored despite the official 2.5% target.
- RBA: Minutes, Governor Lowe and Deputy Governor Debelle speak.
- Australia: Westpac-MI Leading Index, construction work.
- NZ: real retail sales.
- US: Fed Chair Powell speaks at the Jackson Hole Symposium, durable goods orders.
- Flash Markit PMI's for Japan, the Euro Area and the US.
- US-China trade discussion and scheduled implementation of 2nd round tariffs.
- Key economic & financial forecasts.
Information contained in this report current as at 17 August 2018.
Inflation Expectations Might be Anchored Despite the Official 2.5% Policy Target
Last week the Reserve Bank surprised by lowering its inflation forecasts for 2018 (both underlying and headline).
Headline was lowered from 2.25% to 1.75% and underlying was lowered from 2% to 1.75%.
If correct, that means underlying inflation will have printed below the bottom of the 2-3% target range for three calendar years in a row. Headline inflation will have printed below the bottom of the 2-3% target for five calendar years in a row.
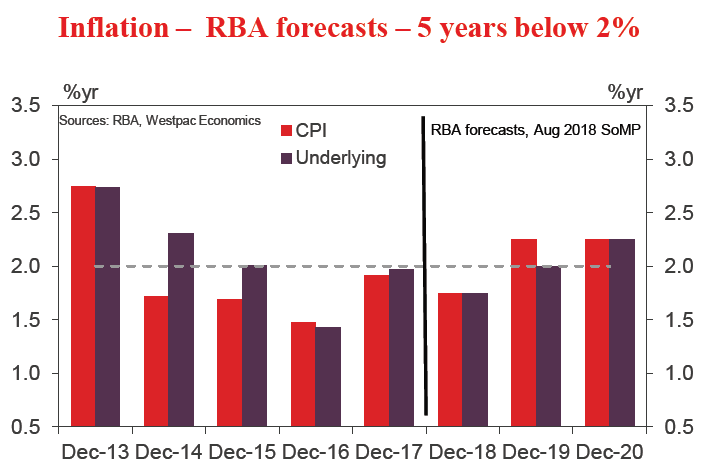
Economists and policy makers generally focus on underlying inflation when assessing the meaning of the "signal" from any inflation print. That is appropriate because the underlying measure "trims out" any large "one off" movements that might be misinterpreted.
However, when assessing inflation over the long term the headline measure is important since it should be a more reliable driver of inflationary expectations.
After all, expectations could be reasonably expected to be influenced by what has actually happened rather than a statistical interpretation of the data.
Inflationary expectations are critical from a theoretical perspective to delivering an inflation outcome. They impact workers' wage demands and firms' pricing decisions.
"Inflationary expectations" are like "the natural rate of unemployment" or "the neutral policy interest rate". They are highly attractive concepts for economists. However they are notoriously difficult to measure.
Consider the "natural rate of unemployment". For Australia that measure is generally accepted to be 5%. As such it is expected that any unemployment rate below 5% will be associated with rising wage pressures. However evidence from other countries indicates that in this period of accelerating technological development, which is often "job substituting", natural rates are lower. We expect that it is highly likely that the natural unemployment rate will also be lower in Australia. But we will not know for sure until we get there. Certainly the Federal Reserve had a view that the rate was around 4.75%. But as the rate fell through 4.75%, wage pressures were missing.
We are not sure what the position of the Reserve Bank is on this issue given that the unemployment forecasts envisage the unemployment rate holding above 5% until near the end of 2020 and yet wage pressures are expected to build through the forecast period.
Policy makers forecasts and market watchers try to measure inflationary expectations. The Reserve Bank uses a range of measures - market economists' forecasts; unions's forecasts; inflation swaps; and the 10 year inflation indexed bond. These measures have been gradually falling and are described by the Bank as "generally consistent with the inflation target".
However, the inflation target has been fixed for twenty years yet the expectations which used to be well above the target are now around the target. One exception is the measure which is widely used by other central banks, including the FED, the 10 year inflation indexed bond. Implied inflation expectations have steadily fallen from 3% to 2% over the last 10 years - well below the 2.5% target.
This comfort that inflationary expectations appear to be settling around the inflation target is the key reason why the Bank resists the periodic calls to lower the target.
The Bank believes that the existence of the target is a dominant driver of inflationary expectations. Consequently, if the target were to be lowered, then expectations would fall and a more disinflationary environment would evolve. This puts considerable weight on the target as a driver of expectations.
But, as discussed, the Bank has been unable to even reach the bottom of the target zone for five calendar years. Furthermore, they have made it quite clear that the next move in rates is up. Reasonably, economic agents could conclude that, even after five years, there is no urgency to reach the target.
We are unable to find a definitive measure of inflationary expectations. However after five years of underperformance of headline inflation below 2%, economic agents would be excused if they expected such conditions to persist.
With the Bank not prepared to use its interest rate "weapon", and other policies around credit supply actually constraining activity, there must be a risk that, at least from an expectations perspective, low inflation is embedded in the system for longer than the Bank and the market is currently expecting.
In fact, Governor Lowe has often responded to demands to lower the target by claiming that others favour a higher target in order to boost inflationary expectations.
A reasonable query on the purity of the target could be made around the need to monitor financial stability when setting policy. That approach was confirmed by the Governor's comments in a panel discussion at the Sintra Conference in June.
"To try to get it back to 2.5% very quickly, it would be mainly through people borrowing more money, and having higher asset prices — I think that's a much bigger risk to our economy than people having surprisingly low inflation expectations."
Reasonably, we can conclude that after five years of missing the bottom of the target zone, a more aggressive pursuit of the inflation target has been constrained by the need to address Australia's challenges around financial stability.
The Bank is currently forecasting that despite three years of above trend growth (3.25% in 2018; 3.25% in 2019; and 3% in 2020 against a trend growth rate of 2.75%) inflation (headline and underlying) will only have lifted to 2.25% by 2020.
Perhaps that looks cautious but with inflationary expectations potentially anchored at or below 2%, it might be a tough target to achieve unless the Bank was willing to signal that it was prepared to pursue its target more aggressively.
The week that was
For Australia, the past seven days have been focused on the labour market, with updates for wage growth and employment received.
On employment, the 4k decline in jobs in the month of July was well below the market's expectation, but in line with our own. Given it follows an outsized 58k gain in June, the weak July outcome is certainly not a cause for concern. Indeed the past three months have seen an average monthly gain of 22k, ahead of the 18k trend pace of growth. Looking ahead, we anticipate that momentum in employment will slow in the second half of 2018.
Based on employment growth, wages growth should be much stronger than the 2.1% reported for the year to June 2018. Here we see the impact of the underutilisation of workers which, in our view, is set to remain a significant concern hence. Broadly we believe this under-reported slack will hold nominal wage inflation around 2.0% through the remainder of 2018 and 2019 and, as a consequence, real wage growth will be negligible. This situation will continue to weigh on households' perceptions of their family finances and willingness to spend.
Another important consequence of inflation persistently at the lower-bound of the RBA's target range and weak (or no) real wage growth is that household's inflation expectations are suppressed.
Outturns as above would be a stark contrast to the positive expectations of the Government and the RBA - the latter re-iterated during Governor Lowe's appearance before the House of Representative's Standing Committee on Economics this week. This is why we believe aggregate growth in 2019 will be sub-trend, and that the RBA will remain on hold into 2020.
Turning to the US, the New York Federal Reserve's consumer credit survey was the highlight, but out of the headlines. Conflict between the US and Turkey instead remained front of mind for the press. This is a highly uncertain situation, and is unlikely to be resolved soon. We are not overly concerned by the effect this situation will have on global trade or growth, but we are mindful of potential spill-over effects to the European banking sector (who have considerable exposure to Turkish corporates) and to sentiment towards other emerging markets. Developing nations geographically near Australia are in a far better situation than Turkey and where they were in the late- 1990's (based on current account and external debt metrics). Hence a real economy and/or emerging market financial market contagion in our region is highly unlikely. Still, amid uncertainty, market participants are likely to sit on the sidelines until the data confirms there is no need for concern.
As we continue to outline, the greater risk to the region is likely that emanating from China's domestic banking system as it undergoes lasting change to rein-in shadow banking activity and shift the majority of credit supply to the banks. Chinese credit data is now available to July. In the most recent release, a further fall in shadow banking credit was seen such that credit provided by these shadow lenders has now only increased by about RMB700bn in 2018 compared to almost RMB3.5trn at this time in 2017. Greater lending by the banking system has only offset around RMB900bn of the reduction in new shadow credit in 2018, so total credit growth in 2018 is almost RMB2trn less than the prior year. This outcome is intended and well managed, but whenever a policy shift of this magnitude is undertaken, there are risks which must be monitored. It is not happenstance that Chinese regulators have recently acted to ease financial conditions and bolster market liquidity.
In these uncertain times, a clear positive for China's economy is their housing market. In stark contrast to the 5.5% gain for total fixed asset investment, real estate investment is running at a 10% year-to-date pace. Further, the recent acceleration in starts implies that the majority of this momentum will be sustained into year end, particularly as continued robust price growth in tier 2 and 3 make for an attractive sales environment. If gains for this sector are to endure, then both central and local authorities will need to push ahead with their intended long-term reforms to drive growth in industry and incomes across the nation. As we look ahead to next week, US/China trade relations will again fill the headlines, given a Chinese trade delegation is reportedly heading to the US for talks just before the US' next round of tariffs are to take effect.
Chart of the week: Australia wage inflation
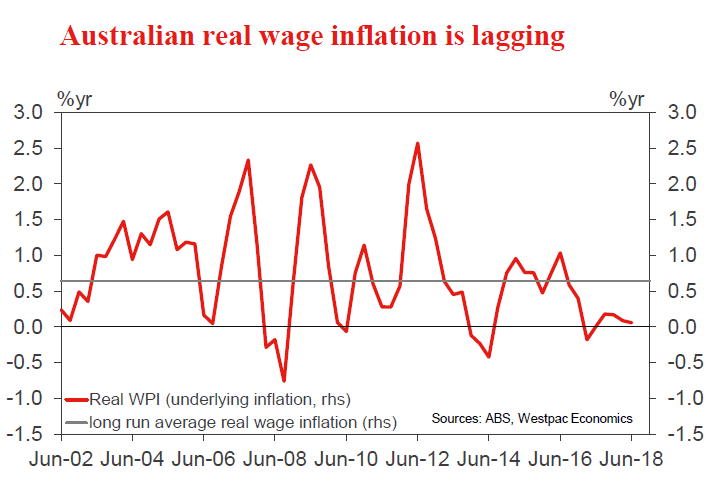
Total hourly wages ex bonuses increased 0.6%, 2.1%yr in Q2. Wage growth remains weak and remarkably so across industries, sectors and states. At a national level, the only real sign of any lift in wages was in the public sector, particularly in Victoria, with a focus mostly in health services. But even here the heat appears to be limited and the pace of growth has peaked.
Is low inflation behind low wages? Not really, real wages growth is just 0.1%yr as at Q2. Real wages are best described as being flat for more than a year now.
Will the recent repeat of an outsized increase in the minimum wage for 2017/2018 boost wages in the September quarter? Given that the increase is on par with the increase in 2016/17, it should hold rather than increase momentum. However, as we saw little pass through from the last increase, will the pressure be greater on firms to pass on more this time? We shall have to wait to find out.
New Zealand: week ahead & data wrap
Low for longer
After digesting last week's Monetary Policy Statement from the Reserve Bank, we have concluded that the OCR will now remain on hold for longer than we had previously assumed. That's not to say we've been surprised by unexpected weakness in the economy. On the contrary, the economic slowdown currently in train is something we have consistently warned about over the past year. Rather, it's the view of the RBNZ, under new Governor Adrian Orr, that has evolved. This shift in the outlook for interest rates will filter through to other aspects of our economic forecasts. Most notably the housing market and the exchange rate.
This week we changed our view on when we think the RBNZ is most likely to raise rates. Previously we had the first rate hike pencilled in for November 2019. We now think the OCR will remain on hold until May 2020, rising slowly thereafter.
What's more, there's a decent chance that the RBNZ will cut rates in the next twelve months (we put the odds at one in three).
Importantly, this change in view has little to do with the state of the economy. We have long warned of a slowdown in growth in 2018 and predicted that the RBNZ would become more dovish as it's more upbeat view converged with our own more pessimistic outlook. Indeed that is broadly what's happened (though, as is often the case, the RBNZ lurched even further than we expected last week).
Instead, the main reason for our change in call is the RBNZ's shift with the new Governor at the helm. Recent RBNZ communications have consistently surprised on the dovish side of the spectrum, with the biggest shift in last week's Monetary Policy Statement. A move that was bigger than can be explained by data surprises alone. We strongly suspect that the new regime will be keener to shore up GDP growth when it flags, and more willing to take a risk when inflation is rising. Essentially the Reserve Bank has become more dovish.
Given this backdrop, the key question is whether or not the Reserve Bank will go so far as to cut the OCR, having already warned it is "near the trigger point". While we think such a move is possible, it would require the data to disappoint relative to the RBNZ's expectations. And our view is that this is unlikely. In particular, June quarter GDP will probably print closer to 1% than the 0.5% the RBNZ is forecasting, and we think September quarter inflation will be 1.7% in contrast to the RBNZ's 1.4% pick. What's more, the surprisingly dovish Statement from the RBNZ has seen the NZ dollar plunge and it now sits well below the RBNZ's forecast.
These data surprises are likely to coincide with signs of more broad-based improvements in the economy. The Government's Families Package has boosted the incomes of some households and is expected to support spending in the coming months, Government consumption is ramping up and the falling exchange rate will boost the incomes of exporters. Consequently, GDP growth in 2019 is likely to temporarily accelerate to 3.1%.
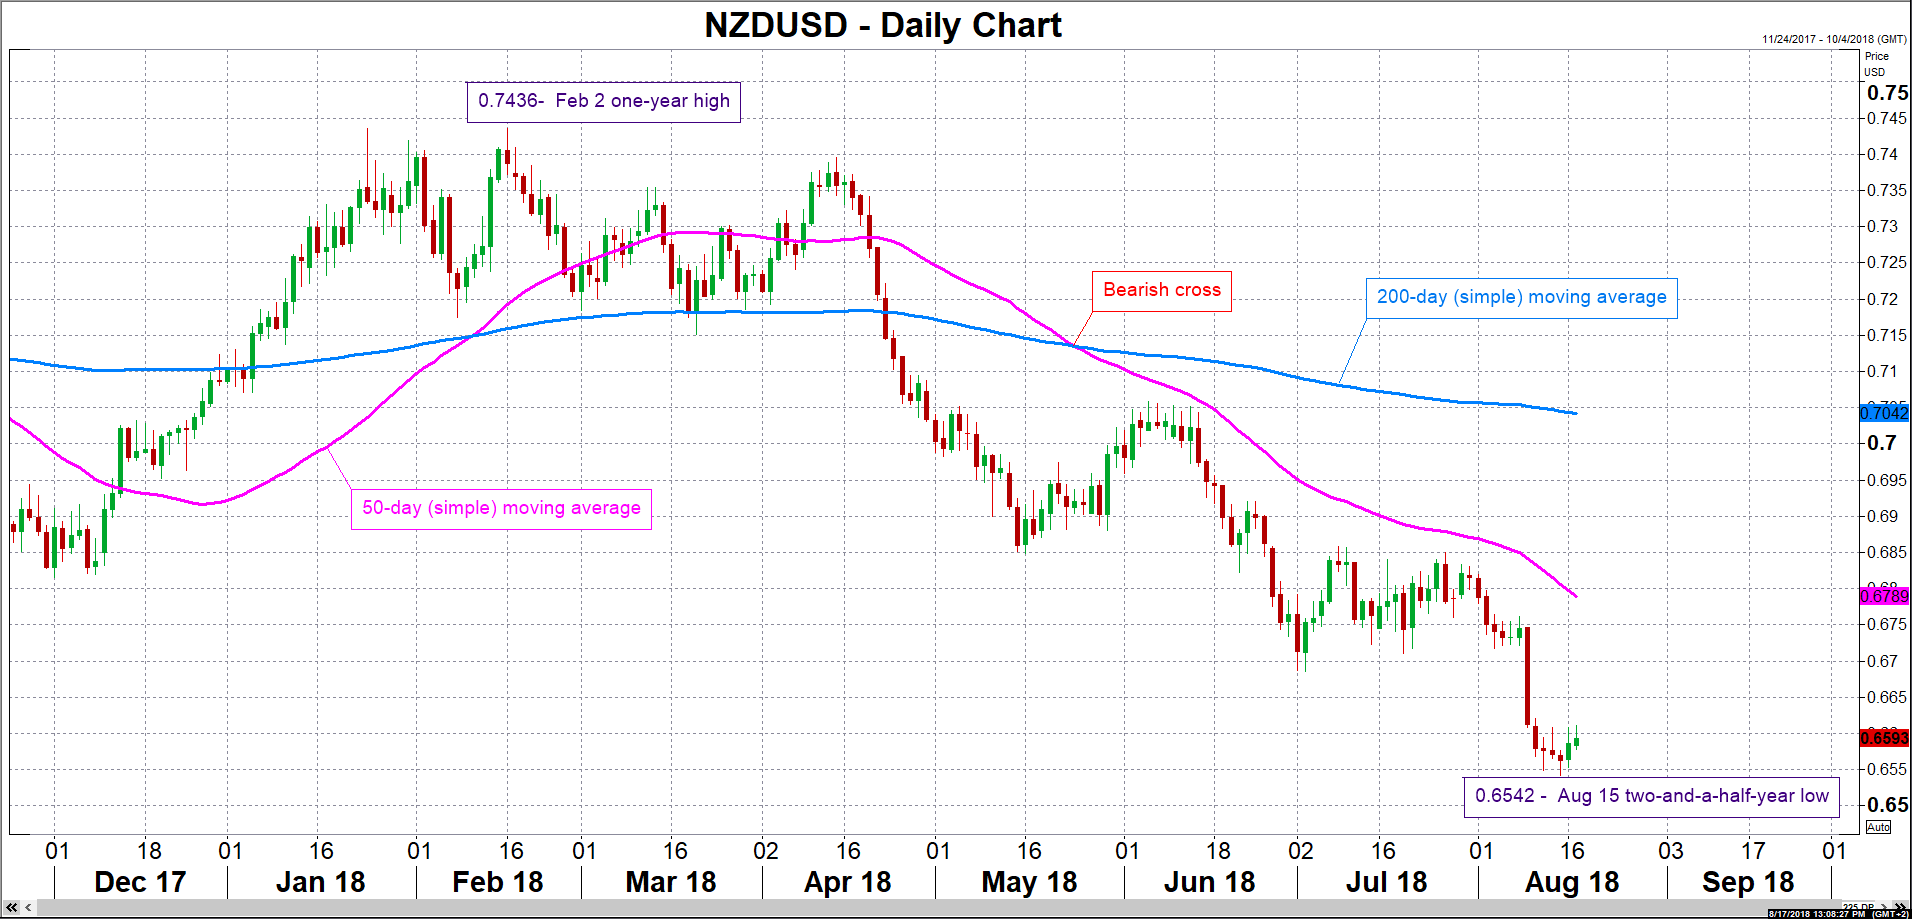
The expectation of lower interest rates will filter through other aspects of our economic forecasts. The New Zealand dollar has fallen sharply to just under 66 cents against the US dollar and momentum is still downward at present. However, later this quarter we expect a rash of positive data to arrest this decline or even cause a temporary pop higher. Over a longer horizon, we retain our view that the NZD/USD will depreciate further. We expect the NZD/USD to fall to 64 cents by September this year, lingering at these levels for a time before gradually moving higher as interest rate differentials once again start moving in favour of a firmer NZD/USD.
Lower interest rates will also impact the housing market, where they will provide something of a counterbalance to the swathe of Government policies aimed at cooling investor activity.
This week's REINZ data suggested the trend in the housing market remains fairly subdued. It showed July was a solid month for house prices (which were up 0.5% in the month) but a very weak month for sales, which fell almost 6%. The housing market in Auckland remains much weaker than other regions.
But the market reaction to last week's Monetary Policy Statement has seen wholesale interest rates drop significantly. We estimate this will lead to a 0.2% drop in two year fixed mortgage rates over the next couple of months. And with mortgage rates a crucial determinant of housing market developments, lower mortgage rates should give the housing market temporary a leg up in early 2019. We also expect the Reserve Bank to ease loan-to-value restrictions in the November Financial Stability Review, with the change to come into effect in January.
While these will be important positive developments, we retain our negative outlook on house prices over the longer term. The foreign buyer ban was passed by Parliament this week and will shortly come into effect. Although this is a watered down version of the original bill (with foreigners still allowed to buy new apartments in large developments and multi-storey blocks), we still expect it to have a significant impact on the housing market - particularly in Auckland and Queenstown where most foreign purchases take place. And the Tax Working Group is due to issue an interim report next month, which should give some indication of where capital gains or other property taxes sit on the Government's agenda. In addition, interest rates won't remain this low forever. Eventually rising mortgage rates will hit the housing market. We're forecasting a house price decline of almost 3% for 2020.
Data Previews
Aus Jul Westpac-MI Leading Index
- Aug 22, Last: -0.33%
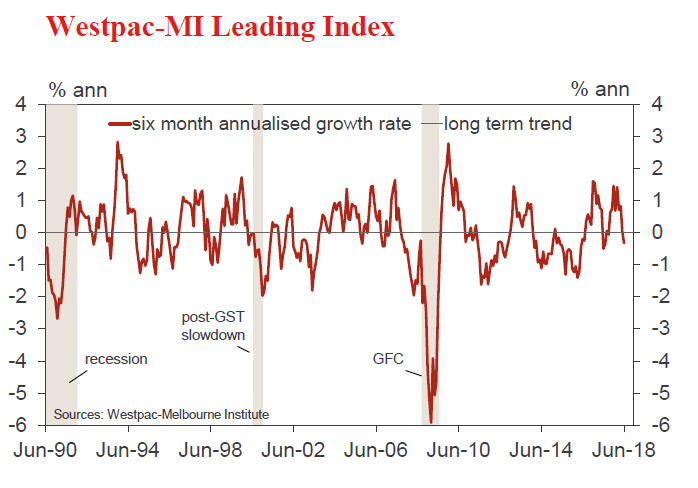
The Leading Index has been pointing to a clear slowing in momentum since the start of the year. The six month annualised growth rate came in at -0.33% in June, the first negative since September last year, pointing to a below trend growth pace well below the comfortably above trend reads seen late last year.
The July reading looks likely to be a little more positive. It will include several components with more positive updates, in particular, dwelling approvals which rose 6.4% vs -2.5% last month; and total hours worked which will incorporate two positive monthly updates since the last leading index release (+0.7% in June and +0.2% in July vs -1.3% in May). Other components have been more mixed: the ASX200, up 1.4% vs 3% last month; but consumer sentiment components softer and the remaining components - US industrial production, AUD commodity prices, and the yield spread unchanged.
Aus Q2 construction work
- Aug 22, Last: 0.2%, WBC f/c: 0.8%
- Mkt f/c: 0.8%, Range: -0.3% to 2.9%
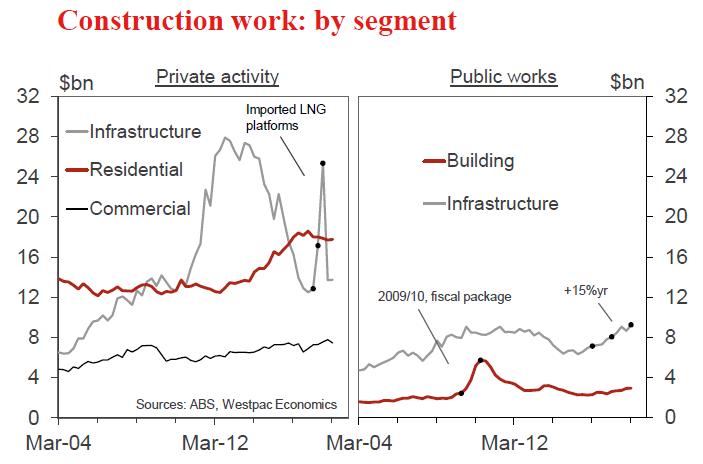
Construction work consolidated in the March quarter, edging 0.2% higher to be 5% above the level of a year ago. Strength in public works in the quarter outweighed a surprise dip in private non-residential building activity.
For the June quarter, we anticipate a modest gain of 0.8%.
The strong upswing in public construction likely extended into the June quarter, with considerable further upside. We expect non-residential building work to rebound, consistent with approvals and the sizeable work pipeline.
Home building activity is expected to be relatively flat, as work in the sector crests at a high level ahead of a downturn in 2019. An uncertainty is private infrastructure work, we've factored in a modest fall as work on the gas projects is completed offsetting a lift in non-mining projects, centred on power generation (particularly renewables).
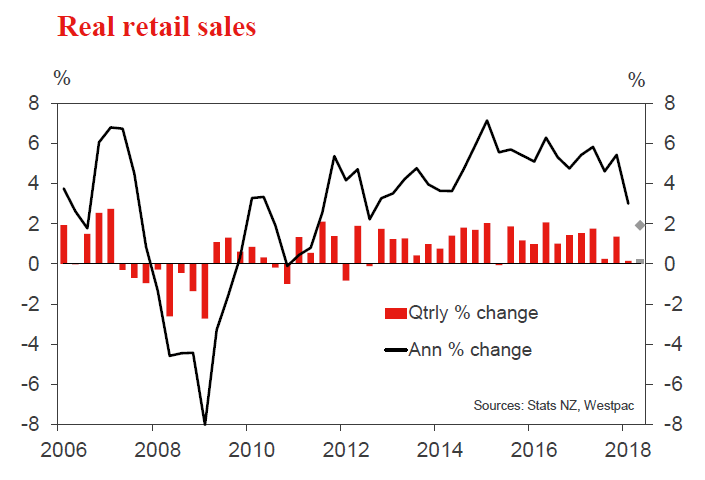
NZ Q2 real retail sales
- Aug 22, Last: +0.1%, Westpac f/c: +0.2%
After adjusting for price changes, retail spending was essentially flat over the March quarter. Much of the weakness in spending was concentrated on fuel and vehicle spending (dampened respectively by rising petrol prices and delays with vehicle importation). Spending in core categories rose by 0.6% over the quarter.
We expect that overall retail spending will rise by 0.2% in the June quarter, including a 0.3% rise in the core categories. This modest pace of growth is consistent with the cooling in the housing market that is weighing on spending appetites.
The key risk around our forecasts are recent delays with vehicle imports. It is not clear how much of this was captured in the March quarter, and we could see a larger than expected bounce back in this category.
Week Ahead – Eurozone PMIs and Japanese Inflation Due; Jackson Hole Summit, Trade Updates & Turkey Could Steal the...
Upcoming releases in the next seven days are pointing to a relatively quiet August week. Among the few stand-out readings are flash PMI prints out of the eurozone, Japanese inflation figures and US capital goods orders. In addition, the minutes relating to the Federal Reserve and Reserve Bank of Australia’s latest meetings will be made public next week. Despite a mostly light calendar, comments out of central bankers gathering for the Jackson Hole Symposium, as well as global trade & Turkey-related news have the capacity to provide plenty of excitement, acting as major market movers.
US capital goods orders, FOMC minutes and Canadian retail sales on the horizon; Jackson Hole summit a risk event
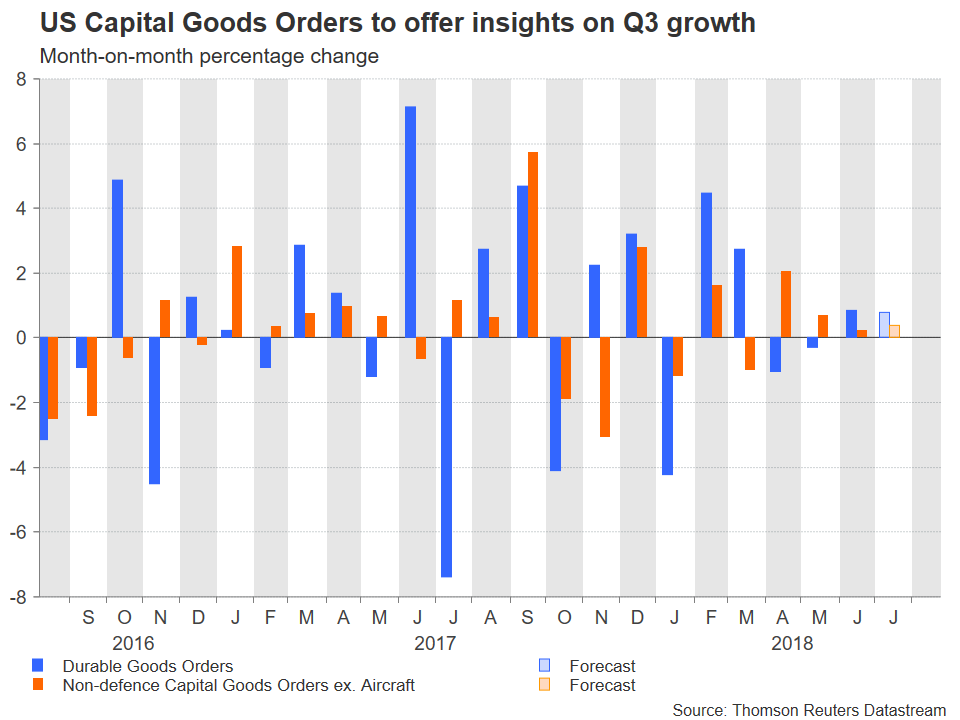
In terms of US releases, the most noteworthy are durable goods orders for July out on Friday – these are expected to give an indication on business spending in Q3 –, as well as the Fed minutes from its July 31 – August 1 meeting out on Wednesday. In terms of the former, durable goods are anticipated to have grown by 0.8% on a monthly basis in July, the same pace as in June. Regarding orders for non-defense capital goods excluding aircraft, a closely watched proxy for business spending plans, it is forecast to rise by 0.4%, double June’s rate. GDP models are giving divergent views on the US economy’s performance in Q3. The Atlanta Fed’s GDPNow model continues to predict continued strong growth from Q2, specifically putting the rate of expansion at 4.3% on an annualized basis, while the New York Fed’s tracker suggests a 2.6% rate. Friday’s prints will better inform markets on the state of the US economy during the third quarter.
Tuning to the Fed minutes, FOMC policymakers delivered a “hawkish hold” of rates a few weeks ago; they kept interest rates steady but effectively communicated that they remain on track to continue hiking rates moving forward. Further insights on their thinking provided by next week’s minutes, especially on the odds for two additional quarter percentage point increases in 2018, have the potential to move the dollar.
Other US data out next week include July’s existing and new home sales on Wednesday and Thursday respectively, as well as Markit’s flash manufacturing PMI for August on Thursday.
A risk event taking place in the US from August 23-25 will be the Jackson Hole Economic Policy Symposium. The summit’s overall theme is “Changing Market Structure and Implications for Monetary Policy” and will feature influential central bankers and finance ministers from some of the world’s largest economies; market-sensitive remarks are not to be ruled out.
Remaining in North America, of most significance out of Canada will be Wednesday’s retail sales numbers for June. At the moment, market participants are almost completely pricing in an additional 25bps rate increase by the Bank of Canada by year-end. Robust retail sales readings may lend steam to the narrative that the Canadian central bank is the only one that can somewhat keep up with the Fed in terms of rate normalization, subsequently boosting the local dollar.
Flash eurozone PMIs to dominate attention in Europe; Brexit a sterling mover?
Eurozone flash PMI readings for August will most likely be the focus next week in terms of European releases. The manufacturing and services PMIs, as well as the composite measure that blends the two sectors, are all due on Thursday and are expected to provide further insights as regards economic activity in the euro area during Q3. Overall, all three are forecast to reflect a minor improvement relative to July, as well as comfortably remain in expansion territory above 50.
In the meantime, Germany and France, the eurozone’s two biggest economies, will also see the release of their corresponding August PMI prints on Thursday, prior to the euro-wide figures; traders may use these to speculate on what is to follow out of the euro area, positioning themselves accordingly. Also out of Germany will be July’s producer price data due on Monday.
Beyond the abovementioned, preliminary eurozone consumer confidence figures for August on Thursday, as well as updated Q2 GDP numbers for Germany on Friday, may be of interest too.
Turning to the UK, sterling will most probably prove sensitive to any Brexit developments following this week’s discussions; any indication that the EU and the UK are getting closer to a deal will likely lift the British currency and vice versa.
Retail sales on New Zealand’s agenda; RBA minutes due; trade updates to move antipodeans
In the antipodean sphere, New Zealand will be on the receiving end of Q2 retail sales figures during Wednesday’s Asian session. Retail sales volumes grew by 3% y/y in Q1, considerably below the respective number of 5.4% during Q4 2017 and at their slowest pace since Q3 2012. A weak reading next week is anticipated to support the RBNZ’s decision earlier in August to push forward its rate hike projections to late 2020 from late 2019 previously, and will thus likely exert downside pressure on the kiwi.
Other notable releases out of New Zealand are those pertaining to second-quarter construction activity on Wednesday, Friday’s trade data for July, as well as figures relating to Tuesday’s bi-weekly milk auction – dairy products are the nation’s largest goods export earner, with higher prices generally seen as kiwi-positive.
Out of Australia, the official record of the RBA’s latest meeting will be hitting the markets on Tuesday. An upbeat RBA compared to the expectations shaped following its August 7 meeting will likely promote a stronger aussie, with the opposite holding true as well.
However, of most importance for the kiwi – NZDUSD daily chart depicted below – and the aussie alike may prove to be Sino-US trade developments. Should the confrontational stance by the world’s two largest economies give way to a more constructive trade relationship on the back of news of the two getting into talks on August 21-22, then the aussie and the kiwi are likely to gain. Australia and New Zealand are major commodity exporters and their corresponding currencies tend to lose on a deteriorating outlook for global growth and trade.
Japanese inflation on tap
Japanese inflation figures as gauged by the consumer price index (CPI) for July are scheduled for release during Friday’s Asian session. With inflation nowhere near the Bank of Japan’s target of 2% on an annual basis, only a large deviation from analysts’ forecasts may excite market participants, spurring expectations for a change in the Japanese central bank’s ultra-accommodative policies and thus movements in the yen. Projections call for core CPI, that excludes fresh food items but includes energy products and which is closely watched by the BoJ in its policy making, to expand by 0.9% y/y after growing by 0.8% in June. Also out of Japan will be the Nikkei’s flash manufacturing PMI for August, due one day before the prints on inflationary pressures.
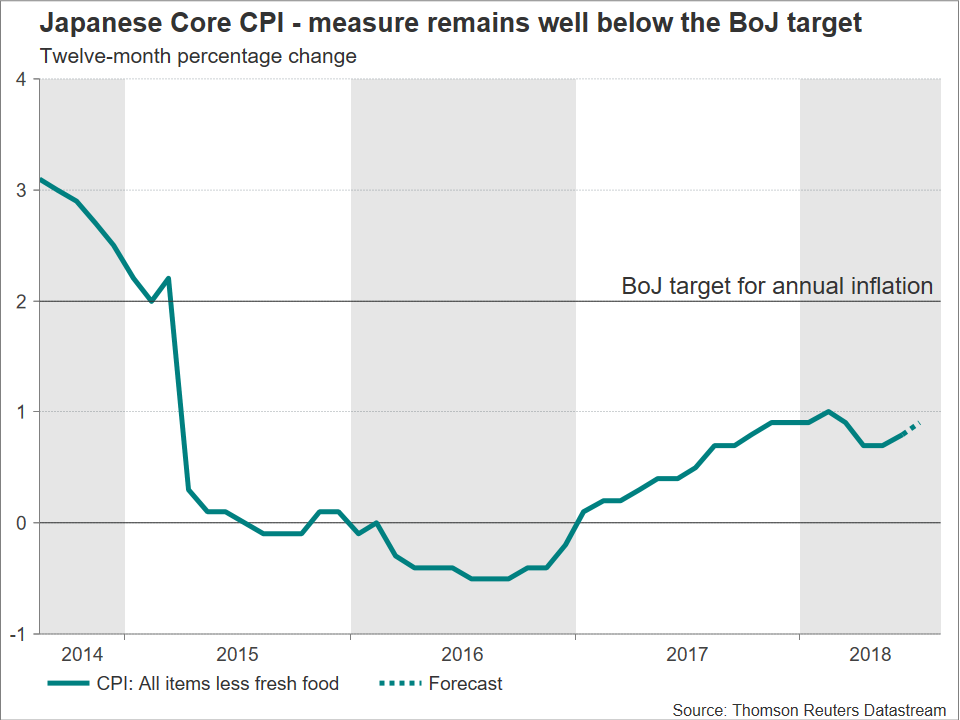
The Japanese currency’s direction next week though may predominantly depend on demand for safe havens. Intensifying Sino-US trade tensions, or rising regional uncertainty emanating from Turkey which – at least for now – resists giving in to US demands, are yen-supportive. On the other side of the spectrum, they are negative for riskier assets and risk-on currencies such as the aussie. The opposite effect is expected in the event of easing worries on these two fronts.
Weekly Focus: Political Uncertainty Here to Stay
Market movers ahead
- In Norway, Q2 GDP growth data is due out on Thursday. The print will reveal whether or not a slowdown has been under way in Norway.
- Next week, we get preliminary PMIs in Europe, the US and Japan.
- We do not expect any major new information from either the FOMC or ECB meeting minutes.
- Donald Trump's 25% tariff rate on an additional USD16bn worth of imported goods from China comes into effect on Thursday.
Global macro and market themes
- Theme 1: Brexit end-game in Q4.
- Theme 2: US-China trade war continues.
- Theme 3: US sanctions against Iran, Russia and Turkey.
- Theme 4: US midterm elections in November.
- Theme 5: Italy budget clashes with the EU.
- Theme 6: China is easing policy to offset slowdown and trade war uncertainties.
Loonie Rallies Hard on Inflation Data
Canadian headline inflation this morning beat market expectations and printed a seven-year high last month, while the measure of core-inflation remained relatively stable.
Canada’s CPI rose +3.0% y/y, following a +2.5% rise in June. Market expectations were looking for a headline print of +2.5%. On a month-over-month basis, prices rose +0.5% in July, after advancing a revised +0.2% in June.
Today’s July report indicates that underlying, or core, inflation edged up slightly from the previous month, with prices rising in a range from +1.9% to +2.1%, based on the three preferred gauges used by the BoC for an average of +2.0%.
The loonie has rallied aggressively across the board after the number (+0.7% to C$1.3072).
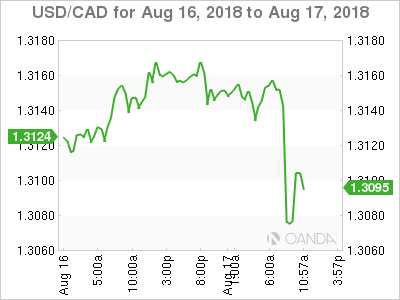
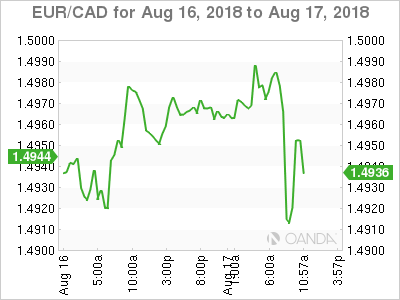
CAD ‘bulls’ will be looking to the crosses for further wins, especially GBP (£1.6646) and EUR (€1.4921) and will avoid the pain of the long dollar positions in this ‘risk off’ emerging market debacle.
From a technical perspective, the EUR now trading through the €1.1500 outright now looks more vulnerable, especially if the market begins to focus any further negative attention on Italy in respect to its exposure to Turkey and by the country’s 2019 budget process.
GBP/CAD has fallen from around £1.7037 since the Bank of England increased the interest rate to +0.75% on Aug. 2, mostly due to the fact that the market has switched their attention to Brexit uncertainties and the possibility of a no-deal scenario.
Canadian fundamentals support the loonie on any sell-off
After last Friday’s employment numbers where Canada added a net +54.1K jobs in July and this morning’s inflation reports adds to the probability the BoC will hike the benchmark interest rate one more time in 2018. Don’t expect the BoC to stray too far away from the Fed’s rate normalization plan.
So, look to the loonie to fly against contagion angst EUR or a no-Brexit deal pound. Even positive Nafta rhetoric will support the currency’s crusade!