Sample Category Title
Technical Analysis: Bitcoin, Ripple And Ethereum
Ethererum bouncing from its lows
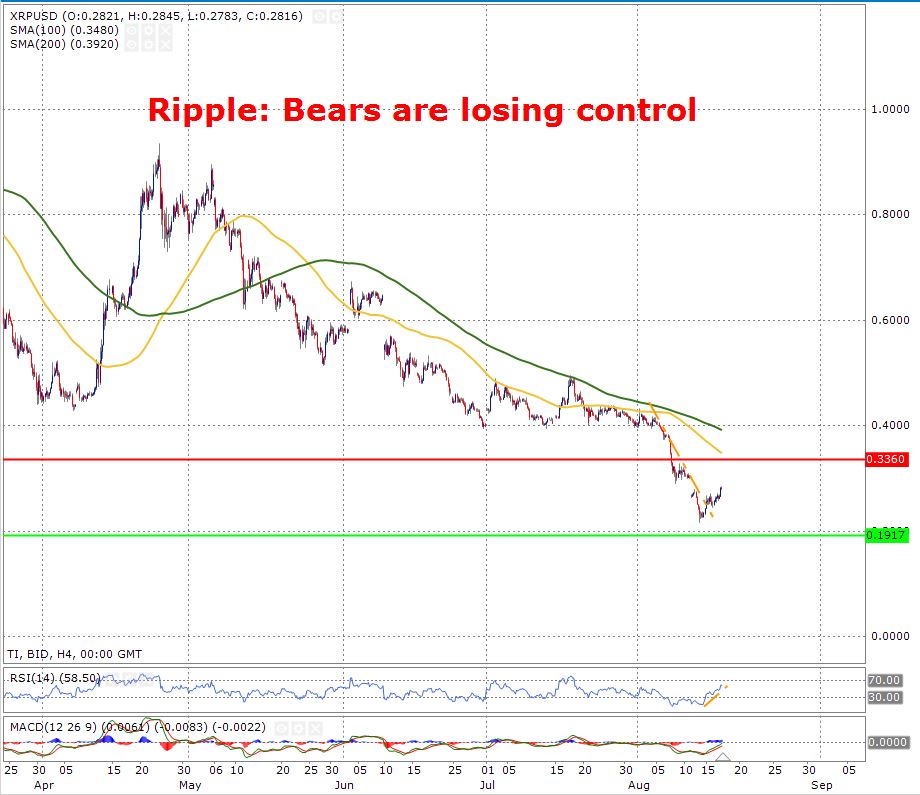
Bitcoin: 100-day SMA may be falling below the 200-day SMA
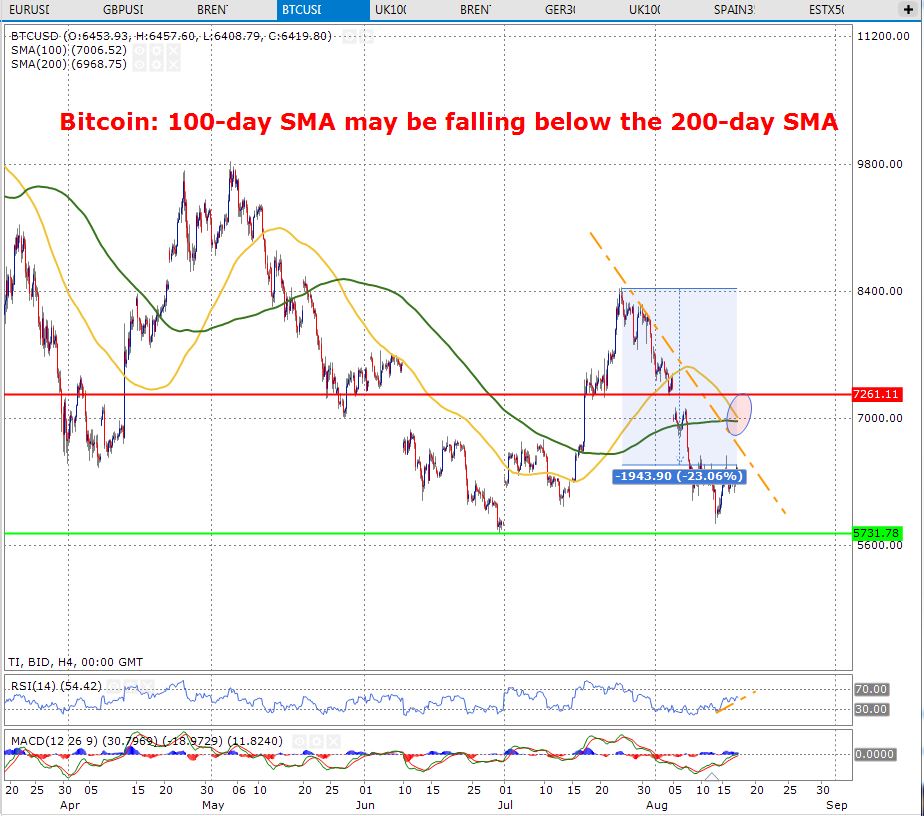
Ripple: Bears are losing control
Ethererum bouncing from its lows
The intra-day chart below for Ethereum displays that the price is bouncing from its lows. When looking at the chart it is evident that there was a gap in the market clearly (indicated below in an oval shape). This informs that at this point there was no buyer and seller and hence we have a gap in the price. Moreover, in this case this would mean that is rather likely that the price of Ethereum may see a retracement if and when it enters this zone. But for now, it is apparent that the price for Ethereum has in fact bounced back up from its low.
If the price is unable to break beyond (the orange colored) downward trend line and (in red color) resistance line which is priced at $371.90, then it is vastly likely that the price may approach (the green colored) support zone which is priced at $203.15. The last time the price had hit this low dates back to October 2017.
When looking into the Relative Strength Index it seems that, yes, the price had dropped below the 30 mark which informs that it was oversold. However, the price had picked up and driven towards the 70 mark. This shows a bullish sentiment as it is also shown that the price is moving above the upward trend line shown in orange in the Relative Strength Index chart.
Bitcoin: 100-day SMA may be falling below the 200-day SMA
The chart below for the pair BTC/USD on an intra-day time frame (4hours) demonstrates that the yellow colored 100-day SMA may be falling below the green colored 200-day SMA. It is evident that these MAs may cross as they are close to each other. As shown in the chart it is apparent that dating back to the 25th of July the high for the pair was at $8400 and since then the price has now retraced 23% to the downside. Moreover, the downtrend is also confirmed because the price is trading below the downward trend line shown in orange. Furthermore, it shows that the price is currently trading below the downward trend line evidently shown in the chart.
When looking at the 100-day moving average shown in yellow and the 200-day moving average in green, it shows that they two move averages displayed on the chart are touching each other. This informs that if the 100-day moving average moves below the 200-day then this may lead to a bearish signal. This is proven as the last time there was a bullish movement for the pair was when the 100-day had gone over the 200-day. Therefore, in this case we have the opposite which may lead to a bearish movement.
When looking at the Relative Strength Index it is seen that the indicator shows the pair had been previously oversold. However, since this time it has worked its way move back towards the 70-mark strengthening the bullish movement. Therefore, investors must be mindful about this.
Ripple: Bears are losing control
The intraday chart (4 hours) below for Ripple shows that Bears are losing control as the price was trading in an orange colored downward trend line. However, as of the 15th August the price had begun to increase which shows that bears are losing control and the bull trade is possibly coming into play.
On the other hand, this is not to an extreme as the jump is not that vast as of yet. Moreover, it is also seen that the price is currently trading below the moving averages where the 100-day SMA in yellow is approaching the resistance line in red priced at $0.336.
The Bears losing control of the price can also be seen evident when referencing to the Relative Strength Index Indicator shown in the chart. It is seemingly apparent that according to the Relative Strength Index the price was previously in the over sold zone. Whereas, as of now the price is moving above upward trend line shown in orange which is approaching the 70 mark, entailing that the bulls are in control.
US Futures: Risk Off Sentiment Losing Some Steam | Bears Control The Oil Price
- China and the US need constructive dialogue
- Walmart stock helped the Dow Jones index to flex its muscles
- US refineries are trading at the highest rate since in nearly a decade
The risk-off sentiment has lost its charm to some extent. On the other hand, investors remain hopeful that both China and the US would be able to have some sort of constructive dialogue. Both countries need to resolve their dispute and meet somewhere which can be called a happy ground. Additionally, If Trump thinks that it can bend China’s arm by force then certainly his head is in the clouds and if China is of the kind frame that it is dealing with someone who has the same attitude as the previous administration, they will get another a reality check. Moreover, we have seen a lot of optimism on Wall Street last night about this and investors over in Europe are ready to build on this.
One particular reason that why the US futures are trading strong is because of the stellar results by Walmart. Corporate earnings still have enough fire to drive the indices higher. The quarterly earning result by Walmart pushed the company’s stock up nearly by 9.3% thanks to the biggest jump it experienced in its sales. This massive surge in Walmart stock helped the Dow Jones index to flex its muscles. Basically, what investors will be positive about today is that they do not have to rely on the tech stocks only to see the market rallying. Walmart is dominating that space.
The sell-off in tech stocks and in commodities have also eased off somewhat as Turkey’s tensions have taken a back seat for the time being. In addition, Investors believe that Erdogan who has history and a strong track record of successfully dealing with various kind of crisis would be able to resolve the current dispute.
However, if the situation deteriorates any further, it will these tech stocks which could pull the markets lower again. Moreover, if the Chinese and US trade tariff talks do not move towards a more positive end, there is a strong possibility of carnage in the markets. Both country leaders are likely to adopt a tit-for-tat strategy which would an adverse impact on the commodity stocks, a sector which is already suffering. So far investors have punished the markets in a way that they could and this is only because the large number of them think that the current trade spat between the US and China is only a Trump tactic to get things done his way. Furthermore, Trump would need to put these concerns behind him before his midterm which isn’t too far because of this uncertainty continues to linger, it will not yield any healthy dividend.
In the commodity space, there isn’t much of hope for oil especially when the data from the EIA shows that ample supply has built up again. The negative effects from the EIA report which printed its biggest weekly build in almost a decade has pushed the bulls to a corner. On top of that, the US refineries are trading at the highest rate since in nearly a decade. This only means more supply on the market. If you further look at the supply equation, it becomes clear that the OPEC production has also increased by 41,000 b/d during the month of July. Yes, countries like Iran, Libya have seen a drop in their production but it is countries like the UAE and Kuwait which have ramped up the production. On the demand side, what we have is a major disruption due to the heightened geopolitical situation. This doesn’t gel well if you make the argument that the economic outlook for the world is looking strong and this would push the oil price higher.
The Analytical Overview Of The Main Currency Pairs
The EUR/USD currency pair
Technical indicators of the currency pair:
Prev Open: 1.13464
Open: 1.13752
% chg. over the last day: +0.24
Day's range: 1.13712 – 1.13775
52 wk range: 1.0571 – 1.2557
The EUR/USD currency pair began to recover. At the moment, quotes are testing the key resistance of 1.14200. The local support is 1.13700. We recommend opening positions from these marks. A trading instrument is tending to grow.
The news feed on 17.08.2018:
Consumer price index in the Eurozone at 12:00 (GMT+3:00).
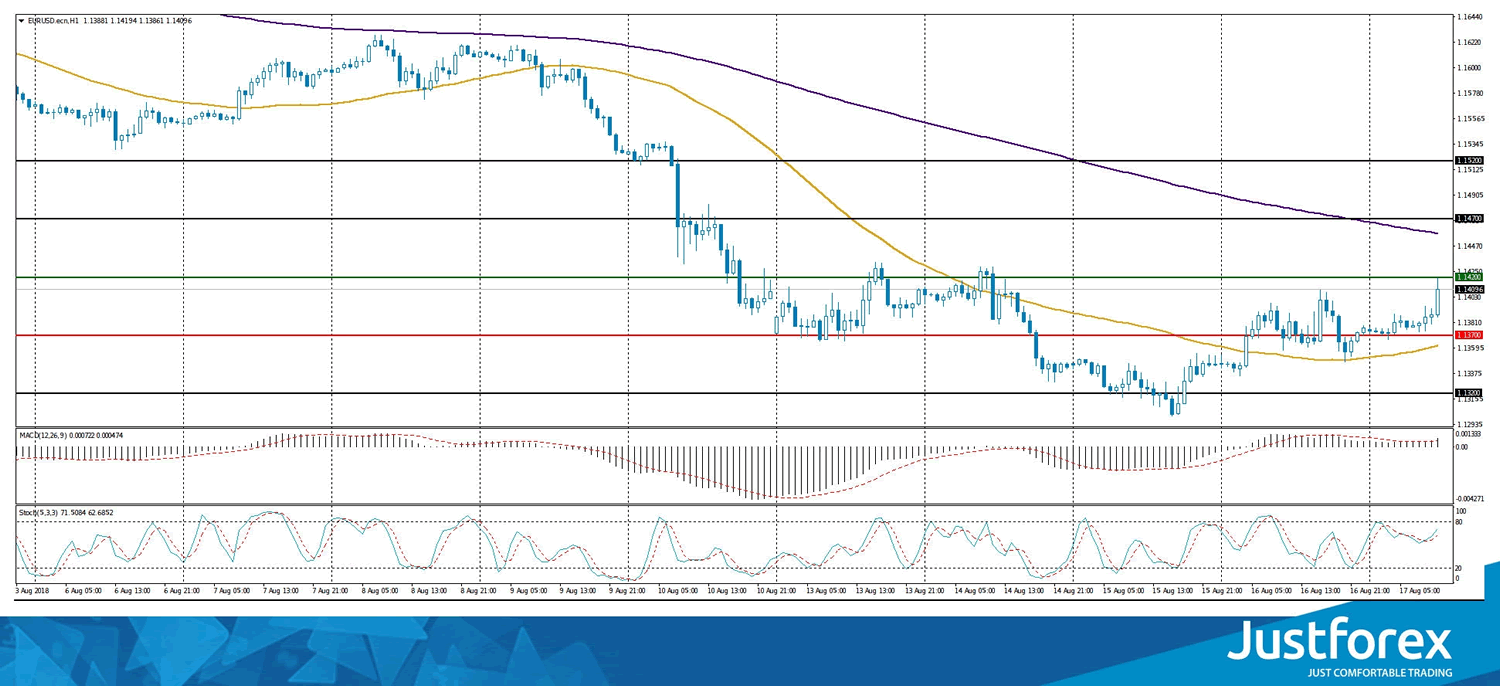
Indicators do not send accurate signals: the price has fixed between 50 MA and 200 MA.
The MACD histogram is located in the positive zone and above the signal line, which gives a strong signal to buy EUR/USD.
Stochastic Oscillator is in the neutral zone, the %K line is above the %D line, which indicates the bullish sentiment.
Trading recommendations
Support levels: 1.13700, 1.13200
Resistance levels: 1.14200, 1.14700, 1.15200
If the price fixes above the resistance level of 1.14200, further growth of the EUR/USD currency pair is expected. The movement is tending to 1.14700-1.15000.
Alternative option. If the price fixes below 1.13700, it is necessary to look for entry points to the market to open short positions. The movement is tending to 1.13200-1.13000.
The GBP/USD currency pair
Technical indicators of the currency pair:
Prev Open: 1.26958
Open: 1.27066
% chg. over the last day: +0.11
Day's range: 1.27060 – 1.27350
52 wk range: 1.2361 – 1.4345
The technical pattern on the GBP/USD currency pair is ambiguous. At the moment, the quotes are in a sideways trend. The key support and resistance levels are 1.27000 and 1.27500, respectively. In the near future, we expect correction of the GBP/USD currency pair. The pound is supported by positive data on retail sales in the UK. Positions should be opened from the key levels.
The news feed on the UK economy is calm.
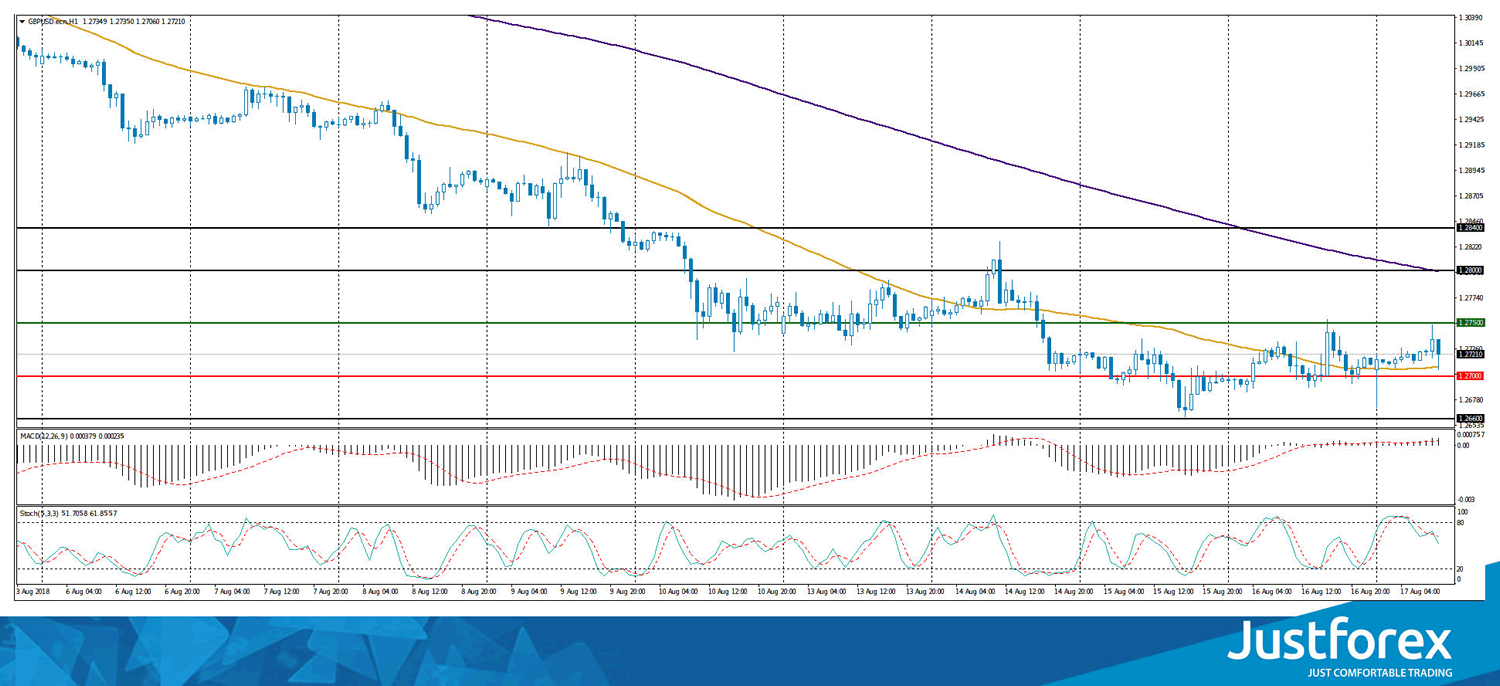
Indicators do not send accurate signals: the price has fixed between 50 MA and 200 MA.
The MACD histogram is in the positive zone, above the signal line, which gives a strong signal to buy GBP/USD.
Stochastic Oscillator is located in the neutral zone, the %K line is below the %D line, which indicates a decrease in the GBP/USD quotes.
Trading recommendations
Support levels: 1.27000, 1.26600
Resistance levels: 1.27500, 1.28000, 1.28400
If the price fixes above 1.27500, the GBP/USD currency pair is expected to grow. The target level for profit-taking is 1.28000-1.28400.
An alternative may be a decrease in the GBP/USD quotes to the level of 1.26600-1.26400.
The USD/CAD currency pair
Technical indicators of the currency pair:
Prev Open: 1.31391
Open: 1.31537
% chg. over the last day: +0.14
Day's range: 1.31480 – 1.31567
52 wk range: 1.2059 – 1.3795
The USD/CAD currency pair is testing monthly highs. At the moment, the technical pattern is ambiguous. Financial market participants expect additional drivers. Local support and resistance levels are 1.31300 and 1.31600, respectively. We recommend opening positions from these marks. In the near future, correction of the USD/CAD quotes is not excluded.
At 15:30 (GMT+3:00), core consumer price index will be published in Canada.
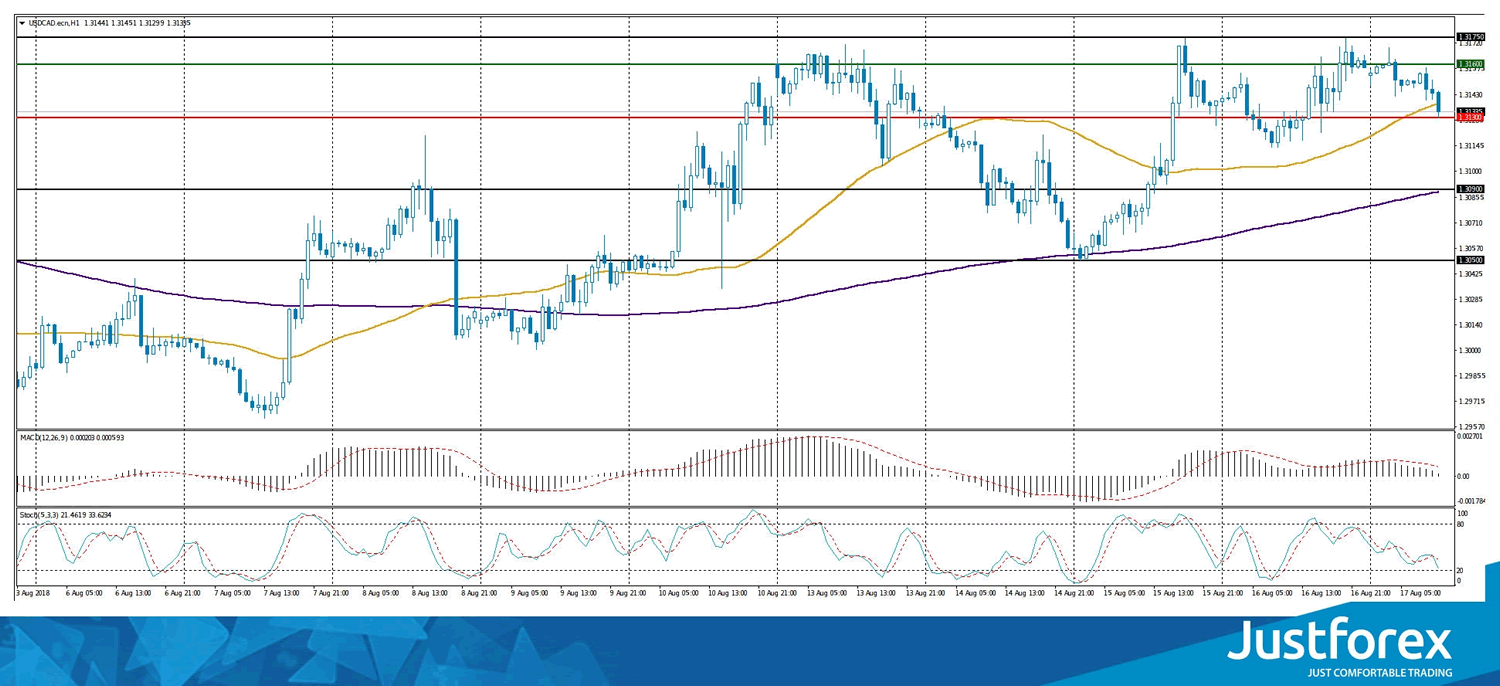
Indicators do not send accurate signals: the price is testing 50 MA.
The MACD histogram is in the positive zone, but below the signal line, which gives a weak signal to buy USD/CAD.
Stochastic Oscillator is located in the neutral zone, the %K line is below the %D line, which indicates a decrease in the USD/CAD quotes.
Trading recommendations
Support levels: 1.31300, 1.30900, 1.30500
Resistance levels: 1.31600, 1.32000
If the price fixes below 1.31300, the USD/CAD quotes are expected to decline. The movement is tending to 1.30900-1.30700.
Alternative option. If the price fixes above the resistance of 1.31600, it is necessary to consider purchases of USD/CAD. The movement is tending to 1.32000-1.32200.
The USD/JPY currency pair
Technical indicators of the currency pair:
Prev Open: 110.703
Open: 110.870
% chg. over the last day: +0.24
Day`s range: 110.679 – 110.735
52 wk range: 104.56 – 114.74
Yesterday, there was a variety of trends on the USD/JPY currency pair. At the moment, quotes are declining. Local support and resistance levels are 110.650 and 110.900, respectively. The positions should be opened from these marks. The trading instrument has the potential for further reduce.
The news feed on the economy of Japan is calm.
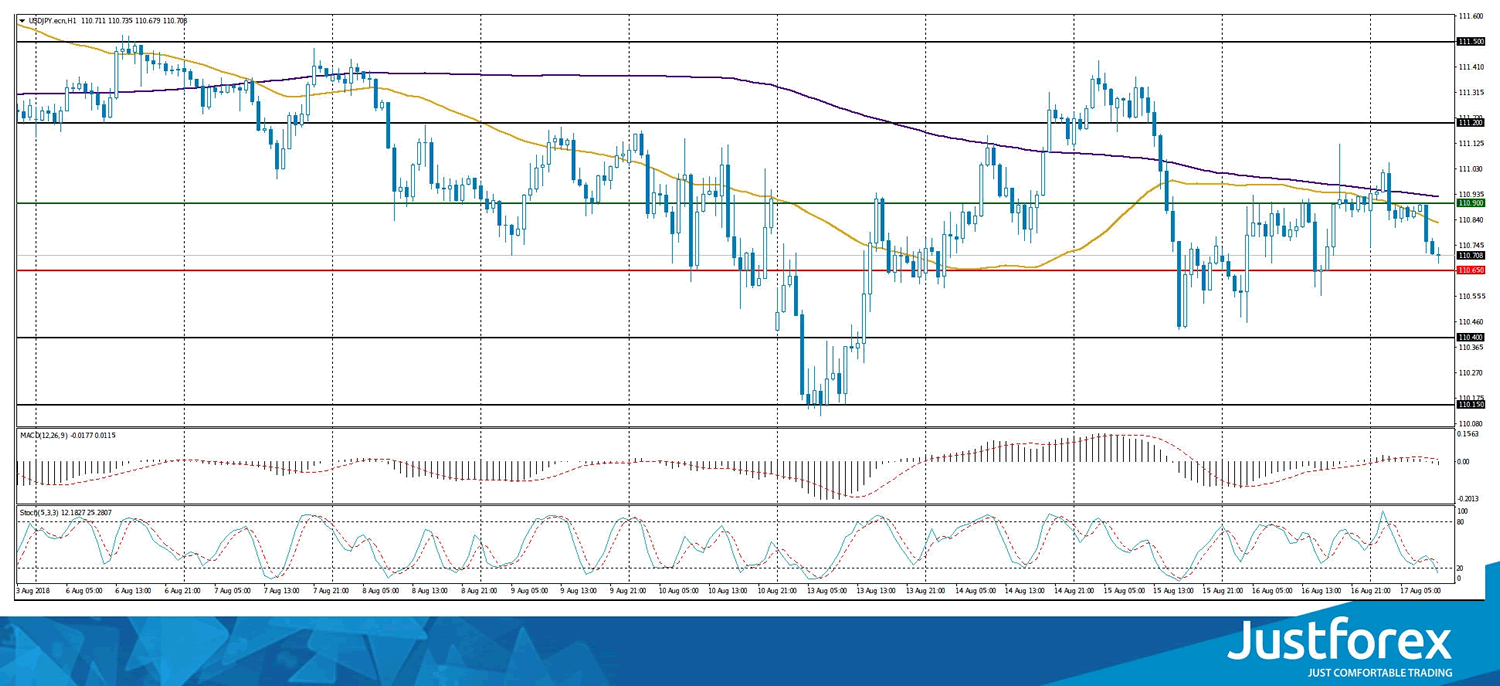
Indicators point to the power of sellers: the price has fixed below 50 MA and 200 MA.
The MACD histogram has moved into the negative zone, which signals the bearish sentiment.
Stochastic Oscillator is located near the oversold zone, the %K line is below the %D line, which gives a weak signal to sell USD/JPY.
Trading recommendations
Support levels: 110.650, 110.400, 110.150
Resistance levels: 110.900, 111.200, 111.500
If the price fixes above the resistance level of 110.900, the USD/JPY currency pair is expected to grow. The potential of the movement to 111.200-111.500.
Alternative option. If the price fixes below the level of 110.650, it is necessary to consider sales of USD/JPY. The movement is tending to 110.400-110.150.
EUR/USD Bullish SHS Pattern Within 1.1350 Zone
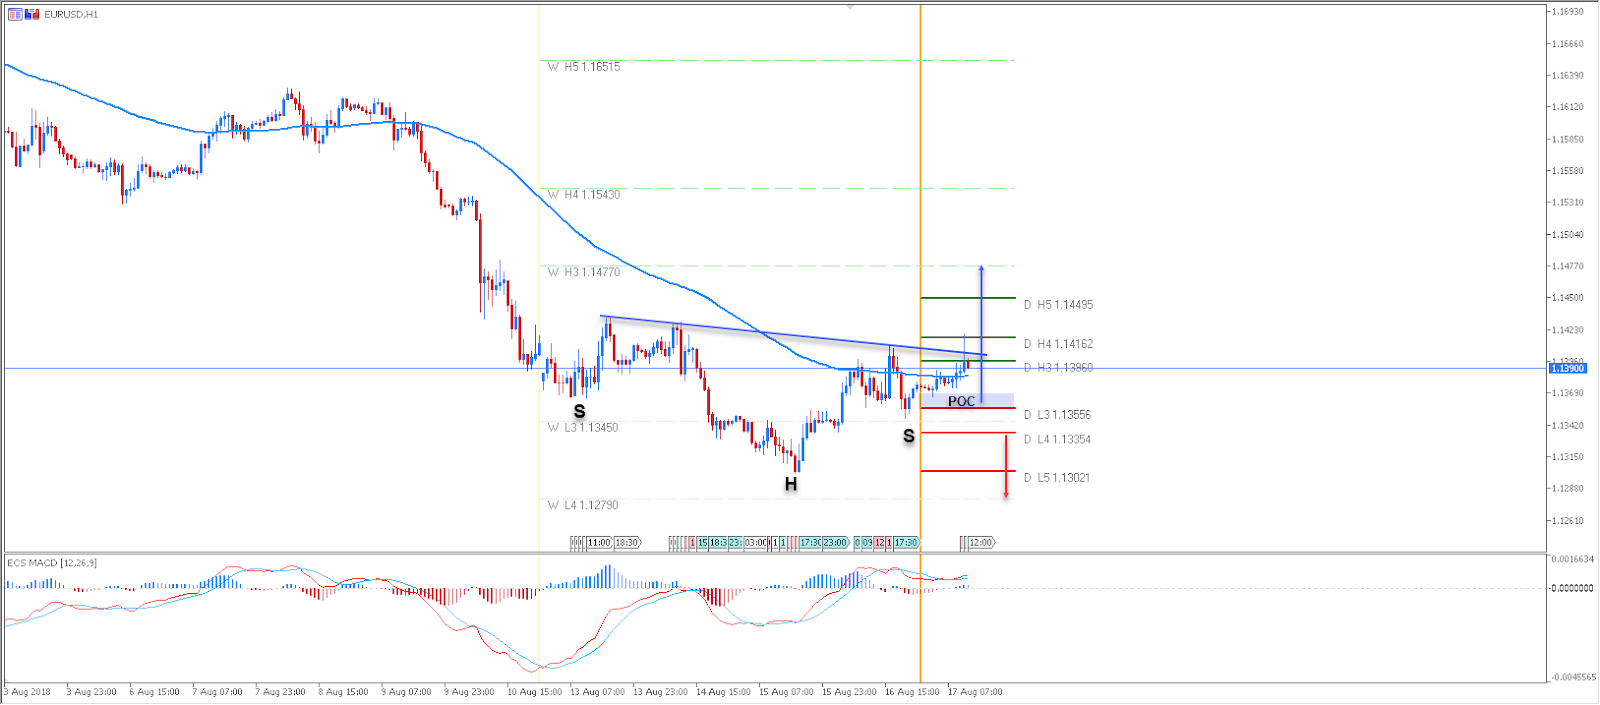
The EUR/USD has formed a bullish Head and Shoulders pattern with the right shoulder being within the 1.1350 zone. If the price closes above the trend line, it will mean a potential breakout to the upside targeting 1.1477. However if the price breaks below 1.1330, we could see a retest of 1.1300 with a potential for a further break lower.
W L3 - Weekly Camarilla Pivot (Weekly Interim Support)
W H3 - Weekly Camarilla Pivot (Weekly Interim Resistance)
W H4 - Weekly Camarilla Pivot (Strong Weekly Resistance)
M H4 - Monthly Camarilla Pivot (Very Strong Monthly Resistance)
M L3 – Monthly Camarilla Pivot (Monthly Support)
M L4 – Monthly H4 Camarilla (Very Strong Monthly Support)
POC - Point Of Confluence (The zone where we expect price to react aka entry zone)
Ethereum Remains Bearish
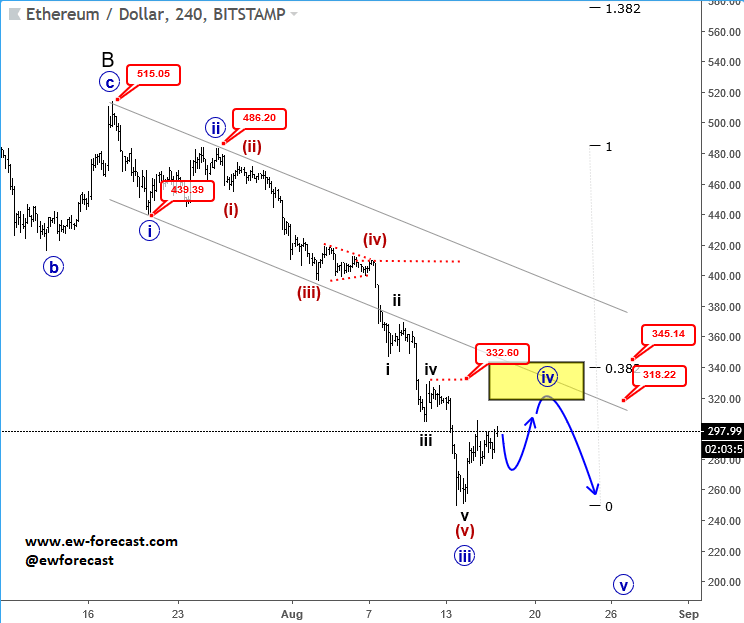
Ethereum is coming sharply to the downside, making an impulsive decline from July highs which is not over yet. An impulse is a five wave structure, where third wave is normally the sharpest and longest and this is exactly what we can see down from 485 level. It's an extended decline in five legs that is moving into some interesting Fib. support extensions here around 220/260, where can be a new potential base for current blue wave three. Bounce into wave four may show up soon, and can stop at 318-345 resistance
.We understand that there are a lot of traders and investors waiting on bottom to form, but for now that's not the case yet so we have to respect what market is doing. But we of-course would aggressively shift back to bullish mode once we see an impulse up from the low! This is key for any change in trend, in any market!
ETHUSD, 4h
Forex Technical Analysis: EUR/USD, USD/JPY, GBP/USD
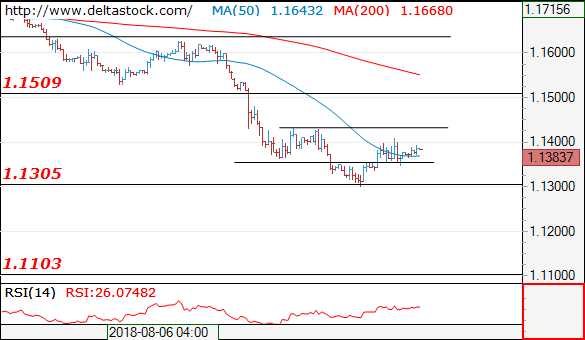
EUR/USD
Current level - 1.1383
The corrective rebound above 1.1300 is obviously from a senior time-frame and the intraday bias is positive, for a break through 1.1430, towards 1.1510.
| Resistance | Support | ||
| intraday | intraweek | intraday | intraweek |
| 1.1430 | 1.1510 | 1.1340 | 1.1300 |
| 1.1510 | 1.1750 | 1.1300 | 1.1100 |
 USD/JPY
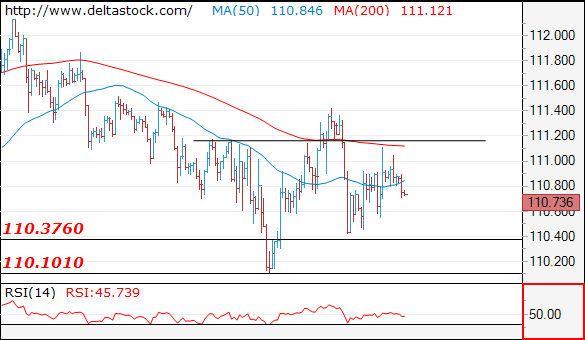
Current level - 110.73
The pair is ready for a slide towards 110.40, en route to 110.10.
| Resistance | Support | ||
| intraday | intraweek | intraday | intraweek |
| 111.20 | 114.50 | 110.40 | 110.10 |
| 112.10 | 114.50 | 110.10 | 109.30 |
GBP/USD
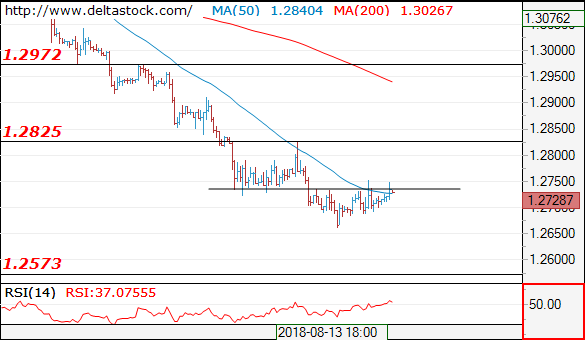
Current level - 1.2728
The bias remains bearish below 1.2740, for a slide towards 1.2570. Crucial on the upside is 1.2830.
| Resistance | Support | ||
| intraday | intraweek | intraday | intraweek |
| 1.2740 | 1.2970 | 1.2660 | 1.2570 |
| 1.2830 | 1.3210 | 1.2570 | 1.2570 |
Could Italy Become A New Greece?
The single currency has added 0.4% to the dollar on Thursday, having calmed to the beginning of Friday trading near 1.1380. As in the case of China and Turkey, the euro rebound masks an unpleasant trend in Italian bonds. In the past month 2-years notes yield has increased from 0.6% to 1.4%. This is a clear indication of the concern of investors around the country’s considerable debt burden.
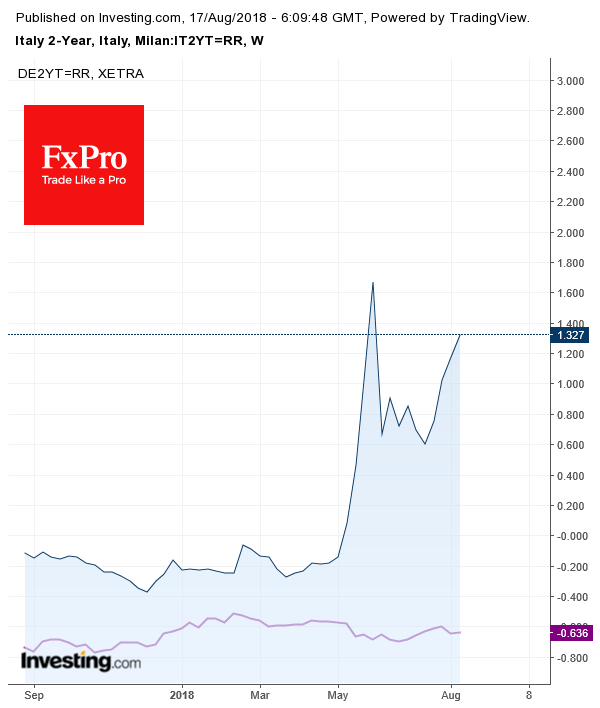
For comparison, the yield of German bunds with similar maturity almost did not change in this period, remained at the level -0.63%. The dynamics of the debt market may be ignored for some time by a single currency that looks unduly oversold against the backdrop of Turkey’s problems.
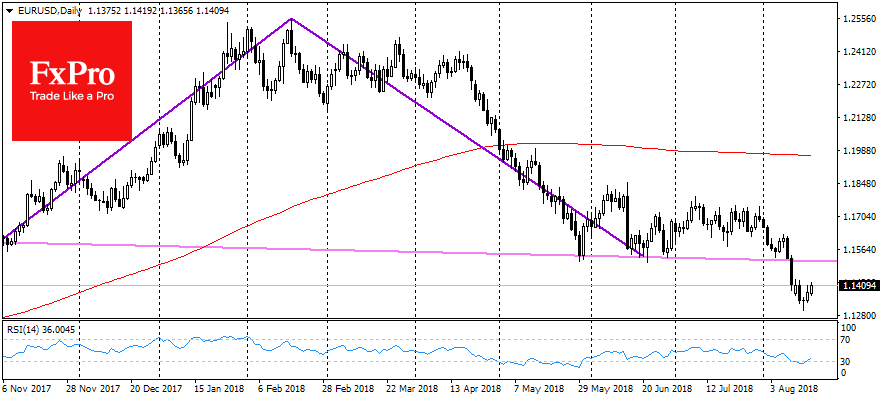
However, the further yield growth on the Italian bond market could come to the markets focus very soon and exert considerable pressure on the common currency, as it was with Greece case 7 years ago. The situation looks very similar: weak growth for many years, excessive debt burden and populist government. Especially disturb the fact that the economy of Italy is almost 10 times more than Greek.
Eurozone CPI finalized at 2.1%, core CPI at 1.1%
Eurozone CPI was finalized at 2.1% in July, up from June's 2.0% and compares with 1.3% a year earlier. EU CPI was finalized at 2.2% in July, up from June's 2.1%, compares with 1.5% a year earlier. Core CPI was finalized at 1.1%.
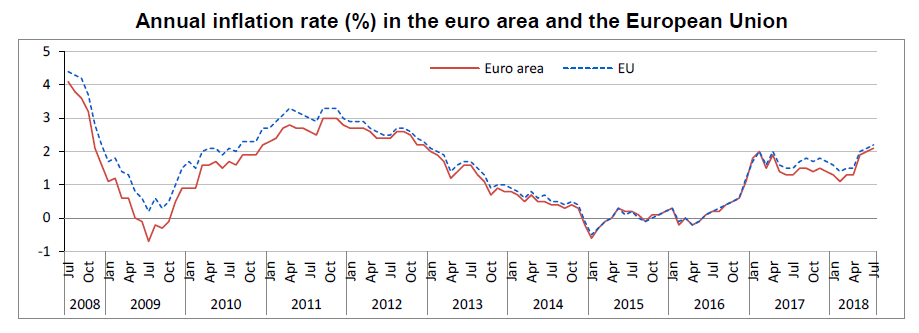
Geographically, CPI ranged from 0.8% in Greece, 0.9% in Denmark and 1.0% in Ireland, to Romania (4.3%), Bulgaria (3.6%), Hungary (3.4%) and Estonia (3.3%). CPI in Germany was at 2.1%, France at 2.6% and Italy at 1.9%.
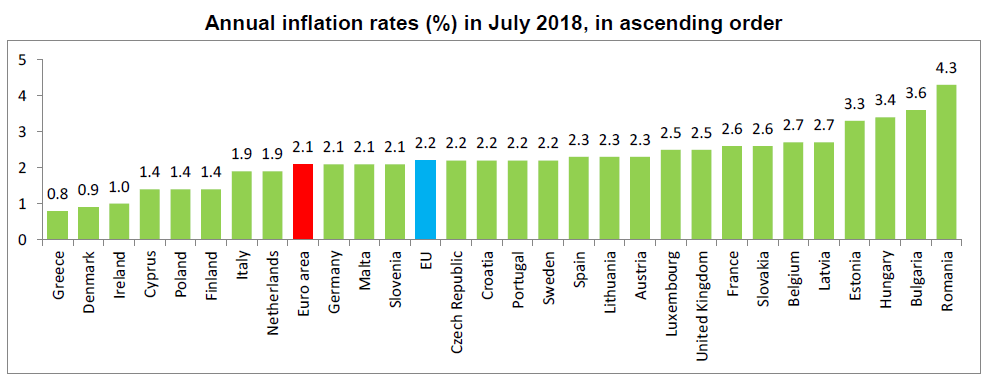
Composition-wise, highest contribution came from energy at 0.89%, services at 0.64%, food alcohol and tobacco at 0.49%.
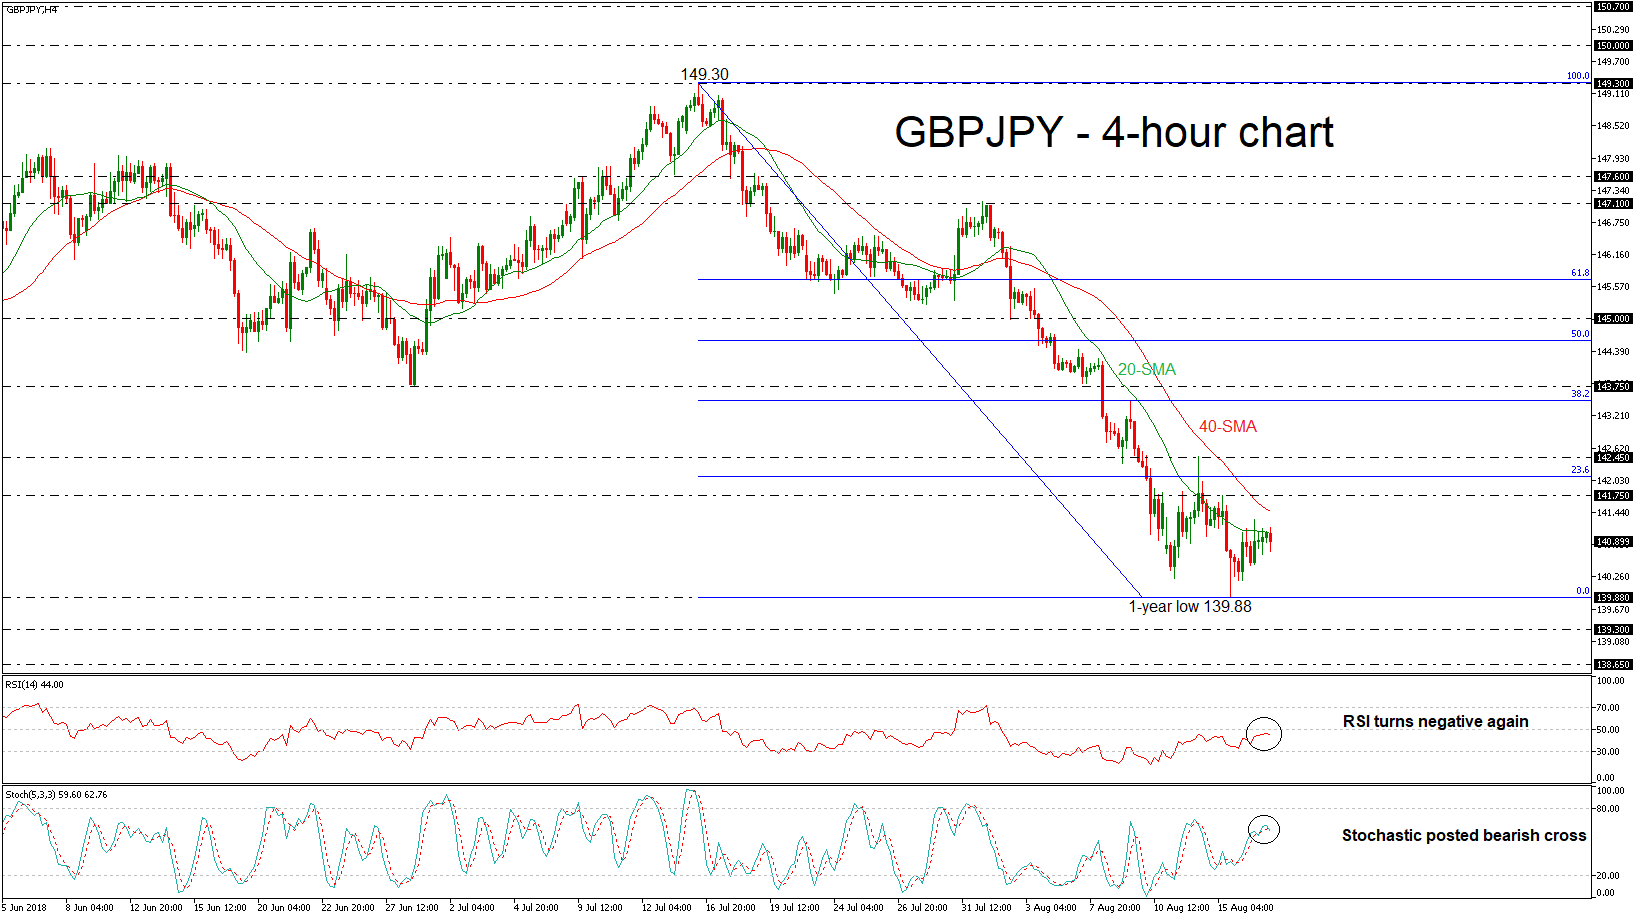
GBPJPY Turns Negative In Short Term After Bouncing Off 20-SMA
GBPJPY rebounded from the almost one-year low of 139.88 that it recorded on August 15 and challenged the 20-simple moving average (SMA) in the 4-hour chart. However, the pair pared some of Thursday’s gains and the momentum indicators are supportive of a weakening picture.
The RSI indicator is moving slightly lower in the negative territory, while the %K line of the stochastic oscillator created a bearish crossover with the %D line in the middle area.
Should the market fail to jump above the 20-SMA and moves lower, support could be met at the 139.88 bottom. A significant leg below this area could send prices towards the 139.30 barrier, taken from the low on August 2017. Then, if the market slips below this zone, the next stop could be at the 138.65 level, identified by lows June 2017.
On the flip side, if a 4-hour candle closes above the 20-SMA, immediate resistance could be met at the 40-SMA first at 141.46, and then at the 141.75 obstacle. Additionally, more gains could drive the price north towards the 23.6% Fibonacci retracement level of the downleg from 149.30 to 139.88, near 142.10.
To sum up, looking at longer timeframes, GBPJPY has been developing in a downtrend since July 16, after the pullback from the 149.30 hurdle.
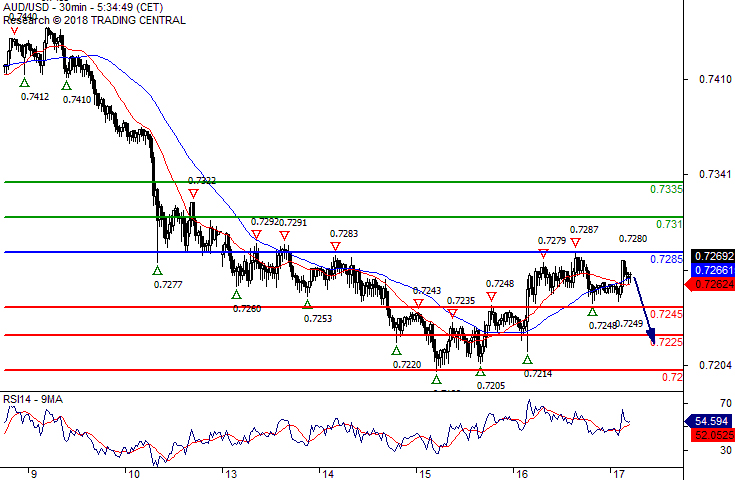
AUD/USD Key Resistance At 0.7285
Pivot (invalidation): 0.7285
Our preference Short positions below 0.7285 with targets at 0.7245 & 0.7225 in extension.
Alternative scenario Above 0.7285 look for further upside with 0.7310 & 0.7335 as targets.
Comment The index currently faces a challenging resistance area at 0.7285.