Sample Category Title
Australia Trade Minister Ciobo: Countries double down on trade pacts due to protectionist Trump
Australia's Trade Minister Steven Ciobo said today that the country is going to conclude free trade agreement with Hong Kong and Indonesia by the end of the year. Hong Kong is Australia's 12th largest trading partner with two-way trade at roughly AUD 16B. The two-way trade with Indonesia is at roughly the same size. And indeed, the FTA with Indonesia could come as soon as next month during Prime Minister Malcolm Turnbull's visit.
Ciobo also said that he's hopeful of signing FTA with Pacific Alliance, a Latin American trade bloc, this year. In addition, agreement with China-led Regional Comprehensive Economic Partnership could be in place too.
Ciobo added that due to Trump's protectionist rhetoric and policies, there has been a "desire from a number of countries to double down" on trade pacts. And that helps him seal deals.
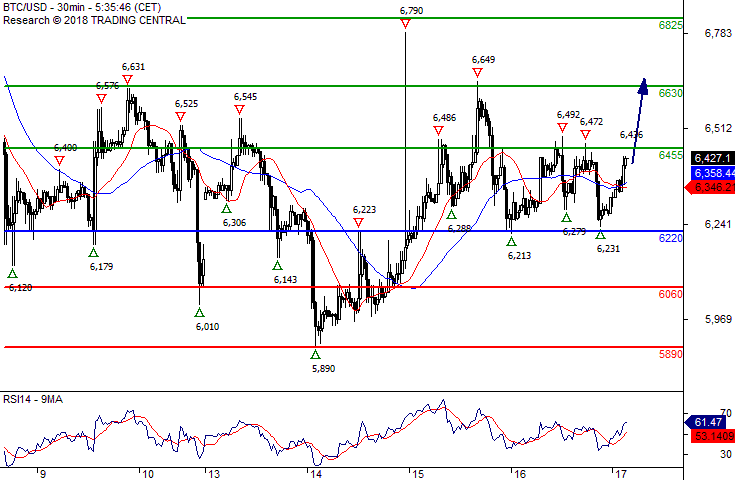
Bitcoin/Dollar Towards 6455
Pivot (invalidation): 6220
Our preference Long positions above 6220 with targets at 6455 & 6630 in extension.
Alternative scenario Below 6220 look for further downside with 6060 & 5890 as targets.
Comment The RSI calls for a new upleg.
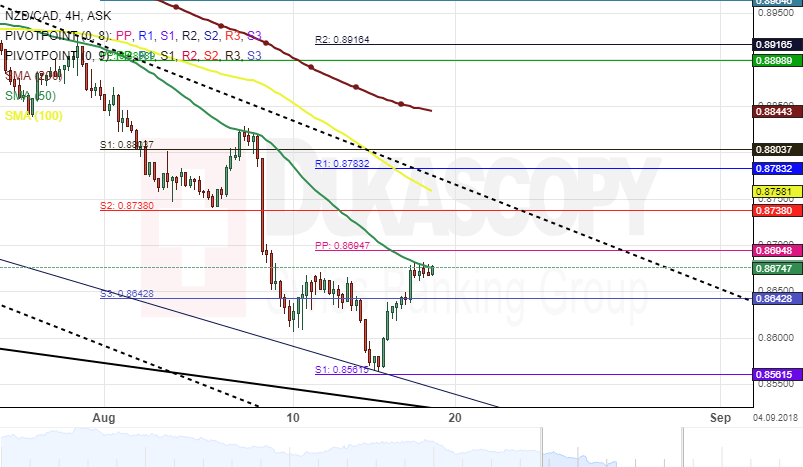
NZD/CAD 4H Chart: Daily Sell Signals
The NZD/CAD currency pair has been trading in several descending channels since the beginning of the year. The most important of the patterns is a downtrend line, which has guided the price lower.
After hitting a resistance level formed by the 55-hour simple moving average near 0.8827 on August 8, the exchange rate began to decline massively. As a result, the pair fell to the bottom border of a junior descending channel.
Technical indicators on both the smaller and the larger time frames demonstrate that the movement of the currency exchange rate is likely to continue its southern journey during the following trading sessions.
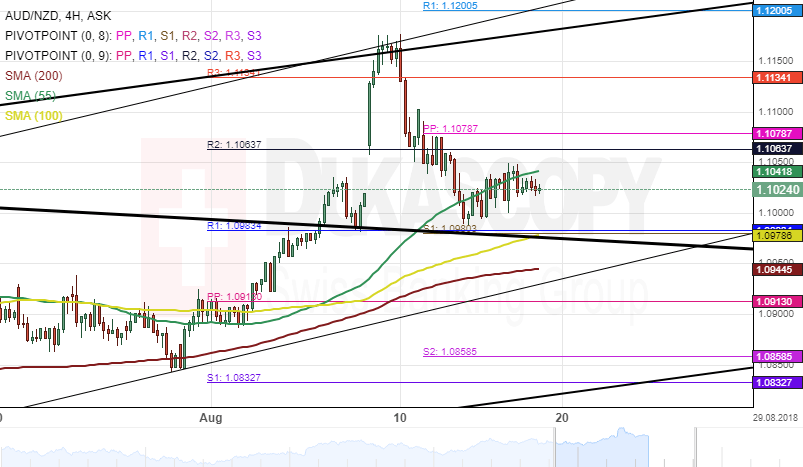
AUD/NZD 4H Chart: Daily Bullish Signals
AUD/NZD started appreciating since the beginning of April. The currency pair reversed from the lower boundary of a dominant descending channel on April 11 and a high mark of 1.1004 during the previous week trading sessions.
The exchange rate pullback from a seven-month high level on August 10 and began to depreciate. As a result, the currency pair breached some significant support level. Namely, the monthly, the weekly and the 55-hour simple moving average within this short period.
Technical indicators flash bullish signals on the daily time-frame. Therefore, it is likely that the currency exchange rate could reverse from a support cluster at 1.0983 during the following trading days.
EURUSD Analysis: Expected To Go Up
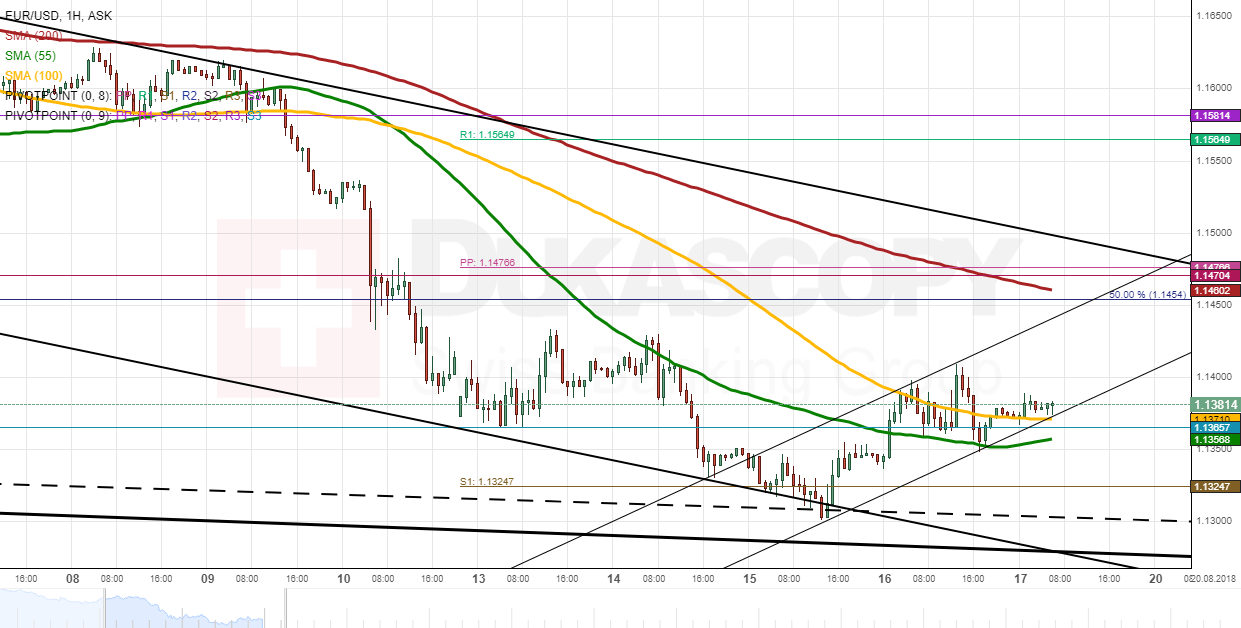
Despite surging early on Thursday, the Euro failed to pick up momentum against the US Dollar, as it was pressured from above by the psychological 1.14 level. Support was set by the 55-hour SMA near 1.1316. These two barriers forced the rate to trade in a narrow range the whole session yesterday.
Technical indicators are still bullish. This means that the Euro could find support at the 100-hour SMA and the monthly S3 followed by a surge towards the monthly S2, the 200-hour moving average and the upper boundary of a medium-term channel at 1.1470. A move above this level is not yet expected.
In case the 55-hour SMA is breached to the downside, a trend-line which is expected to limit any bearish gains is located at 1.13 .
GBPUSD Analysis: Poised For Gains
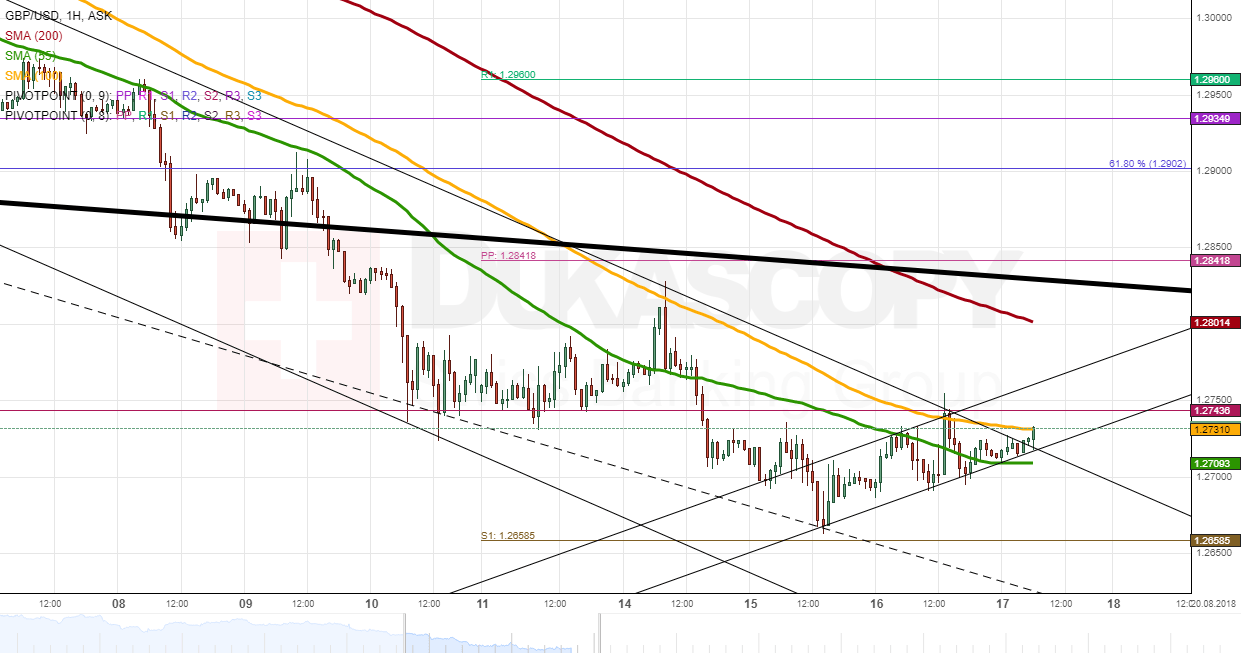
Thursday's trading session was very calm for the GBP/USD exchange rate. It was previously expected that a breakout from the 55-hour SMA would be followed by a surge, as this line has been a strong resistance level for three weeks now. This did not happen, as bulls were unable to surpass the monthly S2 and the 100-hour SMA at 1.2750.
Some upside potential is still apparent in the market with the daily high likely to be located near the senior channel, the 200-hour SMA and the weekly PP at 1.2840. This trading session might likewise be with low volatility due to lack of fundamental affecting the rate.
In general, the current appreciation is expected to continue next week as well, especially if taking into account that the Pound reached a one-year low against the Greenback on Wednesday.
USDJPY Analysis: Stopped At 111.00
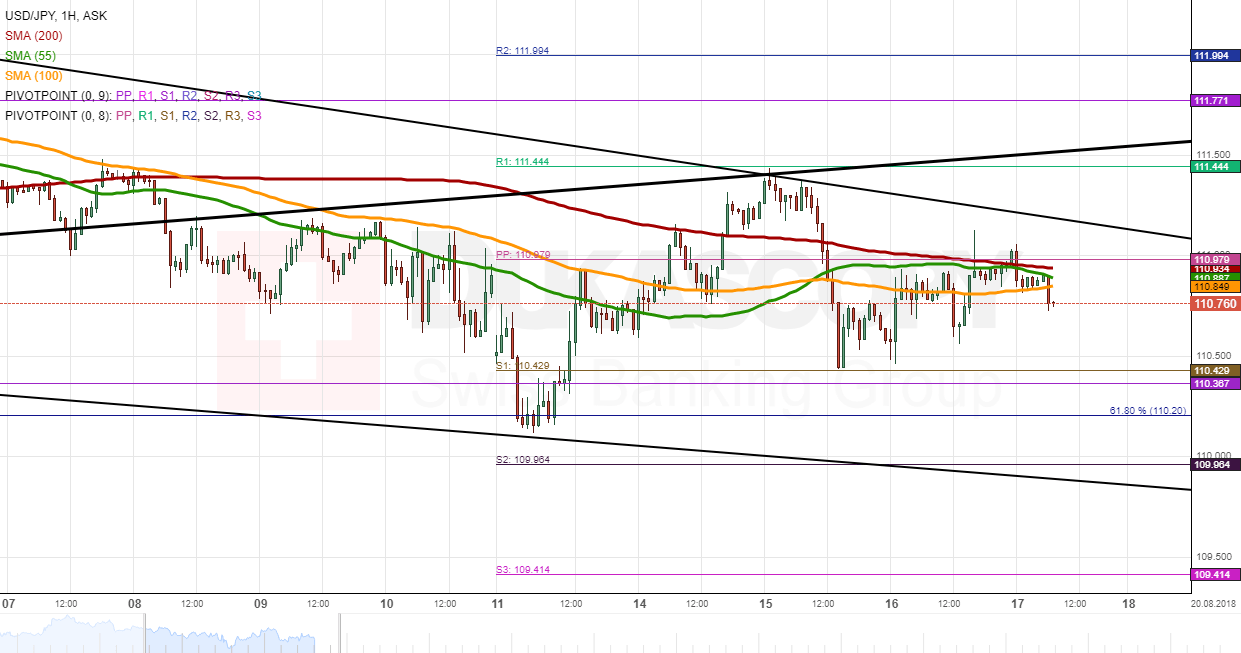
Following a reversal from the weekly and monthly S1s mid-Wednesday, the US Dollar began edging higher against the Japanese Yen. This advance was very limited due to being restricted by the 55-, 100– and 200-hour SMAs near 111.00.
Technical signals are mixed for today. However, given that the above resistance cluster was not surpassed, bulls could fail to achieve this today, as well. This allows to think that the US Dollar is more likely to push lower. If the monthly and weekly S1s are breached, the junior channel line at 110.00 is the following downside target.
The general expectation about this session is that no significant moves are likely to occur in any direction, thus leaving the Greenback fluctuating in the 110.40/111.00 range.
XAUUSD Analysis: Waits Breakout From 55-Hour SMA
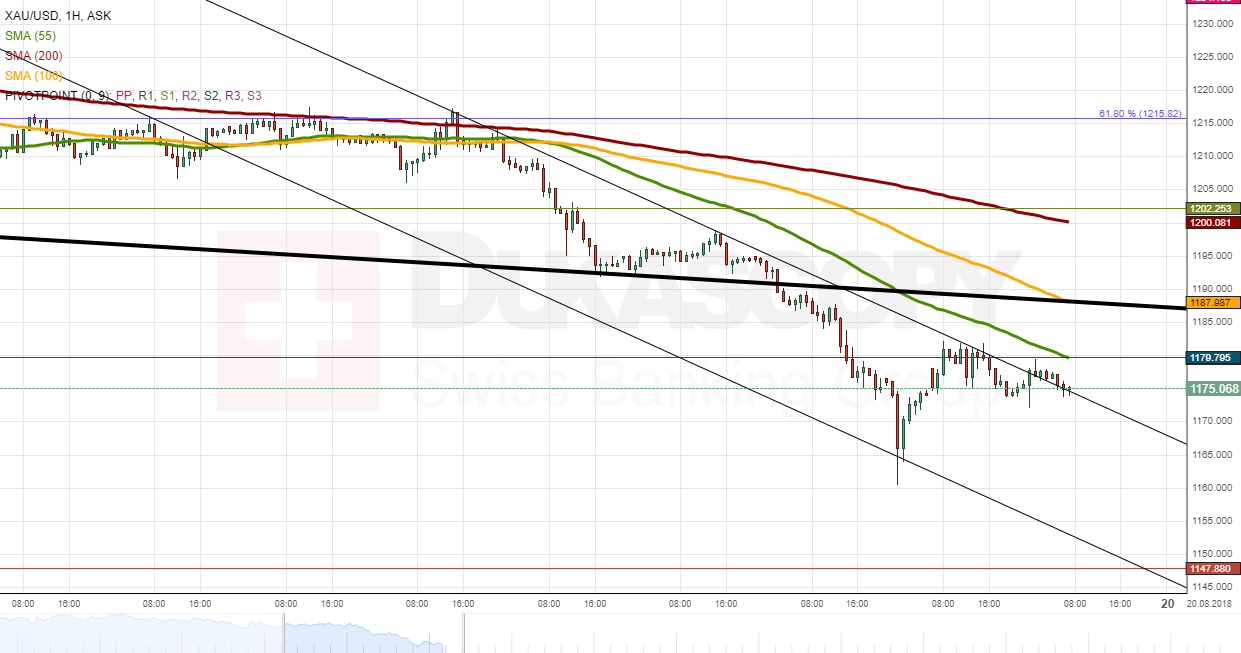
The yellow metal edged higher early on Thursday, but this slight appreciation was stopped by the monthly S2 and the 55-hour SMA at 1,180.00.
As apparent on the chart, the pair was testing a short-term trend-line early on Friday. If this line is breached together with the 55-moving average, bulls are likely to increase in strength which in turn would result in a surge up to the breached senior channel and the 200-hour SMA located near 1,195.00.
Conversely, in case this expected breakout fails to occur, Gold should remain trading along the 55-hour SMA without stepping over the monthly S3 at 1,160.00.
XAUUSD Intraday Analysis
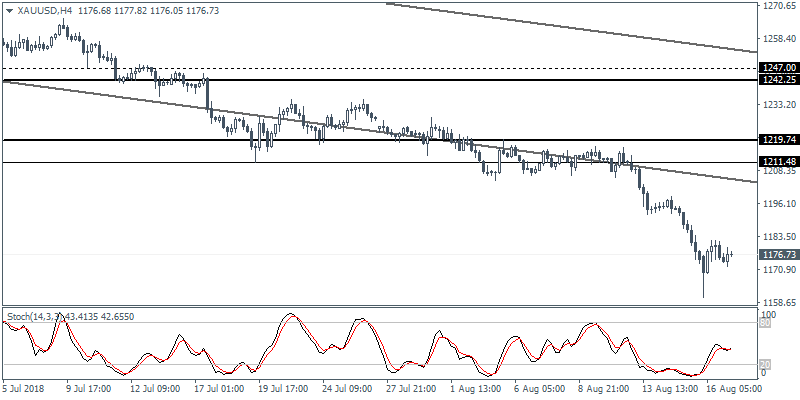
XAUUSD (1176.73): Gold prices pulled back from fresh intraday lows on Thursday. Gold fell to new lows of 1160.32 before recovering to close at 1174. The momentum remains strongly bearish but comes at a risk of a pull-back. The retest of the recently breached support at 1211.50 - 1219.75 remains an ideal price level for a retest. Establishing resistance at this level could keep the momentum to the downside which is however likely to stall in the near term.
USDJPY Intraday Analysis
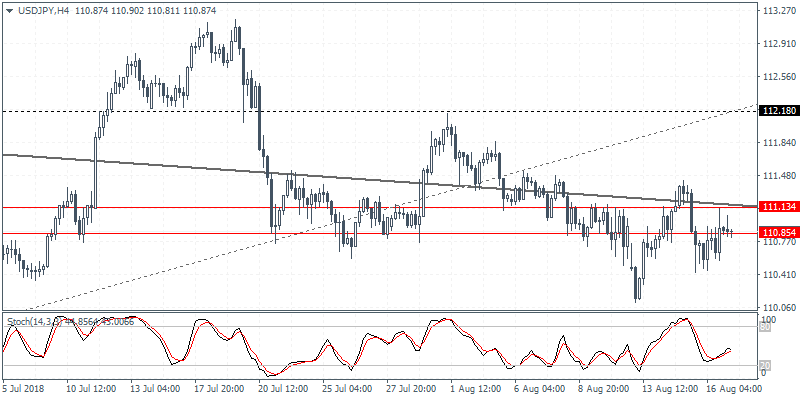
USDJPY (110.87): The USDJPY currency pair was seen closing bullish on Thursday. Price action remains trading sideways albeit drifting slightly lower. ON the 4-hour chart, the consolidation is seen taking place near the support and resistance level of 111.13 - 110.85 region. We expect the upside to potentially push the USDJPY currency pair toward 112.18 region. There is a chance that the currency pair could be forming resistance at this level which previously served as support. To the downside, the support at 109.45 remains a target.