Sample Category Title
EUR/GBP Daily Outlook
Daily Pivots: (S1) 0.8935; (P) 0.8948; (R1) 0.8963; More...
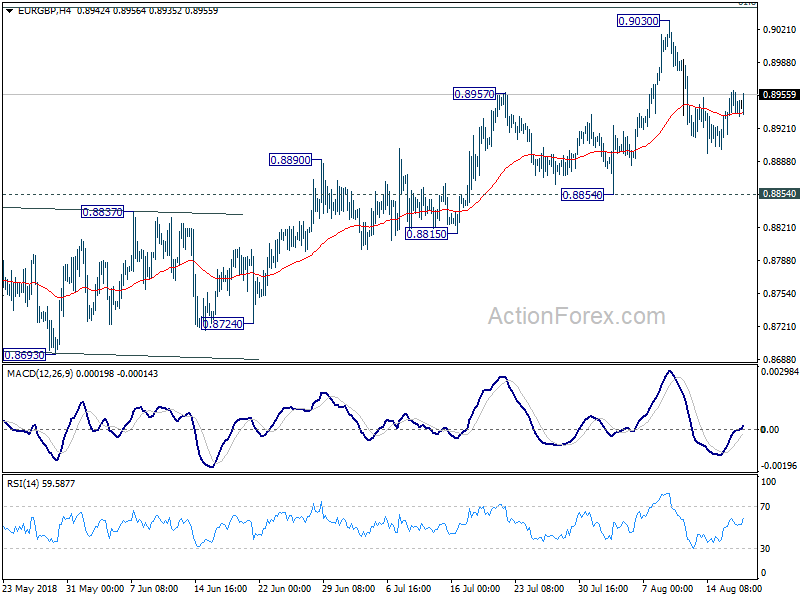
Intraday bias in EUR/GBP remains neutral as it's bounded in consolidation from 0.9030. Deeper pull back cannot be ruled out. But downside should contained by 0.8854 support to bring rebound. On the upside, firm break of 61.8% retracement of 0.9305 to 0.8620 at 0.9043 will pave the way to retest 0.9305 key resistance. However, sustained break of 0.8854 will indicate near term reversal and turn outlook bearish.
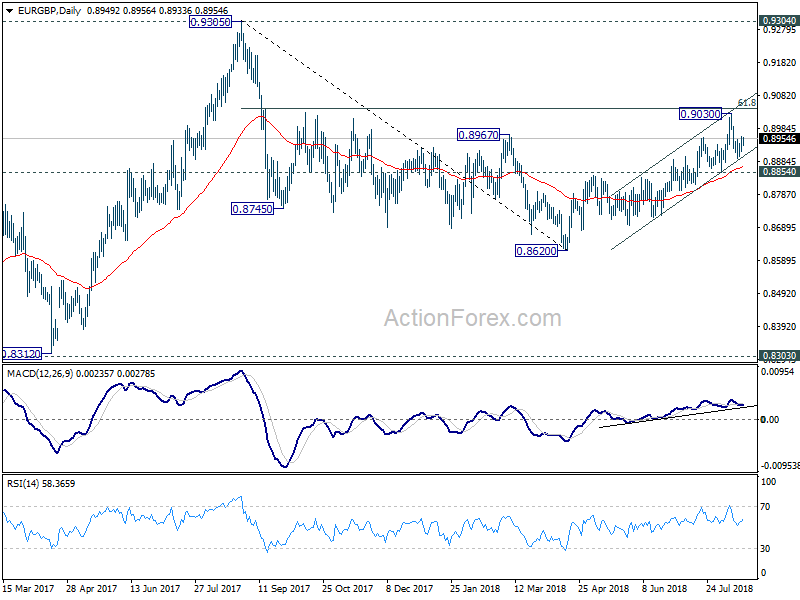
In the bigger picture, EUR/GBP is staying in long term range pattern from 0.9304 (2016 high). The corrective structure of the fall from 0.9305 to 0.8620 is raising the chance that rise from 0.8312 to 0.9305 is an impulsive move. But we're not too confident on it yet. In any case, we'd stay cautious on strong resistance from 0.9304/5 to limit upside in case of further rally. Meanwhile, if there is another medium term decline, strong support will likely be seen from 0.8303 to contain downside.
EUR/AUD Daily Outlook
Daily Pivots: (S1) 1.5624; (P) 1.5669; (R1) 1.5711; More....
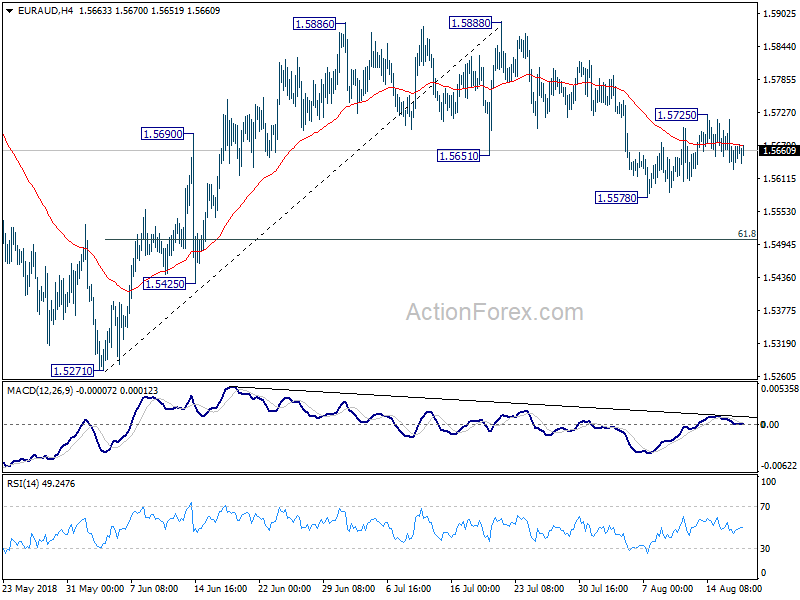
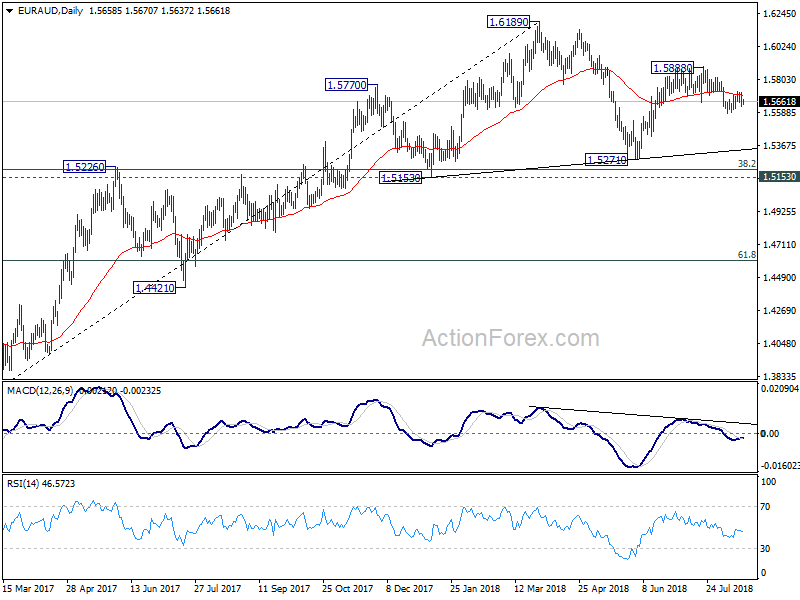
Intraday bias in EUR/AUD remains neutral for the moment. On the upside, above 1.5725 will extend the rebound form 1.5578 to retest 1.5888 high. On the downside, though, below 1.5578 will resume the fall from 1.5888 to 61.8% retracement of 1.5271 to 1.5888 at 1.5507.
In the bigger picture, the rebound from 1.5271 was somewhat weaker than expected. EUR/AUD also failed to sustain above 55 day EMA and hints on some underlying bearishness. Though, for now, as long as 1.5271 support holds, medium term rise from 1.3624 (2017 low) is still mildly in favor to extend through 1.6189 high, to 1.6587 key resistance (2015 high). Nevertheless, firm break of 1.5271 will complete a head and shoulder top pattern (ls: 1.5770, h: 1.6189, rs: 1.5888). That would indicate medium term reversal and turn outlook bearish.
EUR/CHF Daily Outlook
Daily Pivots: (S1) 1.1284; (P) 1.1317; (R1) 1.1373; More...
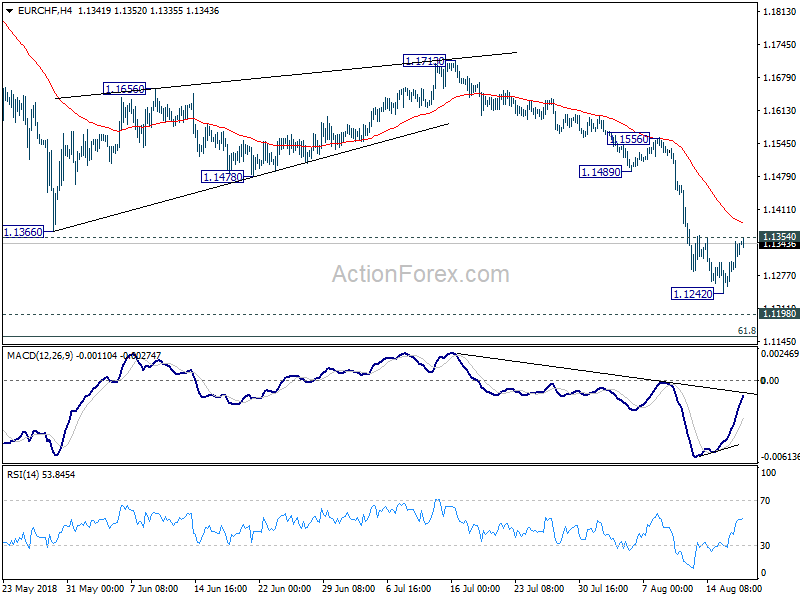
Intraday bias in EUR/CHF remains neutral at this point. Current decline from 1.2004 might extends lower. But even in that case, we'd expect strong support from 1.1154/98 to contain downside and bring rebound. Meanwhile, Meanwhile, considering mild bullish convergence condition in 4 hour MACD, break of 1.1354 will indicate short term bottoming. Stronger rebound should then be seen towards 1.1489 support turned resistance.
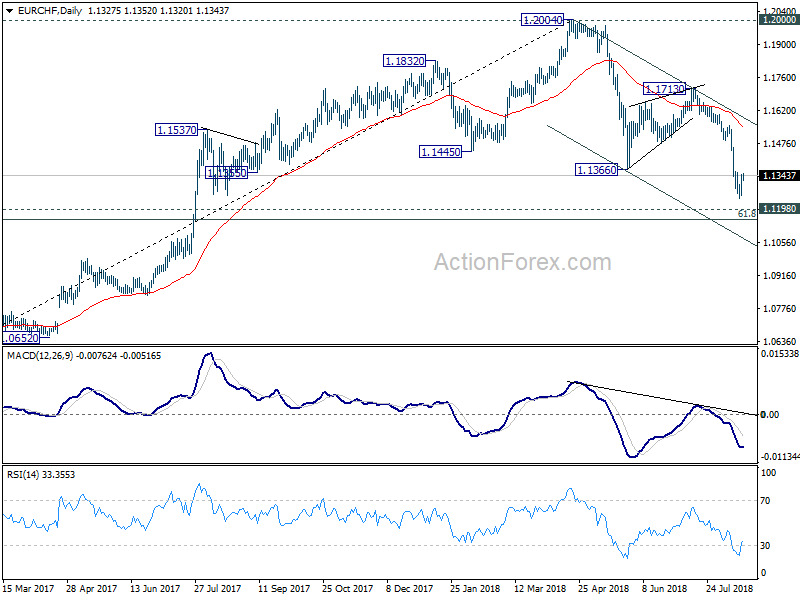
In the bigger picture, for now, the price actions from 1.2004 medium term top is seen as a correction only. Downside should be contained by 1.1154/98 support zone, 1.1198 (2016 high), 61.8% retracement of 1.0629 to 1.2004 at 1.1154 to complete it and bring rebound. This cluster level is in proximity to long term channel support (now at 1.1173) too. A break of 1.2 key resistance is still expected in the medium term long term. However, sustained break of the mentioned support zone will mark reversal of the long term trend.
EUR/JPY Arrives At Massive Decision Zone
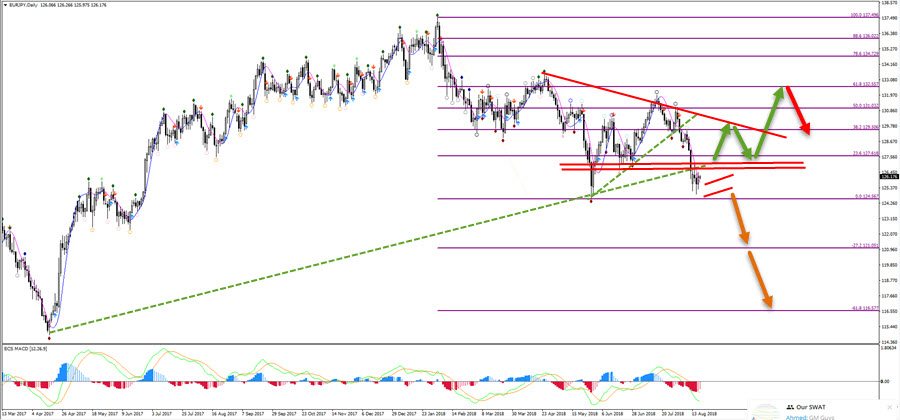
The EUR/JPY is either completing a wave 3 (purple) or C (blue). The resistance trend lines are the key decision zone because a bounce or breakout will determine the next movement.
The EUR/JPY is building a triangle chart pattern, which could be a wave 4 (red) within wave 3 (blue). This scenario becomes likely either if price breaks below the support trend line (blue) or if price breaks the triangle to the upside but bounces at the resistance trend line (red). The orange arrows indicate that the main target is the 6th wizz level. A bullish breakout above the resistance trend line and 4th wizz level could indicate a larger bullish ABC, which in turn means that the downside was an ABC (blue) rather than a 123 (purple).
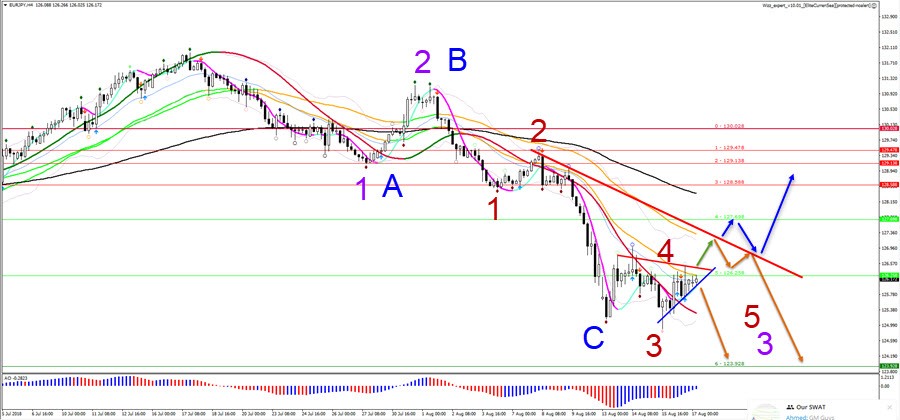
The EUR/JPY has broken below multiple support trend lines (dotted green). A bear flag (orange lines) could indicate a continuation to the down side (orange arrows). A break above the resistance zone (red lines) at around 127 could indicate a bigger bullish ABC pattern (green arrows) towards the 61.8% Fibonacci retracement level.
Elliott Wave Analysis: EURUSD More Weakness Expected
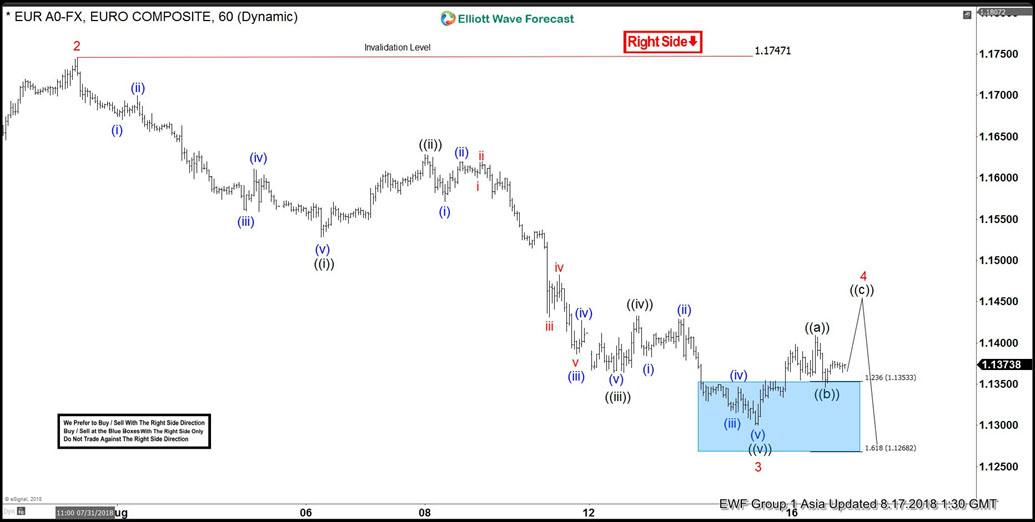
EURUSD short-term Elliott Wave analysis suggests that the bounce to 1.1747 high ended Minor wave 2. Down from there, Minor wave 3 ended at 1.1299 low. The internals of that decline unfolded as impulse structure with lesser degree cycles are showing sub-division of 5 waves structure lower in it’s each leg lower i.e Minute wave ((i)), ((iii)) & ((v)). While the sub-division in Minute wave ((ii)) & ((iv)) unfolded in 3 wave corrective sequence.
Down from 1.1747 high, the initial decline to 1.1529 low ended Minute wave ((i)) in 5 waves structure. The bounce to 1.1627 high ended Minute wave ((ii)). Below from there, the decline to 1.1364 low unfolded in 5 waves structure & ended Minute wave ((iii)). Up from there, the 3 wave bounce to 1.1431 high ended Minute wave ((iv)). Then the decline to 1.1299 low ended Minute wave ((v)) & also completed the Minor wave 3 lower. Above from there, Minor wave 4 bounce remains in progress in 3, 7 or 11 swings for the correction of 1.1747 high before further downside is seen provided the pivot at 1.1747 high stays intact. We don’t like buying the pair and prefer more downside against 1.1747 high in the first degree.
EURUSD 1 Hour Elliott Wave Chart
USDCAD Stands Above SMAs But With Weak Momentum In Near Term
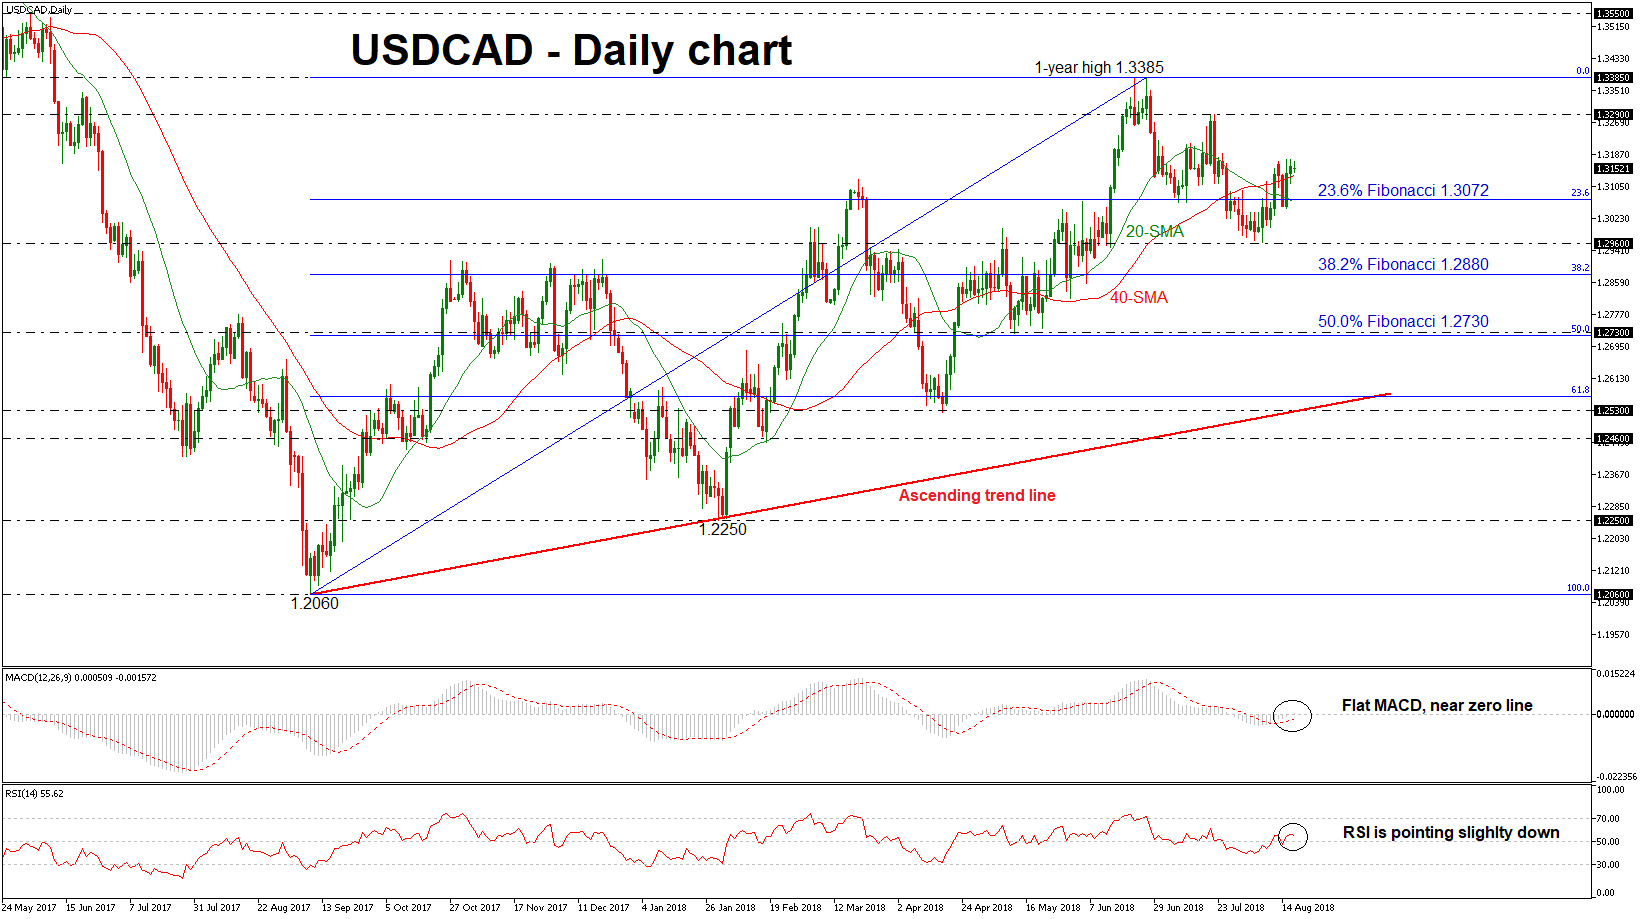
USDCAD continues to move higher after it formed a seven-week bottom at 1.2960 and successfully surpassed the 23.6% Fibonacci retracement level of the upleg from 1.2060 to 1.3385, around 1.3072. Moreover, the pair climbed above the 20- and 40-simple moving averages (SMAs) in the daily timeframe, confirming the bullish picture.
However, the RSI indicator and the MACD oscillator have both weakened in the positive area, with the former slightly sloping down above the 50 level. The latter is heading above its red trigger line but moves near its zero line.
Should the price continue to move higher, immediate resistance could be found around the 1.3290 hurdle, taken from the peak on July 19. An aggressive bullish rally above this zone could open the way towards the one-year high of 1.3385, achieved on June 27.
In case of bearish extensions, investors could look for support at the 23.6% Fibonacci (1.3072). Failure to hold above this level could open the door for the 1.2960 support level before attention turns to the 38.2% Fibonacci region near 1.2880.
Taking a look at the bigger picture, dollar/loonie has been trading within an ascending price structure since September 2017 and in the weekly timeframe, the price trades near its opening levels.
Financials Track Earlier Gains In the US, Chinese Equities Lag
General Trend:
- Asian equity markets trade mostly higher following gains in the US
- Shanghai Composite moves between gains and losses in early trade
- RBA Gov Lowe said he sees low probability of rate cut in Australia, barring major crisis in China
- New Zealand quarterly PPI driven higher by fuel prices
- China sells 30-year bonds at higher than expected yield
Headlines/Economic Data
Australia/New Zealand
- ASX 200 opened flat
- ASX 200 REIT index +1%, Telecom +0.9%, Utilities +0.7%, Financials +0.4%; Resources -0.5%, Energy -0.5%
- (AU) Reserve Bank of Australia (RBA) Gov Lowe: Domestic economy moving in the right direction; reiterates expects the next move in interest rates to be up, board's view likely to hold rates steady for a while yet
- (NZ) New Zealand Q2 PPI Input Q/Q: 1.0% v 0.6% prior; PPI Output Q/Q: 0.9% v 0.2% prior
China/Hong Kong
- Shanghai Composite opened +0.7%, Hang Seng +1.1%
- Hang Seng Info Tech index +2.2%, Telecom +0.6%, Financials +0.5%; Consumer Goods -1%, Materials -0.6%, Services -0.5%, Property/Construction -0.3%
- (CN) China Cabinet reiterates view to keep economic growth within a reasonable range; Premier Li said further measures should be taken to support market vitality and boost private investment.
- (CN) Trade talks between US and China said to be scheduled for Aug 22-23 - press
- (CN) China PBoC Open Market Operation (OMO): Injects CNY90B in 7-day reverse repos v CNY40B injected in 7-day reverse repos prior; Net: CNY90B injection v CNY40B injection prior
- (CN) For the week, the PBoC injected a net of CNY130B in its open market operations vs. nil w/w
- (CN) China PBoC Sets yuan reference rate: 6.8894 v 6.8946 prior
- (CN) People's Daily Commentary: China has 'big room' for macro-economic control
Japan
- Nikkei 225 opened +0.6%
- TOPIX Marine Transportation index +2.1%, Securities +1.3%, Electric Appliances +0.8%, Real Estate +0.5%
- Megabanks outperform
- (JP) Japan PM Abe said to plan to visit China near Oct 23rd - Japanese Press
Korea
- Kospi opened +0.2%
- (KR) South Korea Jul Unemployment Rate: 3.8% v 3.7%e
- (KR) South Korea Government: July job growth showed the smallest y/y increase since Jan 2010
- (KR) South Korea Finance Min: Government to employ all available policy tools to counter slow job growth
Other
- (MY) MALAYSIA Q2 GDP Q/Q: 0.3% V 1.4% PRIOR; Y/Y: 4.5% V 5.2%E
- (MY) Malaysia Central Bank: Cuts 2018 GDP growth forecast to 5.0% v 5.5-6.0% prior; Slower growth was impacted by declining production of natural gas and weak crude palm oil production.
- (MY) Malaysia Q2 Current Account (MYR): 3.9B v 12.0Be; Q2 net outflow on portfolio investment at MYR38.3B v MYR2.6B outflow q/q
- (SG) Singapore Jul Non-Oil Domestic Exports M/M : 4.3% v 0.8%e; Y/Y: 11.8% v 7.4%e: Exports to the US +33.7% y/y, China flat y/y
North America
- US equity markets ended higher: Dow +1.6%, S&P500 +0.8%, Nasdaq +0.4%, Russell 2000 +0.9%
- S&P500 Consumer Staples +1.4%, Financials +1.3%
- Nvidia [NVDA]: Declined in the afterhours after issuing results and guidance
- (US) Fed Chair Powell to speak on Aug 24 at Jackson Hole conference; topic is 'monetary policy in a changing economy'
- (US) Weekly Fed Balance Sheet Total Assets for week ending Aug 15th: $4.3T, -$806M w/w, -$212.7B y/y; Reserve Bank Credit: $4.22T, -$638M w/w, -$212.9B y/y
Levels as of 01:30ET
- Nikkei 225, +0.4%, ASX 200 +0.4%, Hang Seng +0.5%; Shanghai Composite -0.6%; Kospi +0.4%
- Equity Futures: S&P500 flat; Nasdaq100 -0.1%, Dax flat; FTSE100 +0.1%
- EUR 1.1389-1.1365 ; JPY 111.07-110.76 ; AUD 0.7282-0.7251 ;NZD 0.6603-0.6579
- Aug Gold flat at $1,184/oz; Sept Crude Oil flat at $65.47/brl; Sept Copper +0.7% at $2.624 /lb
The Turkish Crisis Has Been Abating This Week
Market movers today
In the euro area, we have the final HICP figures for July released. The initial estimates showed headline and core inflation at 2.1% and 1.1%, respectively. Judging from the country figures, we do not expect any revisions but we will look for evidence of the ECB's claim that underlying inflation pressures are boarding and are becoming more resilient.
In the US, University of Michigan consumer confidence for August is on the agenda. Consensus is for a further small increase to 98.0 but it will be particularly interesting to see whether inflation expectations, which the Fed is monitoring closely, will recover from their fall in July. However, even in the case of a miss, we do not think it would necessarily lead the Fed to postpone the expected September hike.
Brexit talks continue in Brussels and EU chief negotiator Michel Barnier may hold a news conference.
Tomorrow, German Chancellor Angela Merkel and Russian president Vladimir Putin will meet in Berlin to discuss Syria, Ukraine and the Nord Stream 2 pipeline.
Selected market news
The global equity market continues to see gains with the Asian markets in positive territory and the US stock market increased yesterday. The positive sentiment is spurred by news over the past few days that trade talks are about to resume between China and the US in late August. Yesterday, US President Donald Trump welcomed the relaunch of trade talks with China but cautioned on difficult talks ahead, saying ‘They just are not able to give us an agreement that is acceptable, so we're not going to do any deal until we get one that's fair to our country'. We share this cautious view given that the upcoming talks are really to see whether there is scope to launch broader trade talks and given President Trump is buoyed by the strong US economy and stock markets. As a sign of a precarious relationship between the two countries, the Pentagon yesterday warned that the Chinese military is ‘likely training for strikes' on US targets according to a Reuters story.
The Turkish crisis has been abating this week, after the Turkish authorities took steps to mitigate the pressure on the lira. However, yesterday, the US treasury stepped up the pressure on Turkey, warning that more sanctions will be put on Turkey if the imprisoned US pastor is not released soon. The lira pared some of its recent gains after the comments from the US Treasury.
Yesterday, Norges Bank as expected left the policy rate unchanged at 0.50%. This was an ‘intermediate' meeting, i.e. there was no monetary policy report or press conference, just a press release. Also as expected, Norges Bank continues to signal a September hike despite global turmoil: ‘The Executive Board's assessment is that the upturn in the Norwegian economy appears to be continuing broadly in line with the picture presented in June'. Underlying inflation is below the inflation target but the driving forces indicate that it will rise further out. Overall, the outlook and the balance of risks do not appear to have changed. We still expect Norges Bank to hike rates on 20 September.
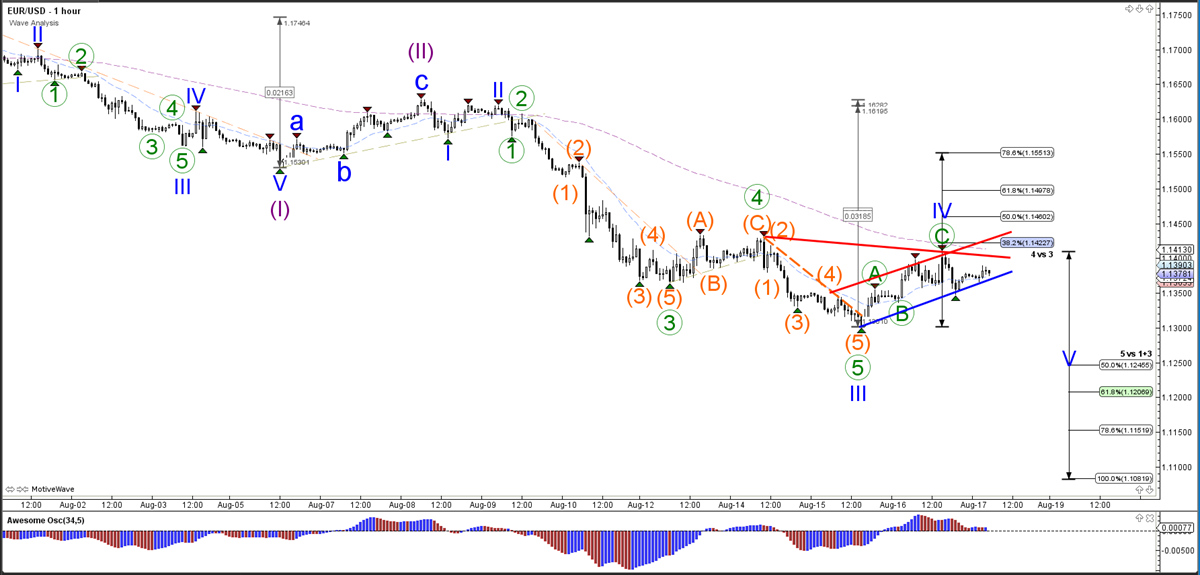
EUR/USD Bear Flag Pattern Within Wave 4
The EUR/USD seems to be making a slow and corrective chart pattern, which is probably a bullish retracement within a wave 4 (blue). This is valid as long as the price stays below the 50% Fibonacci level of wave 4 vs 3. A break above the 50% Fib makes a wave 4 less likely. A break below the support line (blue) of the channel could indicate a bearish breakout towards the Fibonacci targets of wave 5.
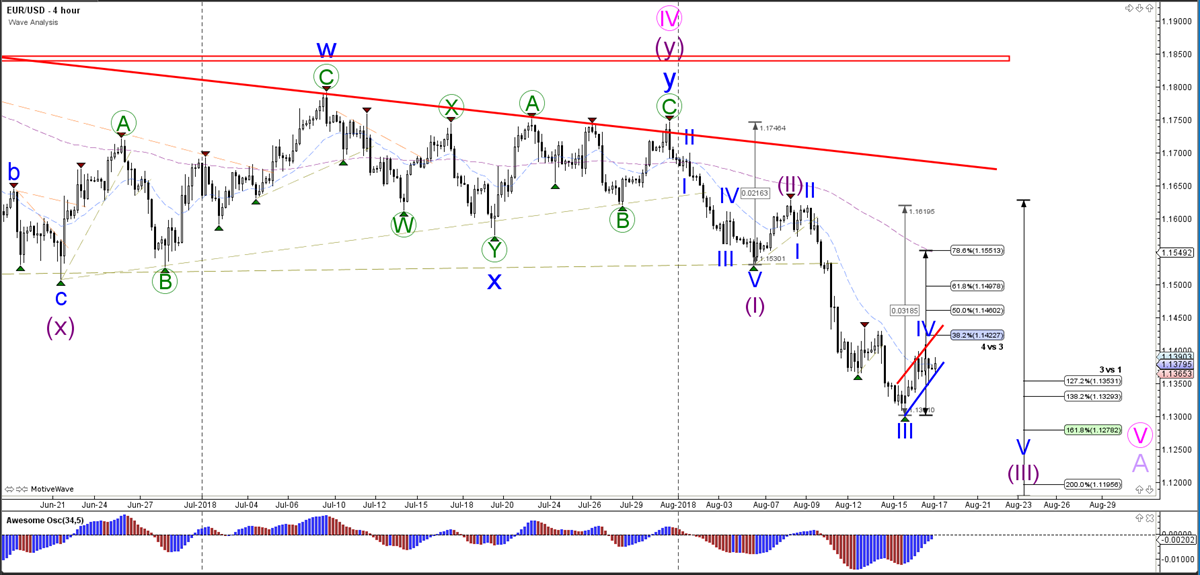
The EUR/USD seems to have completed an ABC (green) correction within wave 4 (blue). A break above the resistance trend line could indicate a larger bullish correction, whereas a bearish break could start the bearish wave 5 (blue).
USD/JPY Bear Flag In Wave B Correction
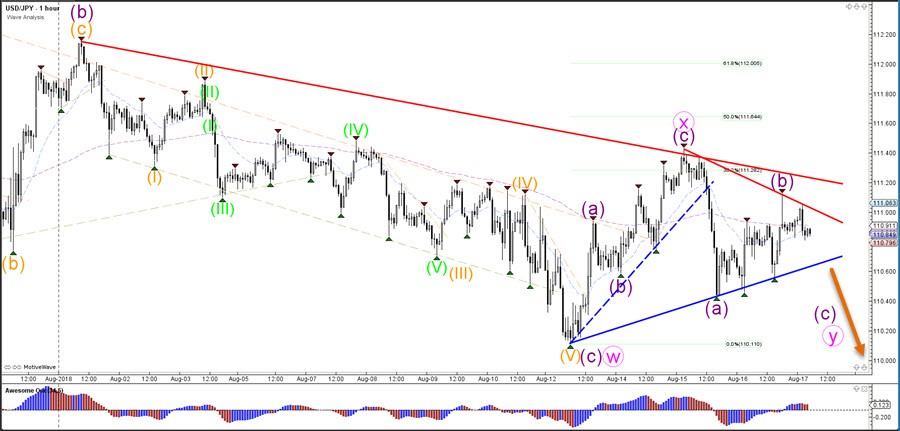
The USD/JPY is building a triangle chart pattern which is indicated by the support (blue) and resistance (red) trend lines. The wave patterns suggest that a bearish breakout is most likely as part of a WXY (pink) correction within wave E (purple) of wave B (red).
A bearish breakout below the support trend line could confirm the expected wave Y (pink) whereas a bullish breakout above the resistance trend lines could indicate a larger wave X (pink).
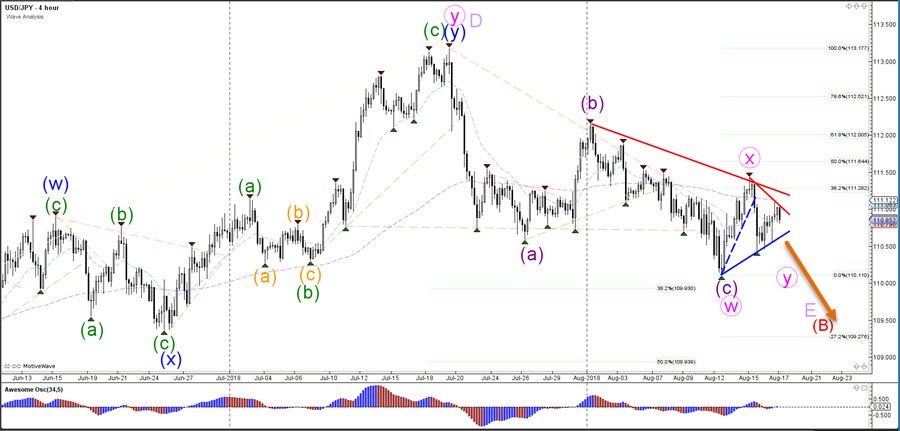
The USD/JPY seems to be building a bearish ABC (purple) correction within wave Y (pink). The wave B (purple) could be a bear flag chart pattern.