
U.S. Review
Summer Spending at Restaurants, Bars Surges
- Retail sales data for July showed the U.S. consumer continuing to exhibit strength, with broad-based sales growth and a notable acceleration in food service & drinking places sales.
- Housing starts rose in July, led by small gains in both singleand multifamily starts, but the increase was below the Bloomberg consensus.
- Upward revisions to the June data helped offset a weak July reading for industrial production. The trend in industrial production remains solidly upward, with production over the past year notching the biggest one-year gain since early 2011.
Summer Spending at Restaurants, Bars Surges
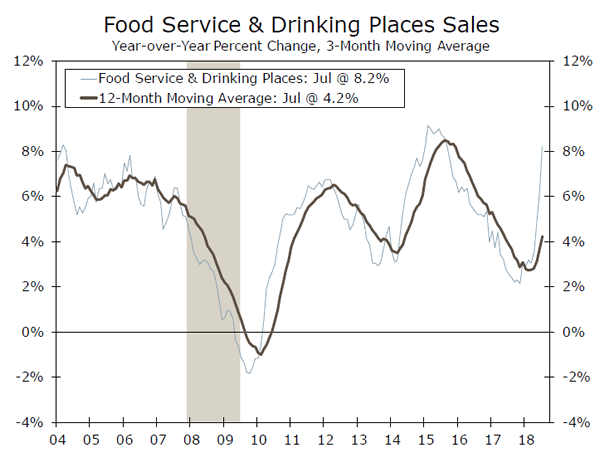
Broad-based strength in retail sales in July stole the show this week in U.S. economic data. Retailers reported a 0.5 percent monthly sales increase in July, led by surging spending at food service & drinking places. The year-over-year pace of sales at restaurants and bars has sharply accelerated (see chart on front page), and the three-month average annualized pace is the highest on record dating back to 1992. The strength in retail sales extended beyond this sector, as clothing sales, non-store retailers and even department stores posted strong starts to the third quarter. After a weak Q1 in which real personal consumption rose at just a 0.5 percent annualized pace, consumer spending bounced back to a robust 4.0 percent pace in Q2. The early data for Q3 suggest the weak Q1 was just an aberration and the underlying pace of consumption growth remains strong.
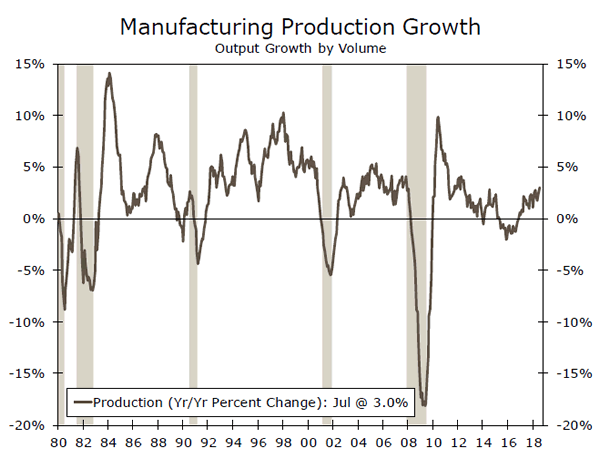
Industrial production expanded a scant 0.1 percent in July, which missed the mark of the 0.3 percent increase expected by markets. The miss can largely be traced to a 0.5 percent decline in the volatile utilities component, however, and an upward revision to June more than made up for the shortfall. Mining output dipped, the first monthly drop in more than a year, but the manufacturing sector showed no sign of slowing down as factory output rose 0.3 percent in July and 3.0 percent over the year (top chart). While the outlook for the industrial sector remains hazy amid trade war concerns, the near-term trend in industrial production remains solidly upward, with production over the past year notching the biggest one-year gain since early 2011. Job growth has matched the higher sentiment and output, as the 12-month change in manufacturing payrolls through July (+327,000) is the largest since April 1995.
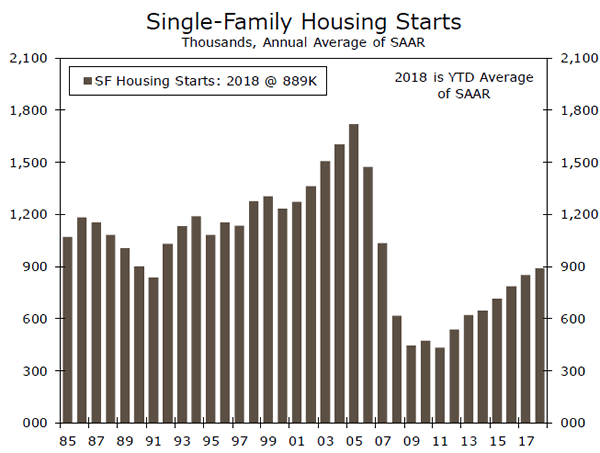
Total housing starts increased to a 1.168-million unit pace, rising 0.9 percent in July. While new units started in July came in below expectations for the second straight month, starts are still running 6.2 percent ahead of last year on a year-to-date basis. Despite the number of starts falling short of expectations, builder confidence remains high. That builders continue to express such a high degree of confidence in current market conditions supports our stance that housing starts will be stronger in coming months even though our expectations have been slightly scaled back recently. Singlefamily starts are still grinding higher as they have for most of this cycle (middle chart), though new homebuilding remains a much smaller portion of the economy than it was in the last expansion.
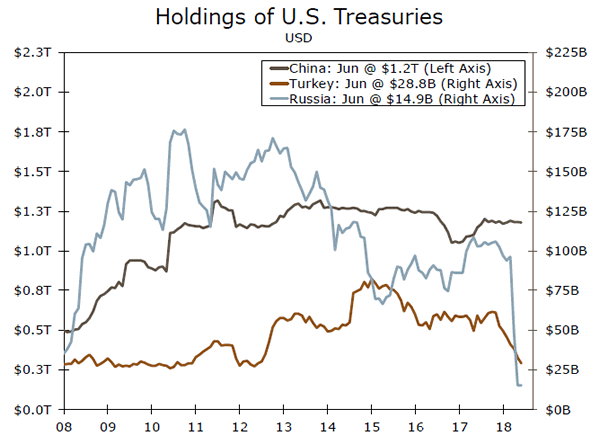
Finally, data on capital flows garnered some attention this week amid emerging market fears centered on Turkey. Holdings of U.S. Treasuries fell significantly in Turkey and Russia through the first half of the year (bottom chart). This multi-year low in June potentially signals that these countries had fewer foreign exchange reserves on hand to grapple with the softness in their currencies that has occurred over the past few weeks. For the U.S. Treasury market as a whole, however, Russia and Turkey are relatively small players compared to other foreign holders such as China, which holds more than $1 trillion in U.S. Treasuries. For now, China’s holdings have been relatively steady, helping to limit any upward pressure on Treasury yields from foreign selling.
U.S. Outlook
Existing Home Sales • Wednesday
Existing home sales slowed to an annualized pace of just 5.38 million in June. Low inventories are still the primary problem holding back sales. However, there looks to be some improvement on this front. Total inventories climbed to 1.95 million in June, a large enough gain to make the year-over-year growth rate in inventories positive for the first time in three years. However, shortages remain a barrier to sales, especially in the South and West.
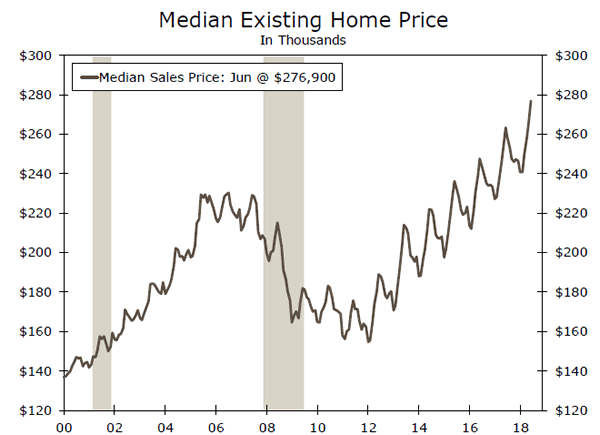
The median price of an existing home rose to $276,900 in June, a fresh all-time high. On a nominal basis, median home prices are 20 percent above their pre-recession peak. The debt service ratio (principle and mortgage payments as a share of disposable income) for mortgage debt remains historically low, as a result of household deleveraging and low interest rates since the financial crisis. However, higher home prices and rising mortgage rates risk putting homeownership out of reach for more households.
Previous: 5.38M Wells Fargo: 5.42M Consensus: 5.43M (SAAR)
New Home Sales • Thursday
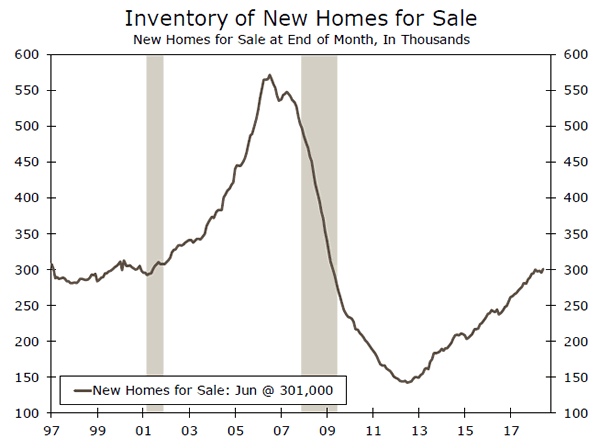
New home sales fell 5.3 percent in June to a 631,000-unit pace. All regions saw declines, though the largest drop was in the South, which accounts for slightly more than half of new home sales. Sales have now fallen in two of the last three months, meaning weakness is becoming harder to dismiss as transitory.
Lack of supply has been a persistent factor holding back sales, as the number of homes available for sale has failed to meet demand for homeownership. This remains a major part of the story; though inventories of homes rose in June, completed inventories remain near historic lows. However, another factor to watch is whether higher home prices and rising mortgage rates are serving to erode demand. In the University of Michigan’s Consumer Sentiment Index, the share of consumers stating that now is a good time to buy a home continues to slide. We will be watching home sales and sentiment data for indications of further weakening.
Previous: 631K Wells Fargo: 648K Consensus: 650K (SAAR)
Durable Goods Orders • Friday
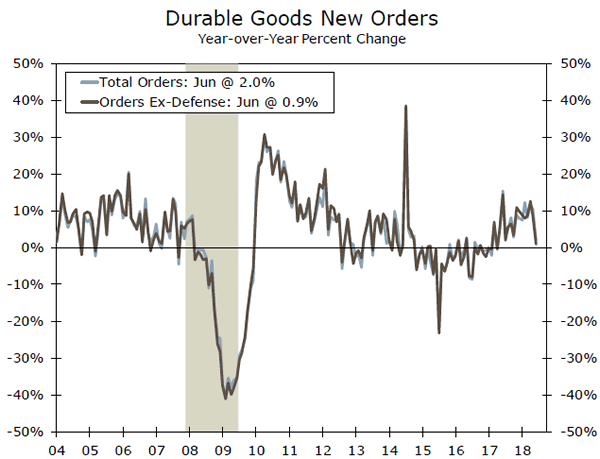
Durable goods orders rose 0.8 percent in June, well below preliminary expectations for 3.0 percent. Excluding the volatile transportation sector, however, orders were closer to expectations, up 0.2 percent versus a consensus estimate of 0.5 percent. In addition, May durable goods orders ex-transportation were revised higher from flat to a 0.3 percent gain. All-in-all, we see further indication of a modest expansion in the factory sector. Equipment spending contributed 0.2 percentage points to the strong 4.1 percent annualized pace of GDP growth in Q2. This was below the previous five quarters, but remained solid. We expect a larger contribution in Q3 given a pickup in core capital goods orders over the past several months, which we expect to continue in July. We are calling for 0.4 percent growth in durable goods orders ex-transportation in July. However, we expect a decline in aircraft orders to weigh on headline durable goods orders growth.
Previous: 0.8% Wells Fargo: -0.8% Consensus: -0.3% (Month-over-Month)
Global Review
Global Economy Displays Relative Calm
- While global markets have been somewhat volatile this week, in particular in Turkey, global economies have continued to display relative calm. U.K. retail sales recovered in July but employment growth has eased, though with inflation pressures absent the Bank of England should be on hold for some time.
- The latest round of Chinese economic data points to an economy that remains on a gradually slowing path, a trajectory that should see a continued pause in Chinese authorities’ effort to reduce leverage in the economy. Meanwhile, Australia’s economy is only slowly improving, suggesting Reserve Bank of Australia rate hikes are likely still some way away.
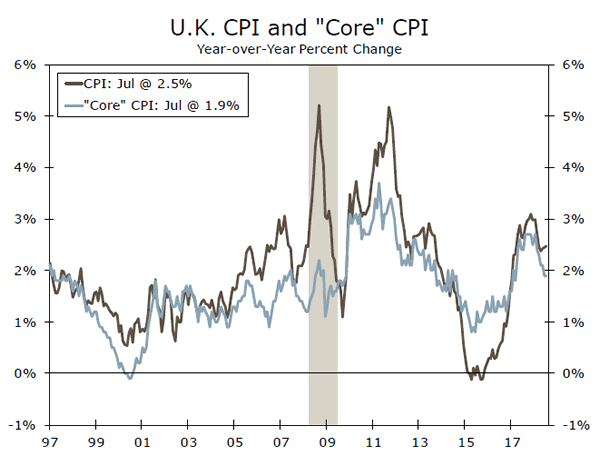
U.K.: Keep Calm and Carry On
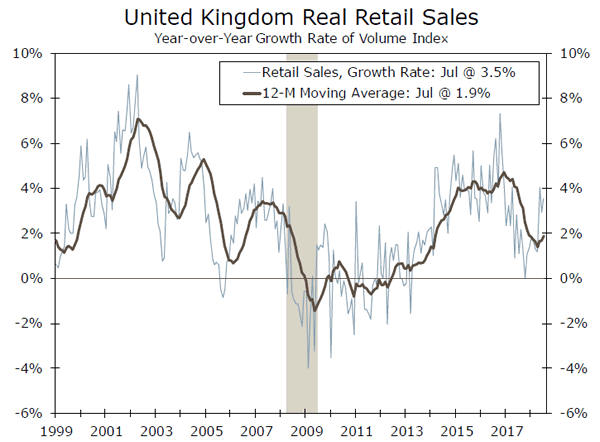
The British economy continues to show resilience, with the 0.4 percent gain in Q2 GDP (not annualized) representing a 22nd straight quarter of positive growth. That said, the economy’s advance is steady rather than strong. July retail sales rose 0.7 percent month-on-month, essentially reversing their sizeable June drop, while the employment gain for the three months to June slowed to just 42,000. Meanwhile, wage and price pressures are dissipating. Although July CPI inflation ticked up to 2.5 percent year-on-year, core inflation was steady at 1.9 percent, slightly below the Bank of England’s target, while wage growth also eased in June.
In addition, uncertainty surrounding Brexit persists. Brexit negotiations between the U.K. and European Union resumed this week, and so far there are no reports of significant progress, while the key issue of the Irish border has yet to be resolved. Given sluggish growth, little inflation and ongoing Brexit uncertainty we see little reason for the Bank of England to adjust policy further for now, and do not expect the next U.K. rate hike until well into 2019.
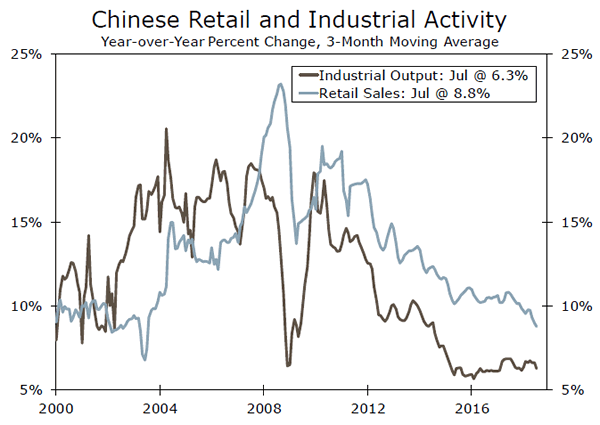
China’s Economic Slowdown Continues
The latest round of Chinese data point to a continued slowdown in China’s economy. July retail sales growth slowed to 8.8 percent year-over-year, while industrial production rose 6.0 percent yearover year, both below the consensus forecast. Growth in fixed asset investment also slowed, to 5.5 percent year-to-date in July. These latest economic figures come after confidence surveys also showed some softening in July.
Given the ongoing slowdown in China’s economy and with some increase in global market volatility in recent weeks, Chinese authorities have temporarily paused their efforts to reduce leverage in the Chinese economy. Over the past few months the People’s Bank of China has reduced the amount of funds that commercial banks need to hold as reserves against deposits, while the central bank has only occasionally and partially followed the Federal Reserve’s rate hikes with its own interest rate moves. As a result, market interest rates in China have declined so far in 2018. Nonetheless, the central bank’s policy actions have so far seemed to gain little traction, and a further growth slowdown and further Chinese policy moves remain possible.
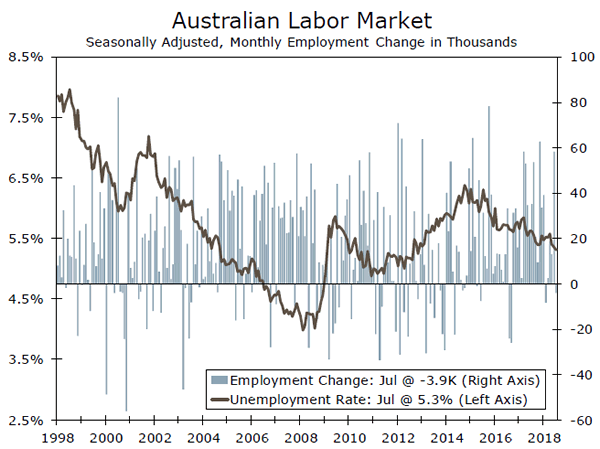
Australia’s Labor Market Gradually Improving
China’s moderate economic performance has also translated into a modest performance for the Australian economy. Perhaps one on of the more encouraging areas has been the labor market. Even with July employment showing a fall of 3,900, the average monthly gain so far this year has been 17,100. The jobless rate dipped to 5.3 percent, while wage growth –as measured by the Wage Price Index– ticked higher to 2.1 percent year-over-year. Although there has been some improvement in the labor market, it has been gradual and not enough to prompt action from the Reserve Bank of Australia. Accordingly, the central bank should be on hold for some time, with an initial rate hike not expected until sometime next year.
Global Outlook
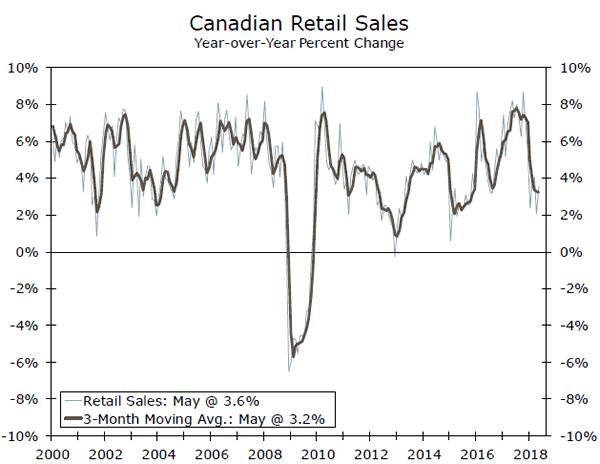
Canada Retail Sales • Wednesday
Canada’s consumer spending started 2018 on a sluggish note, with growth of just 1.1 percent annualized in Q1. While high levels of household debt may be contributing to consumer caution, steady job gains and faster wage growth could see some moderate strengthening in household spending in Q2. Canada’s May retail sales rose 2.0 percent month-on-month, and even with a forecast 0.7 percent payback in June, retail sales should be relatively healthy for Q2 as a whole. With consumer spending accounting for around 60 percent of overall GDP, and given firmer wages and inflation, the strength or otherwise of consumer spending could be important in determining when the Bank of Canada takes its next rate hike step.
On Wednesday, Mexico also releases June retail sales. Retail spending has firmed moderately this year, and for June we expect a small 0.2 percent month-on-month gain.
Previous: 2.0% Wells Fargo: -0.7% (Month-over-Month)
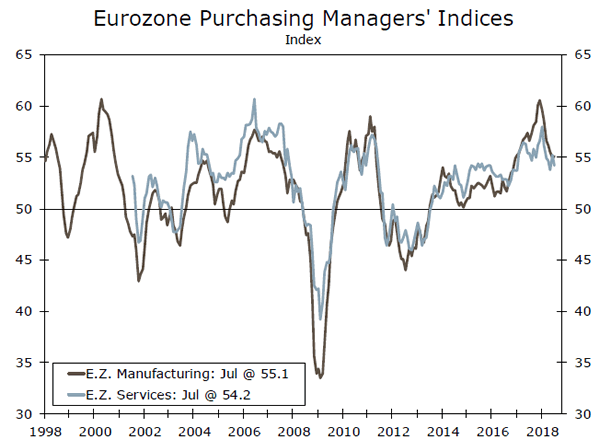
Eurozone PMIs • Thursday
Next week sees one of the timeliest readings on the Eurozone economy, in the form of Markit’s Purchasing Manager Indices. As the chart at left illustrates, these sentiment surveys have fallen markedly for both the manufacturing and service sectors this year, a decline that has also coincided with a perceptibly slower pace of growth. Eurozone GDP has advanced at just a 1.4 percent pace during the first half of this year.
The August PMIs surveys should offer insights into the prospects for a Eurozone growth recovery in the second half of 2018. The manufacturing PMI rose to 55.1 in July, and is expected to remain steady at 55.1 in August. There will likely be more interest in the services PMI, which fell to 54.2 in July, and should partially recover to 54.4 in August. With services accounting for the majority of the economy, it is the services PMI outcome that may be most influential for expectations of the path of the Eurozone economic growth.
Previous: 54.2 (Services); 55.1 (Manufacturing) Consensus: 54.4 (Services); 55.1 (Manufacturing)
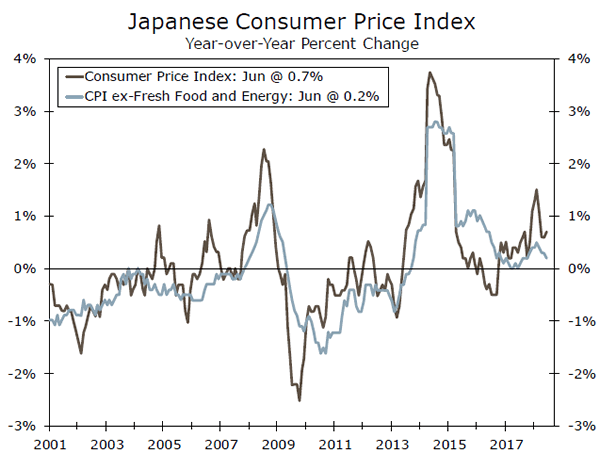
Japan CPI • Friday
Japan’s July CPI is released late next week, which has the potential to show modestly faster inflation than June. The overall CPI should pick up to 0.9 percent year-over-year (reflecting a similar quickening seen in Tokyo’s July CPI), while the closely followed CPI ex-fresh food measure should rise by 0.9 percent year-over-year.
While Japanese inflation has risen gradually over the past several quarters, and there have even been signs of firmer wage growth, the rate of inflation has levelled out in recent months. Indeed, at its late July monetary policy announcement the Bank of Japan said it “intends to maintain the current extremely low levels of short- and long-term interest rates for an extended period of time”, and lowered its CPI forecasts, even as it allowed for greater variability in 10-year government bond yields. Even if there is a modest uptick of inflation, Bank of Japan policy will likely remain on hold for some time.
Previous: 0.7% Wells Fargo: 0.9% Consensus: 1.0% (Year-over-Year)
Point of View
Interest Rate Watch
Will Turkey Affect Fed Policy?
Volatility returned to financial markets this week due to concerns about potential spillover effects related to the financial crisis in Turkey. We are sometimes asked what effect volatility in foreign financial markets will have on Fed monetary policy. The answer is “very little.”
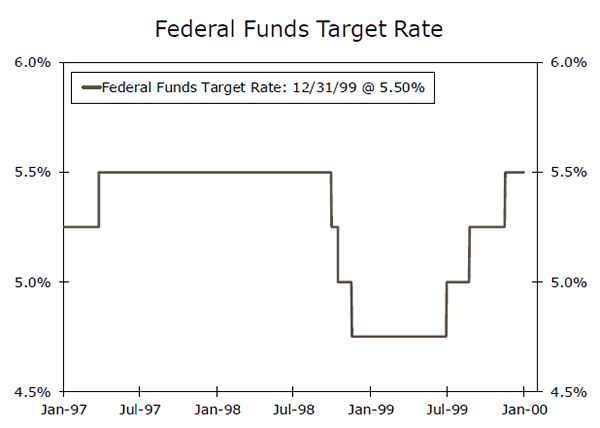
Fed officials fully understand that their actions have effects on foreign economies and financial markets. But they view the Federal Reserve as the central bank of the United States, not the central bank of the world. They are mandated by law to maintain “price stability” and to achieve “full employment.” If the volatility abroad affects those variables, then Fed officials will respond. If it does not, then they won’t. A look back to the “Asian financial crisis” is instructive. Prices of financial assets in many emerging market (EM) economies swooned in 1997 and 1998 as a series of financial and economic crises engulfed the developing world. Yet, the Fed left it target for the fed funds rate unchanged during most of that period (top chart). Only when the failure of Long-Term Capital Management threatened the U.S. financial system did Fed policymakers act, cutting the fed funds rate by a cumulative 75 bps in the autumn of 1998.
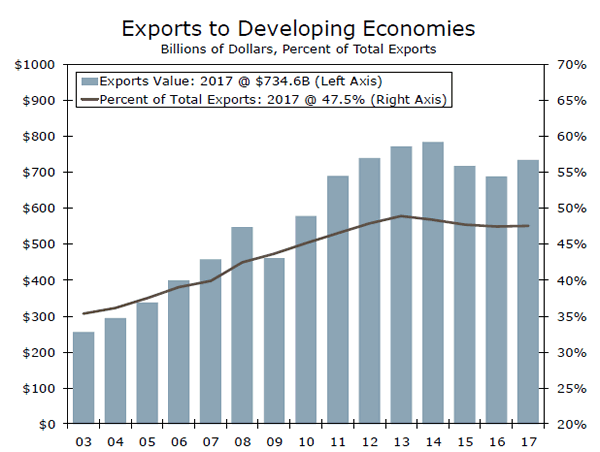
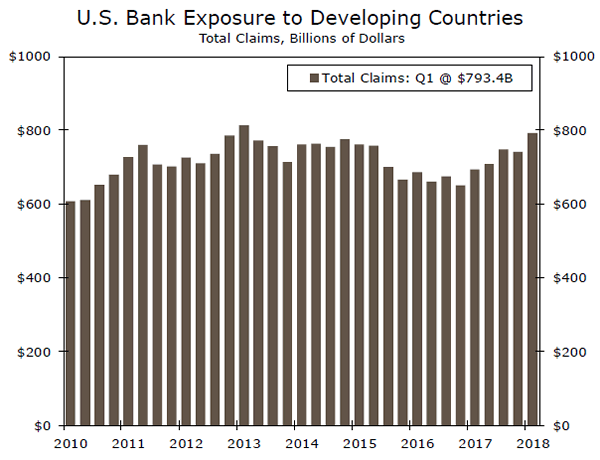
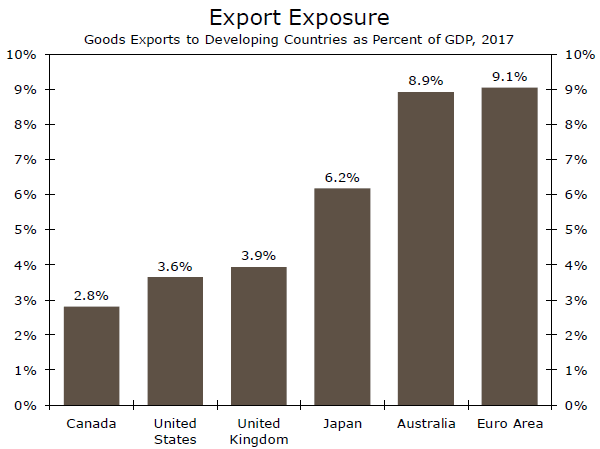
As we pointed out in a report this week, the financial and economic exposure of the United States to EM economies is limited. (See “How Exposed Is the U.S. Economy to EM Economies?” which is posted on our website.) American exports of goods to all EM economies totaled about $700 billion last year (middle chart), which is equivalent to only 4 percent of U.S. GDP. So American exports to the developing world would need to collapse to have a meaningful effect on U.S. GDP growth. In that regard, the value of U.S. exports to EM economies fell by only 4 percent between 1998, the worst year of the crisis, and 1999. American banks have nearly $800 billion worth of exposure to developing economies (bottom chart), but that amount represents only 5 percent of their total financial assets. The bottom line is that the weakness in EM financial markets today would need to become much worse to prevent the Fed from tightening further later this year.
Credit Market Insights
Household Debt Continues Its Rise
The New York Fed’s Quarterly Report on Household Debt and Credit, released this week, revealed that total household debt rose for the 16th consecutive quarter. Debt outstanding rose a modest 0.6 percent in Q2 to $13.3 trillion, or roughly 65 percent of GDP, and is now 19 percent higher than the post-recession trough reached in Q2-2013.
Despite Fed policy normalization driving interest rates higher across the economy, the health of household credit appears to remain strong. The aggregate delinquency rate improved slightly to 4.5 percent, as Fed officials cited an improved labor market and income repayment plans in particular as drivers of the improvement in the student loan delinquency rate. Notably, the proportion of consumers with a collection account has plummeted 23 percent over the past three quarters. However, this was largely anticipated and reflects changes to reporting standards enacted under the National Consumer Assistance Plan. That said, eight million fewer individuals now have a collection account on their credit report. Of those, the majority had low credit scores to begin with and 18 percent saw their credit scores rise 30 points or more.
Methodology changes aside, household debt’s steady climb indicates consumers have thus far been largely undeterred by rising interest rates. We expect the Fed to hike again in September and December and will continue to monitor monetary tightening’s effects on the consumer.
Topic of the Week
Emerging Market Contagion Risks
Turkish assets have been hammered in the past two weeks, due largely to concerns about the amount of Turkey’s foreign currency-denominated debt. This situation has raised questions about parallels to the emerging market (EM) financial crises of 1997-1998, which started in Thailand and spread through much of East Asia. Are other EM economies vulnerable to an external debt crisis à la Turkey?
To answer this question, we start by looking at the external debt loads of EM economies. In our sample of 19 large developing countries (excluding China), the external debt-to-GDP ratio is 37 percent, higher than in 1997. These countries collectively owe more than $5.0 trillion in external debt, a significant sum.
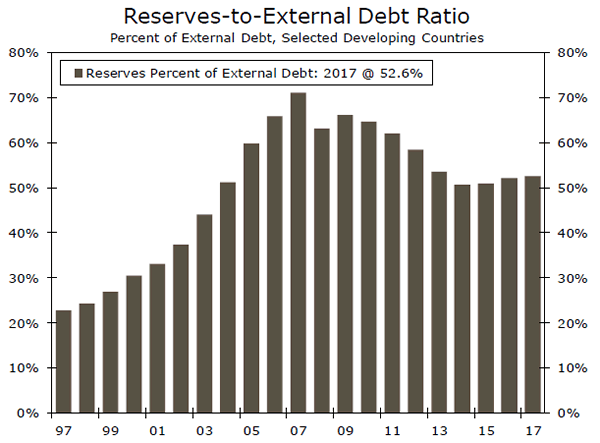
However, many developing countries are better equipped to deal with external debt loads than they were 20 years ago. Most developing countries now allow their currencies to float, which means that central banks can let currencies adjust gradually downward in response to financial stress. This contrasts with the 1997-1998 period, where EM central banks in countries with fixed exchange rates were forced to drastically hike interest rates to defend their currencies. Furthermore, EM economies have lower external debt service-to-export ratios than 20 years ago, meaning better ability to service their debt (top chart). Larger war chests of foreign exchange reserves can also help developing countries counter some of the downward pressure on their currencies.
Based on these considerations, we think that any Turkeylike financial crises would be country-specific rather than systematic as in 1997-1998. Even if we are proved wrong on this front, we are not overly concerned about the exposure of advanced economies, including the United States. Exports to developing countries make up a relatively small share of GDP in major economies (bottom chart). The exposure of the banking systems is also relatively small as a share of financial assets.


