Sample Category Title
UK’s Manufacturing PMI Falls To A Three-Month Low In July
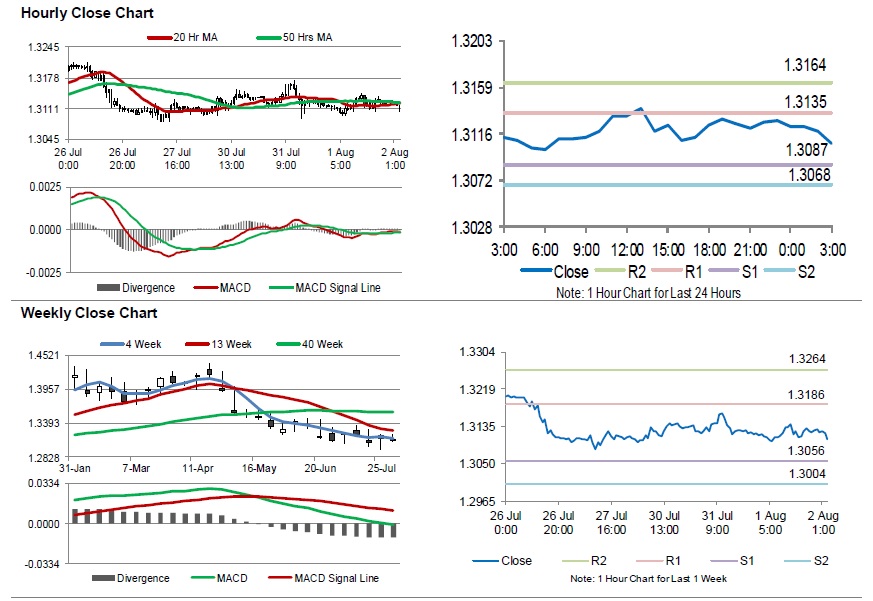
For the 24 hours to 23:00 GMT, the GBP rose 0.08% against the USD and closed at 1.3128.
Data showed that, UK's Markit manufacturing PMI eased to a level of 54.0 in July, hitting its lowest level in 3 months and more than market expectations for a decline to a level of 54.2. The PMI had registered a revised reading of 54.3 in the prior month. Meanwhile, seasonally adjusted Nationwide house prices advanced 0.6% on a monthly basis in July, compared to a rise of 0.5% in the previous month. Markets participants had anticipated the prices to rise 0.1%.
In the Asian session, at GMT0300, the pair is trading at 1.3107, with the GBP trading 0.16% lower against the USD from yesterday's close.
The pair is expected to find support at 1.3087, and a fall through could take it to the next support level of 1.3068. The pair is expected to find its first resistance at 1.3135, and a rise through could take it to the next resistance level of 1.3164.
Looking ahead, traders will await the Bank of England's interest rate decision and inflation report for further direction. Moreover, UK's construction PMI for July, scheduled to release in few hours, will keep investors on their toes.
The currency pair is showing convergence with its 20 Hr and 50 Hr moving averages.
Japanese Yen Trading A Tad Lower In The Asian Session
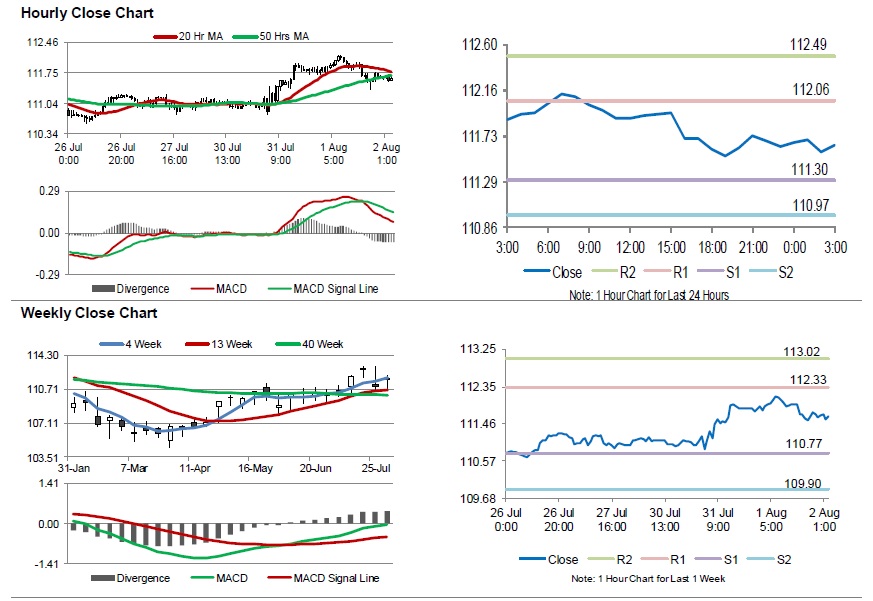
For the 24 hours to 23:00 GMT, the USD declined 0.11% against the JPY and closed at 111.63.
In the Asian session, at GMT0300, the pair is trading at 111.64, with the USD trading slightly higher against the JPY from yesterday’s close.
The pair is expected to find support at 111.30, and a fall through could take it to the next support level of 110.97. The pair is expected to find its first resistance at 112.06, and a rise through could take it to the next resistance level of 112.49.
Moving ahead, investors will keep an eye on Japan’s Nikkei services PMI for July and the Bank of Japan’s June policy meeting minutes, slated to release overnight.
The currency pair is trading below its 20 Hr moving average and showing convergence with its 50 Hr moving average.
Swiss Franc Extends Its Losses In The Morning Session
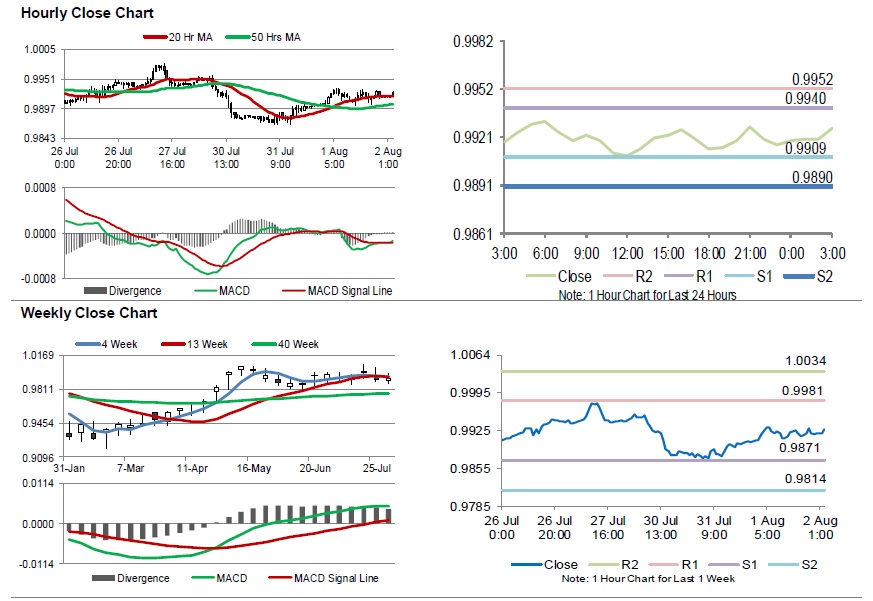
For the 24 hours to 23:00 GMT, the USD rose 0.14% against the CHF and closed at 0.9917.
In the Asian session, at GMT0300, the pair is trading at 0.9927, with the USD trading 0.10% higher against the CHF from yesterday’s close.
The pair is expected to find support at 0.9909, and a fall through could take it to the next support level of 0.9890. The pair is expected to find its first resistance at 0.9940, and a rise through could take it to the next resistance level of 0.9952.
Trading trend in the Swiss franc will be determined by the release of Switzerland’s consumer confidence and manufacturing PMI, both for July along with real retail sales for June, set to release in a while.
The currency pair is showing convergence with its 20 Hr moving average and trading above its 50 Hr moving average.
Loonie Trading Lower In The Morning Session
For the 24 hours to 23:00 GMT, the USD declined 0.18% against the CAD and closed at 1.2997.
The Canadian dollar strengthened against the US dollar, after the US Federal Reserve left interest rates on hold and amid optimism over NAFTA trade pact.
Data indicated that Canada’s manufacturing PMI fell slightly to a level of 56.9 in July, compared to a reading of 57.1 in the previous month. Separately, the nation’s leading indicator rose 0.2% on monthly basis in June, compared to a fall of 0.1% in the prior month.
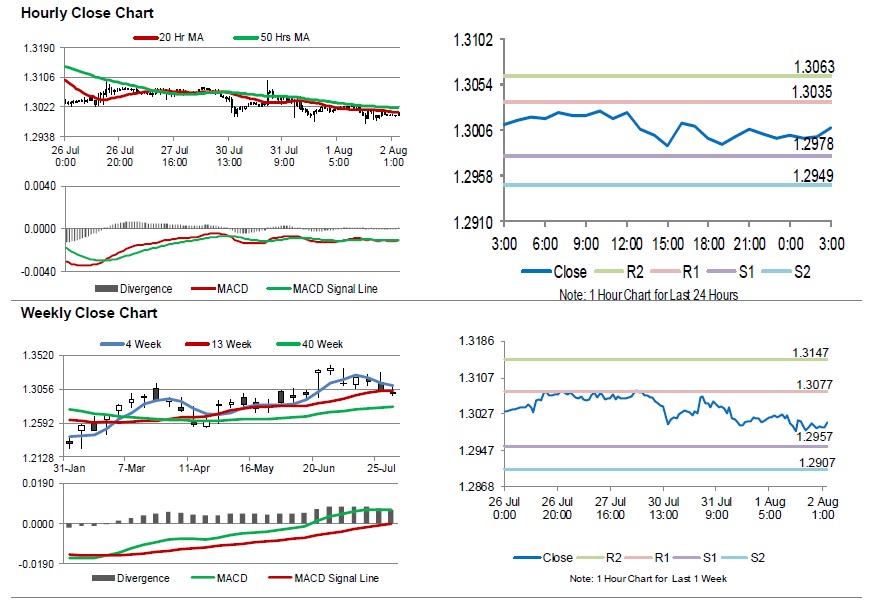
In the Asian session, at GMT0300, the pair is trading at 1.3008, with the USD trading 0.08% higher against the CAD from yesterday’s close.
The pair is expected to find support at 1.2978, and a fall through could take it to the next support level of 1.2949. The pair is expected to find its first resistance at 1.3035, and a rise through could take it to the next resistance level of 1.3063.
In absence of key economic releases in Canada today, traders would keep an eye on global macroeconomic releases for further direction.
The currency pair is showing convergence with its 20 Hr moving average and trading below its 50 Hr moving average.
Australia’s Trade Surplus Expanded Beyond Forecast In June
For the 24 hours to 23:00 GMT, the AUD declined 0.13% against the USD and closed at 0.7406.
LME Copper prices declined 1.2% or $76.0/MT to $6137.0/MT. Aluminium prices declined 1.2% or $25.0/MT to $2036.0/MT.
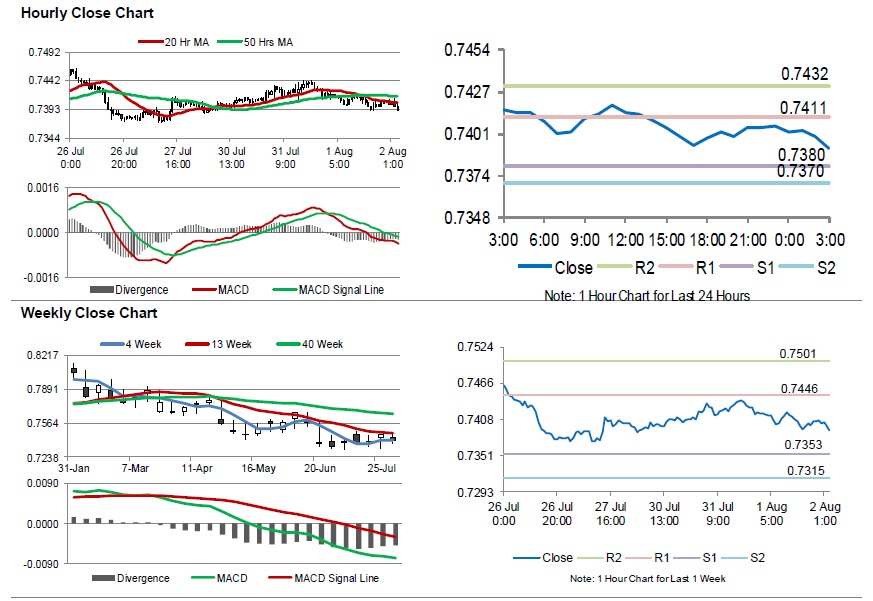
In the Asian session, at GMT0300, the pair is trading at 0.7391, with the AUD trading 0.20% lower against the USD from yesterday's close.
Overnight data showed that Australia's seasonally adjusted trade surplus widened more than expected to A$1873.0 million in June, amid surge in exports and imports and following a revised surplus of A$725.0 million. Market participants had anticipated the nation to post a trade surplus of A$900.0 million.
The pair is expected to find support at 0.7380, and a fall through could take it to the next support level of 0.7370. The pair is expected to find its first resistance at 0.7411, and a rise through could take it to the next resistance level of 0.7432.
Going ahead, trades will look forward to Australia's AiG performance of services index and CBA services PMI, both for July, due to be released overnight.
The currency pair is showing convergence with its 20 Hr moving average and trading below its 50 Hr moving average.
Gold: Yellow Metal Trading On A Stronger Footing In The Morning Session
For the 24 hours to 23:00 GMT, Gold declined 0.60% against the USD and closed at USD1225.50 per ounce.
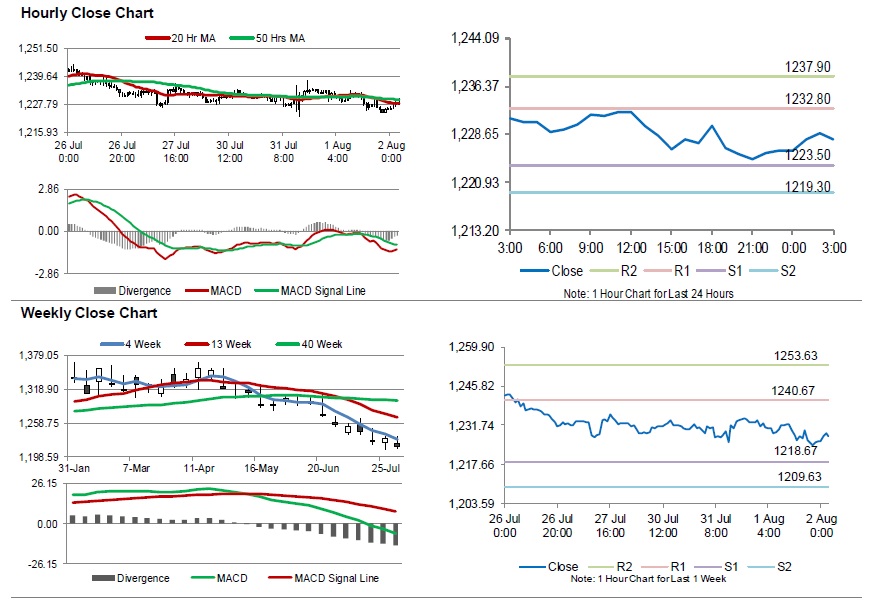
In the Asian session, at GMT0300, the pair is trading at 1227.70, with gold trading 0.18% higher against the USD from yesterday’s close.
The pair is expected to find support at 1223.50, and a fall through could take it to the next support level of 1219.30. The pair is expected to find its first resistance at 1232.80, and a rise through could take it to the next resistance level of 1237.90.
The yellow metal is showing convergence with its 20 Hr and 50 Hr moving averages.
Silver: White Metal Trading A Tad Higher In The Asian Session
For the 24 hours to 23:00 GMT, Silver declined 0.71% against the USD and closed at USD15.43 per ounce.
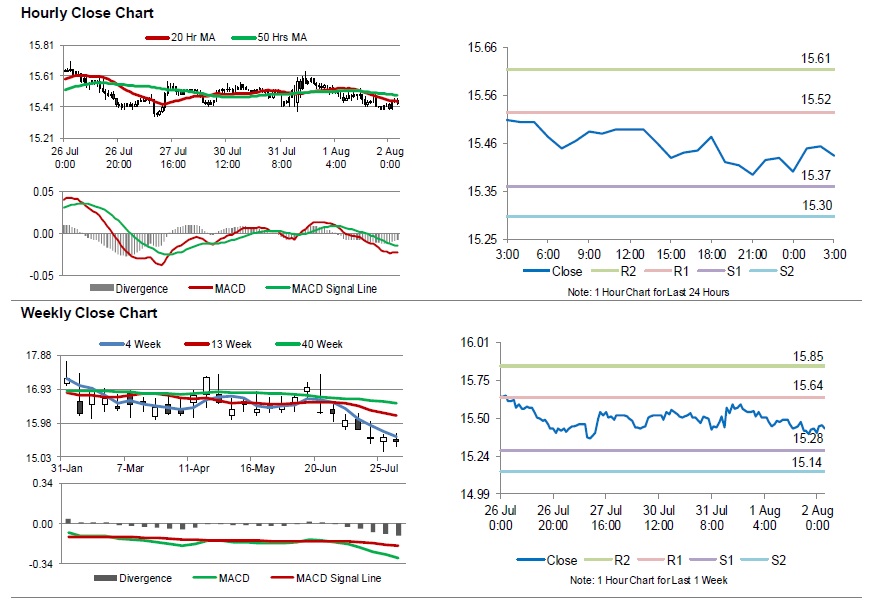
In the Asian session, at GMT0300, the pair is trading at 15.43, with silver trading marginally higher against the USD from yesterday’s close.
The pair is expected to find support at 15.36, and a fall through could take it to the next support level of 15.30. The pair is expected to find its first resistance at 15.52, and a rise through could take it to the next resistance level of 15.61.
The white metal is showing convergence with its 20 Hr moving average and trading below its 50 Hr moving average.
Crude Oil: Oil Reverses Its Losses In The Asian Session
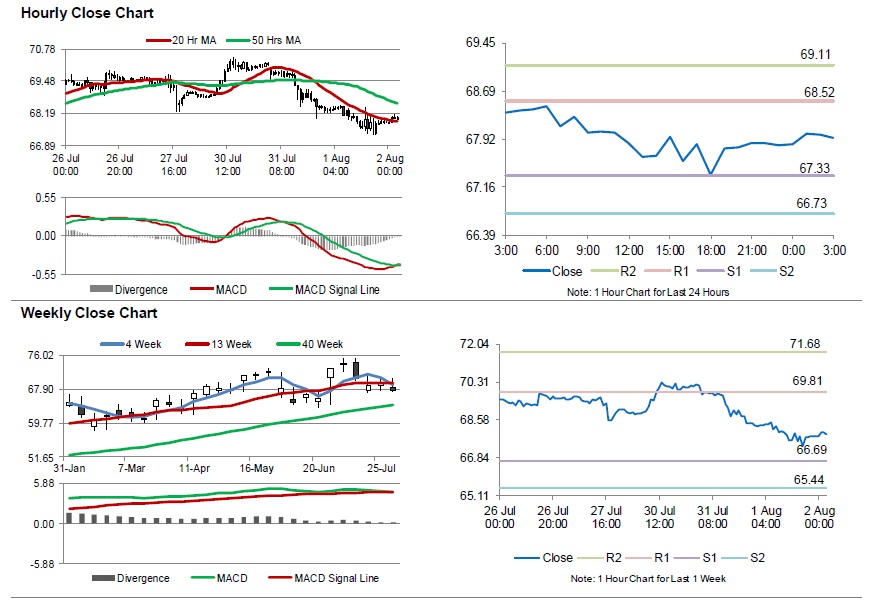
For the 24 hours to 23:00 GMT, Crude Oil declined 0.86% against the USD and closed at USD67.83 per barrel, after the Energy Information Administration (EIA) report indicated that US crude oil stockpiles advanced by 3.8 million barrels to 408.7 million in the week ended 27 July 2018.
In the Asian session, at GMT0300, the pair is trading at 67.94, with oil trading 0.16% higher against the USD from yesterday’s close.
The pair is expected to find support at 67.33, and a fall through could take it to the next support level of 66.73. The pair is expected to find its first resistance at 68.52, and a rise through could take it to the next resistance level of 69.11.
Crude oil is showing convergence with its 20 Hr moving average and trading below its 50 Hr moving average.
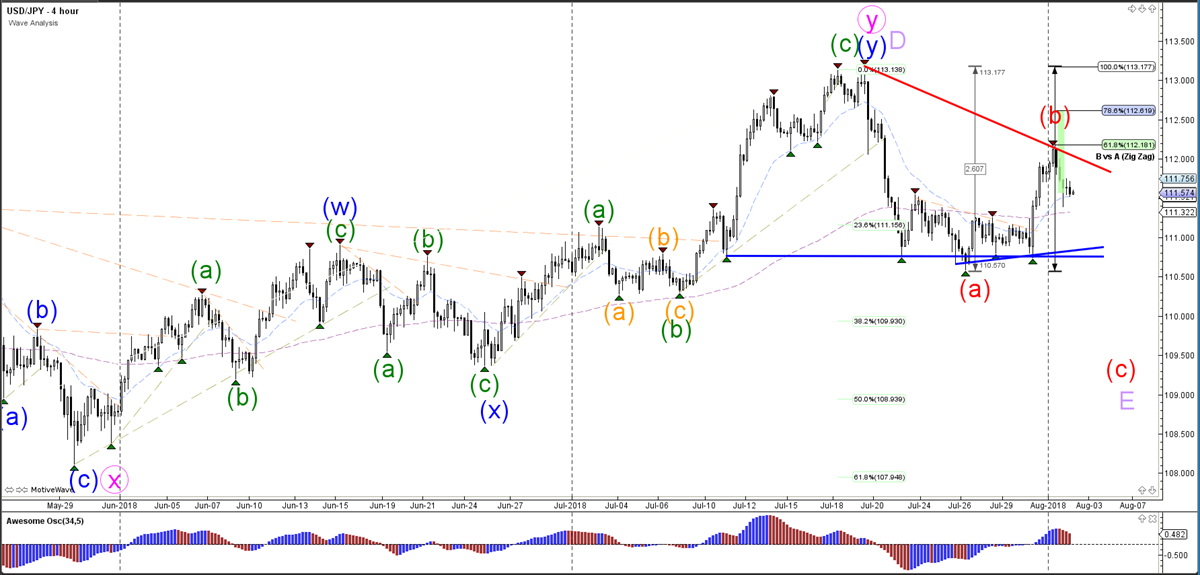
USD/JPY Bearish Reversal At 61.8% Fibonacci Resistance
The USD/JPY turned at the 61.8% Fibonacci retracement and resistance level of wave B (red) vs A. The bearish bounce could be part of a larger ABC (red) zigzag pattern within a larger wave E (purple) triangle on the daily chart. A break above the 100% Fib level however would invalidate the ABC pattern whereas a break below support (blue) could confirm it.
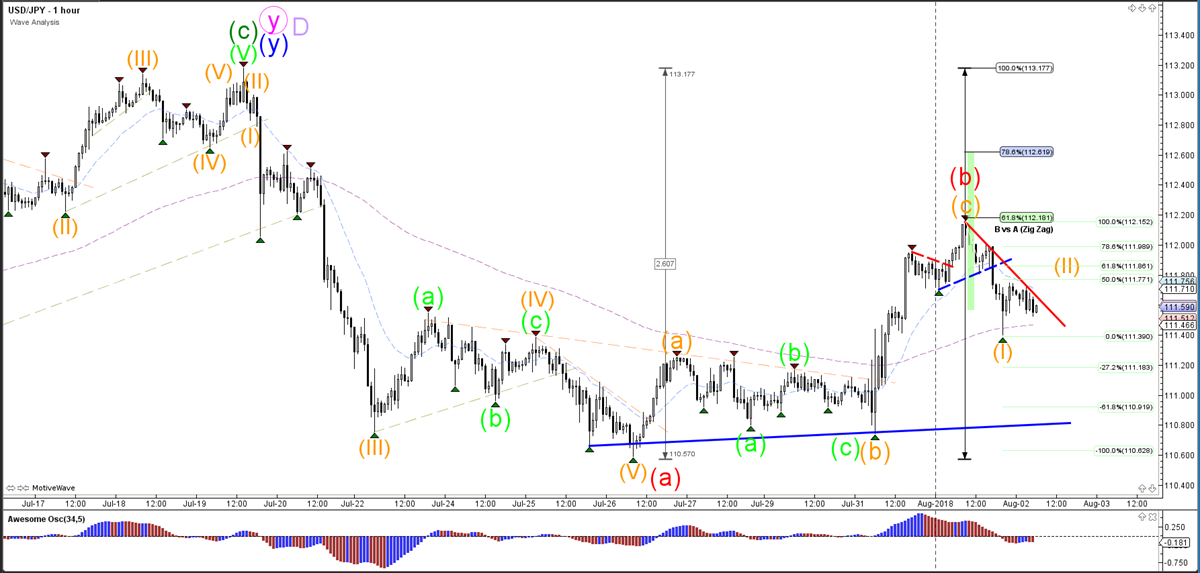
The USD/JPY seems to have completed 5 bullish waves within the impulsive wave C (orange) if price manages to stay below the Fib levels of wave 1 vs 2 (orange). A break above the resistance trend line (red) could indicate a larger correction within wave 2 (orange) as long as price stays below the 100% Fib.
GBPUSD Bearish Breakout Likely But GBP Rate Remains Critical
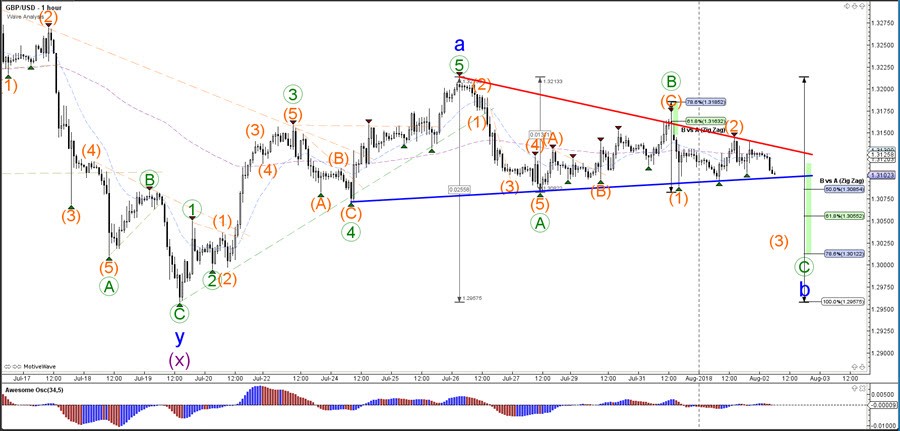
The GBP/USD is building a triangle chart pattern close to the top of the downtrend channel. A bearish breakout seems likely. Keep in mind though that the GBP is awaiting red tagged news event later today such as an interest rate announcement, which could send price in both directions and create strong volatility.
The GBP/USD remains in a bearish channel and the wave patterns indicate that a bearish breakout would be part of a larger ABC (blue) zigzag pattern. If the GU does break support but with strong momentum, then there is a chance that price might be in a wave B (blue) but in a new downtrend.
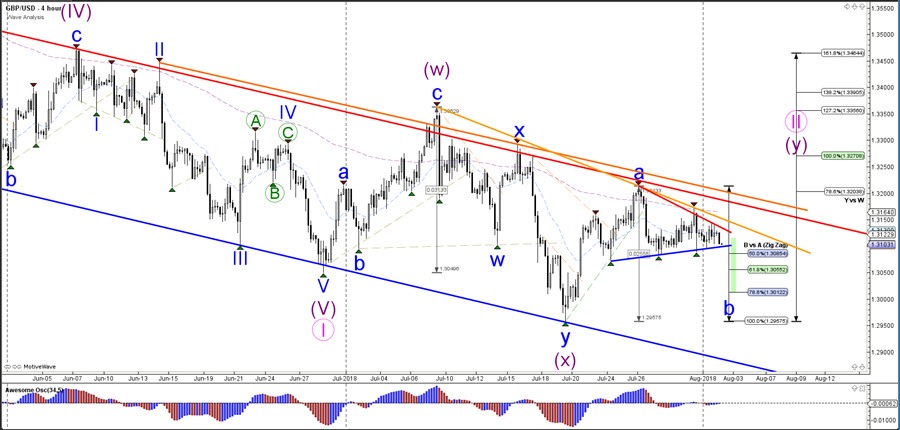
The GBP/USD has moved sideways yesterday and stayed between the support (blue) and resistance (red) trend line, which are indicating the contracting triangle chart pattern. A bearish break would indicate a potential wave 3 (orange) of wave C (green) of wave B (blue) unless price breaks below the 100% Fib of wave B vs A. A bullish break however could indicate the immediate completion of wave B (blue) and start of wave C (blue).