Sample Category Title
Dollar Inches Up As Fed Takes Center Stage
Here are the latest developments in global markets:
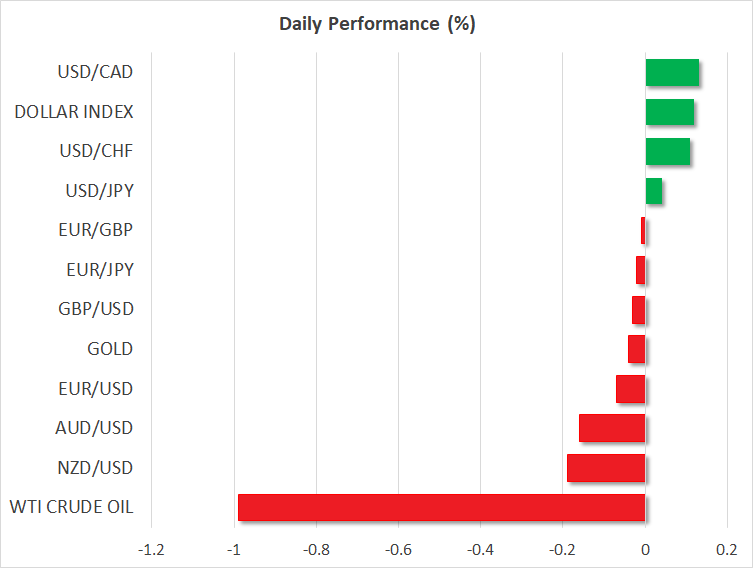
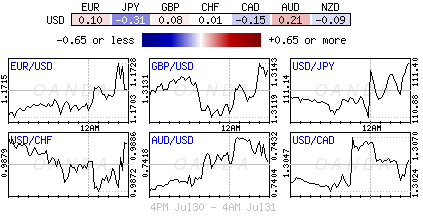
FOREX: The US dollar continued the bullish movement today against the Japanese yen (+0.05%), near 112.00, while tariffs returned to the spotlight as the US and China were reportedly seeking to resume talks to find common ground on trade. The main event of the day will be the FOMC monetary policy decision later in the day. In the Eurozone, the final IHS Markit manufacturing PMI posted a reading of 55.1 in July, unchanged from the flash estimate, while the German manufacturing PMI came in at 56.9 in July, slightly below a preliminary reading of 57.3. Euro/dollar slipped by 0.06% after the data, falling below the 1.1700 handle. Pound/dollar declined by 0.05% after the UK’s IHS Markit manufacturing PMI fell to a 3-month low of 54.0 in July from a downwardly revised 54.3 in the previous month, and below market expectations of 54.2. Meanwhile, sterling awaits the Bank of England’s rate hike tomorrow, which is almost fully priced in. In the antipodean sphere, aussie/dollar and kiwi/dollar moved lower by 0.23% on a report that the US administration will propose raising its planned tariffs on $200 billion Chinese imports to 25%, from the 10% rumored previously. Dollar/loonie pared some of its previous days’ losses, gaining 0.12%.
STOCKS: Major European benchmarks traded lower for the most part. The pan-European STOXX 600 and the blue-chip Euro STOXX 50 dropped by 0.28% and 0.17% respectively. The German DAX 30 slipped by 0.26%, while the Italian FTSE MIB declined by 0.31%. UK’s FTSE saw a stronger loss of 1.00% and the French CAC 40 declined by 0.05%. In Asia, equities were mixed, while in the US, futures tracking stock indices were pointing to a negative open.
COMMODITIES: Oil prices plummeted on Thursday on the back of a stronger dollar and signs of US-China trade tensions. WTI crude oil tumbled by 1.03% and fell near the $68 level, while Brent plunged by 1.02% to $73.45. In precious metals, gold prices fell by 0.08%, flirting with the $1,222 level.
Day ahead: Fed meeting front and center; trade tensions in the spotlight too
The main event today will be the Fed policy decision at 1800 GMT. No change in interest rates is expected, and since this is one of the “smaller” meetings that do not include updated economic forecasts or a press conference, markets will focus solely on any tweaks in the phrasing of the accompanying statement. Considering the strength of the US economy in Q2 – with the preliminary GDP estimate coming in at a 4.1% annualized pace – and that inflation as measured by the core PCE index is just shy of the Fed’s 2% target, a broadly hawkish message appears to be in store.
At the time of writing, markets have fully factored in another 25bps rate hike before the end of the year, while they also assign a 69% probability for a second one, Fed funds futures suggest. Should an upbeat statement push the market-implied probability for a second hike higher, the dollar could benefit. The key risk to this view would be some mention to trade tensions posing downside risks to business investment and the broader economy, though this seems quite unlikely to be included in the statement.
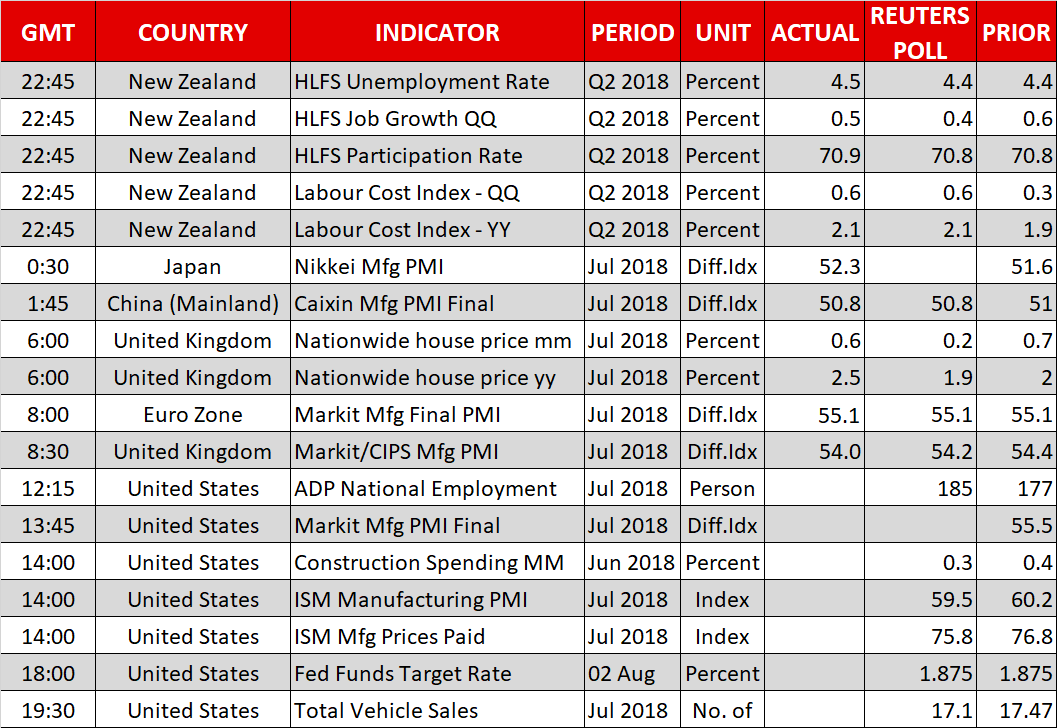
A few hours before the Fed, two key US data points for July could impact price action in the dollar: the ADP employment report at 1215 GMT and the ISM manufacturing PMI at 1400 GMT. The ADP is forecast to show that the private sector added 185k jobs, more than the 177k in June. The ISM print, meanwhile, is projected to decline to 59.5 from 60.2 previously. While this would signal a slowdown in the sector, the index is still expected to remain at a very healthy level, consistent with strong expansion – anything above 50 indicates growth.
Turning to trade, recent reports suggest the US is considering imposing “heavier” tariffs on China to ramp up the pressure. Specifically, the 10% tariffs on $200bn worth of Chinese imports may be raised to 25%. Reportedly, such an announcement could come as soon as today, and if so, it is likely to be viewed as a fresh escalation in tensions, potentially weighing on risk sentiment and risk-sensitive assets – like stocks.
In energy markets, the weekly EIA crude inventory data at 1430 GMT are likely to attract attention. Stockpiles are anticipated to fall by 2.8mn barrels, after declining by 6.15mn in the previous week.
In equities, Tesla will be among the companies releasing quarterly earnings results after the US market close today.
Trade War Angst Trumps Fed Rate Decision
Wednesday Aug 1: Five things the markets are talking about
Over the past fortnight, fixed income, forex and the commodities market have become rather boring and range bound. Will today's Fed monetary policy announcement be the facilitator to end this market consolidation?
Futures prices would suggest rather strongly that, nope, there is nothing new to be seen this afternoon. It's what you would call a “continuity” meeting, with little fanfare and maybe, but unlikely, a comment on trade tensions.
Capital markets may have to wait until Friday's non-farm payroll (NFP) for some action, but that could even be a stretch as market participants historically head for the hills for holidays. Only liquidity tends to be a real concern this time of year. U.S payrolls are predicted to show a healthy labor market, with +190K new jobs.
Dominating today's U.S central bank meet is conflicting signs over the state of the Sino-U.S trade relations. It's again pulling markets in different directions on rumours that the Trump administration is expected to announce this morning plans to propose tariffs of +25% instead of the initially proposed +10% on +$200B of imported Chinese goods.
Both equities and commodities are struggling on these headwinds to trade after China threatened to hit back if the U.S hikes tariffs. The dollar has found some traction, while JGB's lead sovereign debt lower.
1. Stocks mixed reaction
In Japan, the Nikkei rallied overnight to trade atop its two-week high, supported by strong earnings for blue chips such as Sony and Sharp and the yen's slide (¥112.02) to a 10-day low outright. The Nikkei ended the day up +0.86%, it's highest since July 20, while the broader Topix closed out +0.94% higher.
Down-under, in a muted session, Aussie stocks finished slightly lower as the heavily weighted banks weighed. A late retreat left the S&P/ASX 200 settle down -0.07% after Tuesday's +0.03% gain. In S. Korea, the Kospi index edged up +0.51% overnight while the market awaits the outcome today's Fed meeting, despite fears of an escalation in U.S-China tariff war.
In China, stock selling accelerated, leaving the market a noted regional underperformer earlier today. After posting its best month since January with a +1% gain, the Shanghai Composite slid -1.8% to log its worst day in three-weeks, while the Shenzhen Composite fell -1.7%. Weighing again were vaccine makers and as the Sino-U.S trade war looked set to escalate with the threat of higher U.S tariffs.
In Hong Kong, shares ended lower also, dragged by property developers, and as weak data and an escalating trade war dimmed the outlook for growth in the mainland. At close of trade, the Hang Seng index was down -0.85%, while the China Enterprises Index lost -0.5%.
In Europe, regional bourses trade mixed in a range bound trade with the FTSE 100 an outlier trading over -0.6% lower, weighed down by mining names.
U.S stocks are set to open little changed.
Indices: Stoxx600 -0.2% at 390.8, FTSE -0.8% at 7681 DAX -0.1% at 1278, CAC-40 +0.1% at 5518, IBEX-35 -0.3% at 9840, FTSE MIB -0.5% at 22101, SMI Closed, S&P 500 Futures flat
2. Oil under pressure on U.S inventories, OPEC supply, gold lower
Oil prices have slipped again this morning pressured by a market report yesterday that U.S stockpiles of crude rose unexpectedly and by higher OPEC production, adding to indications of abundant supply.
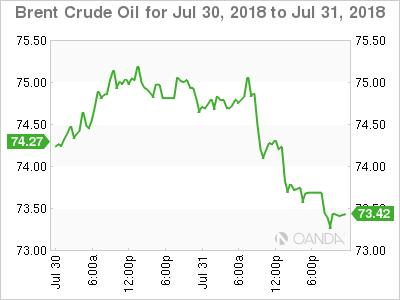
Brent crude prices fell -85c to +$73.36 a barrel, while U.S crude is down -73c at +$68.03.
Note: Last month, Brent fell more than -6% and U.S crude slumped about -7%, the biggest monthly declines for both benchmarks in 24-months.
Yesterday, the American Petroleum Institute (API) said crude inventories rose by +5.6M barrels last week. The market was expecting a decrease of -2.8M.
Expect dealers to take their cues from today's EIA report at 10:30 am EDT.
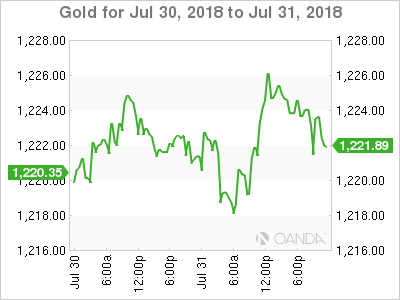
Ahead of the U.S open, gold prices are lower, pressured by a stronger U.S dollar on rising trade war fears and ahead of today's Fed rate announcement. Spot gold is down -0.2% at +$1,220.77 an ounce. The yellow gained slightly on Tuesday on a weaker USD/CNH after a report that the U.S and China were trying to restart negotiations to defuse a potential trade war. U.S gold futures are -0.3% lower at +$1,220.10 an ounce.
3. Sovereign yields look to back up
Fed fund futures are currently pricing in an 80% chance of a rate hike in September and a “hawkish” FOMC statement that echoes the optimism of Fed Chair Powell will leave the market convinced that there will be at least one and possibly even two more rounds of tightening this year – December is the final candidate.
Today's Fed statement will most likely highlight the underlying strength of the economy and the uptick in inflation and a ‘hawkish' Fed should also raise the markets hopes that Friday's non-farm payroll (NFP) report will be strong with wage growth rising and the unemployment rate falling.
Elsewhere, Japan's benchmark 10-year JGB yield has backed up to +0.131%, an 18-month high as the fixed income dealers test the BoJ's resolve after the central bank said it will allow for greater flexibility in yield moves.
Earlier this morning, the Reserve Bank of India (RBI) raised its repurchase rate by +25 bps to +6.50% as expected and leaves its cash reserve ratio (CRR) at +4%. The decision was not unanimous – 5:1 vote. Tomorrow, in the U.K, Governor Carney is expected to hike interest rates by +25 bps despite ongoing Brexit worries.
4. Will the Fed impact the dollar?
Today's Fed rate announcement is not expected to have a material impact on the USD outright. No rate rise is expected until September (odds of +80% already baked in) as domestic U.S data has not changed much since the forecast update at the June meeting.
For the Fed, its challenge going forward is communication – how will Powell and company move away from regular rate rises without their actions being interpreted as a sign of a weaker growth outlook?
The Fed has been raising rates every three-months, but with rates currently between +1.75% and +2.0%, they are encroaching on the “neutral” rate of +3% quickly.
Note: There is no press conference today, maybe it will be explained away next month.
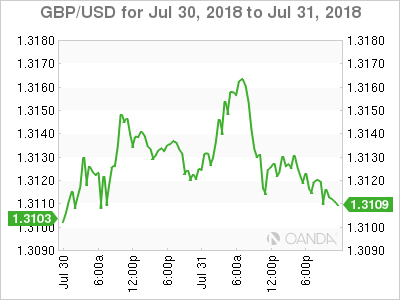
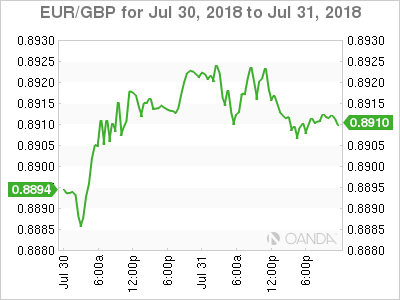
Elsewhere, summer holidays are kicking in and that leads to ranges consolidating, something we have been witnessing over the past fortnight. EUR (€1.1679) CHF ($0.9920) and GBP (£1.3113) are little changed outright and today's FOMC decision is seen as unlikely to buckle the trend.
However, USD/JPY (¥112.00) continues to move higher, supporting the “carry-trade” after Tuesday's BoJ rate decisions and the bank's pledge to keep interest rates “extremely low” for an extended time.
5. U.K manufacturing starts Q3 on softer footing
Data this morning from Markit showed that U.K Manufacturing PMI were at a three-month low in July. There were weaker increases in both output and new orders and intermediate goods production falls for first time in two- years. Price pressures also remained elevated as a strong increase in average input costs led to the steepest rise in selling prices in four-months.
The seasonally adjusted IHS Markit/CIPS PMI fell to 54.0 in July, down from 54.3 in June and well below the highs achieved around Dec/Jan of this year. The PMI remains comfortably above its long-run average of 51.8.
Last month saw the weakest rate of expansion in U.K manufacturing output in 16-months, as production growth was hindered by an easing in the pace of increase in new orders.
Digging deeper, the domestic market was the main focus of the slowdown in new business growth, as new export work increased at the fastest pace for six months.
Copper Outlook – Renewed Trade Concerns Increase Pressure On Metal’s Price
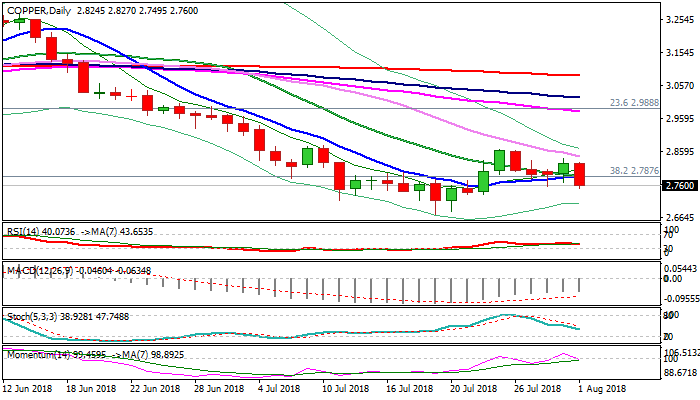
Copper started trading in August in red and was down 2.4% in early trading on Wednesday, pressured by renewed trade war fears.
The metal extends broader weakness, as past two months ended in red with monthly losses of 4.85% (July) and 3.2% (June).
Completion of failure swing pattern on daily chart warns of extension towards key near-term support at $2.6720 (19 July one-year low, break of which would spark further weakness for test of $2.6250 (weekly 200SMA / 50% of larger $1.9360/$3.3140 rally).
Weakening momentum and daily MA's turning to full bearish setup support the notion along with bearish fundamentals.
Converged 10/20SMA's ($2.7841) are expected to cap and maintain bearish bias.
Res: 2.7841, 2.8270, 2.8475, 2.8655
Sup: 2.7495, 2.7325, 2.7160, 2.6720
Fed Decision And US Labour Market In Focus
- US consumer data very healthy again in June;
- Will Fed consider faster balance sheet reduction?
- ADP number eyed ahead of Friday’s jobs report.
The US will once again be a focus for investors on Wednesday, as we await labour market data from ADP and the latest interest rate decision from the Federal Reserve.
This comes in a week in which we’ve already got some insight into US consumers, with income, spending and inflation figures on Tuesday looking very healthy. Inflation – as per the Fed’s preferred core PCE measure – was 1.9% in June, unchanged from a month earlier and almost in line with the central bank’s 2% target.
With the economy doing very well and inflation currently in check, despite the challenges posed by tax reforms, it would appear the central bank is doing a very good job in balancing its two mandates, price stability and maximum employment.
Moreover, it is doing this in a very clear and transparent way while lifting interest rates gradually back towards more sustainable levels and putting itself in a better position for when recession strikes again. At the same time, it is now gradually reducing its balance sheet which expanded aggressively as a result of its quantitative easing programs.
Faster reductions in the balance sheet could be one way in which the central bank continues to remove stimulus while not raising interest rates too fast in the event that the economy is overheating. This could be something it considers in the months ahead and maybe even reference at an upcoming meeting. It could also help resolve the flattening yield curve dilemma, with sales taking pressure off longer term yields.
At a time when there’s so little of substance to take away from Fed meetings – due to it being so clear and transparent – this is the next thing investors will be keen to hear about. Whether that comes now or at a later meeting we’ll have to wait and see. It could be a good alternative to faster hikes and kill two birds with one stone – balance sheet reduction and steepening on the yield curve – if done carefully and correctly.
The ADP non-farm employment reading is expected to show 185,000 jobs being added in July, which would represent another month of stellar growth in what is already a tight labour market with extremely low unemployment. It will also be of interest ahead of Friday’s official jobs report, with non-farm payrolls seen printing a similar number.
GBPUSD Bearish Headed Into The US Session
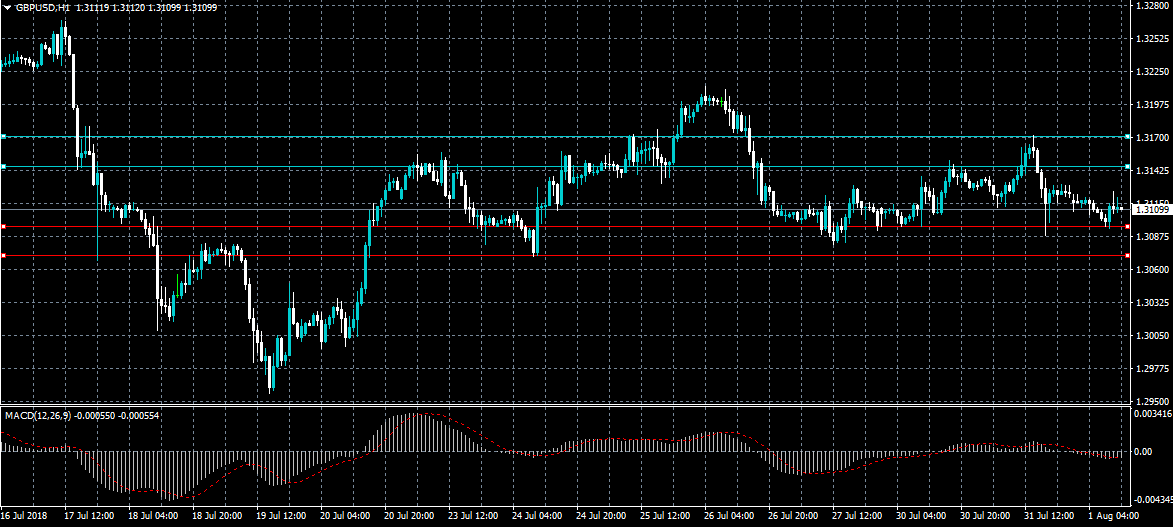
The British pound trades on the back-foot against the greenback heading into the US session, with price action depressed around the 1.3100 handle. Traders remain cautious ahead of two key central bank policy decisions, which will likely heavily affect the GBPUSD pair. The GBPUSD pair is also trading within a bearish head and shoulders pattern, with the breakout zone located around the 1.3070 level.
The GBPUSD pair is bearish while trading below the 1.3080 level, key support is found at the 1.3050 and 1.3030 levels.
If the GBPUSD pair trades above the 1.3151 level, buyers are likely to test towards the 1.3172 and 1.3205 resistance levels.
USDJPY Further Bullish Above 112.05
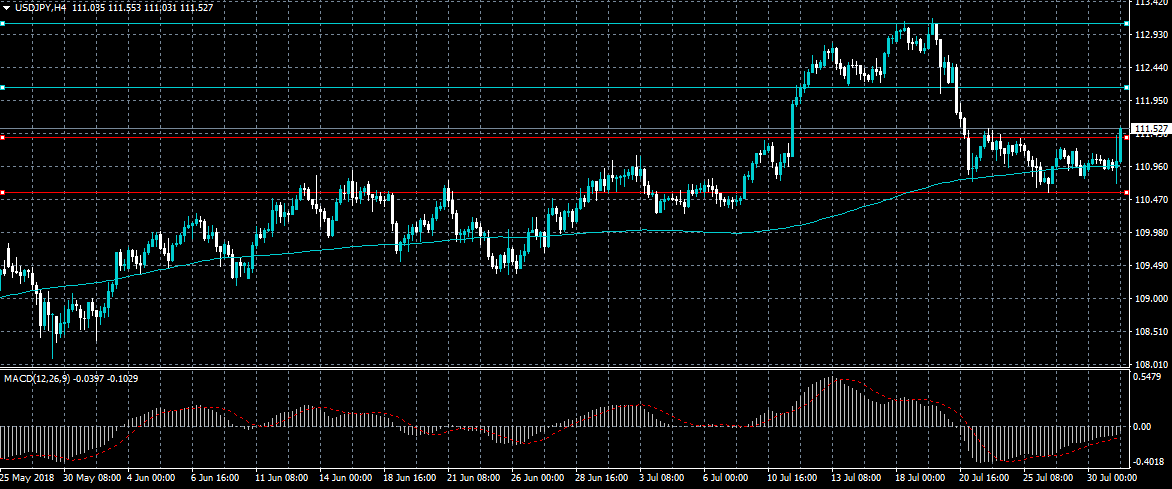
The US dollar continues to press higher against the Japanese yen, with the price now testing above the key 112.00 resistance level. The USDJPY pair is likely to advance even higher while trading above the 112.05 level, with key intraday support found at the 111.37 level. Traders remained focused on the outcome of today's monetary policy decision from the US Federal Open Market Committee.
The USDJPY pair is strongly intraday bullish while trading above the 112.05 level, key resistance is now found at the 112.50 and 112.90 levels.
If the USDJPY pair falls back below the 111.37 level, sellers will likely push price towards the 111.00 and 110.25 support levels.
Size DOES Matter… When Considering Risk and Strategy!
A phenomenon that a lot of traders notice – and you might have seen it yourself – is that when they increase the size of their trades, their strategy seems to stop working. For some, even just switching from their demo account to their live account, and using the exact same strategy, will lead to making mess money. This might lead a few of them to suspect that the system is rigged, or doesn’t work for people trading larger sums.
But, there are lots of successful traders, so… What’s really going on?
The trading headspace
As traders will constantly point out, psychology is an important factor in trading because we are not machines. Even when we are following signals given by math-based indicators, there is still a bit of human influence when we decide whether or not to enter a trade – and often, that level of human intuition is what makes the difference in trading. If making a decision as a person didn’t matter, then why don’t we just set up an algorithm to trade? Some people do that, but human traders still continue to outperform machines.
Having the right “headspace” when trading is, therefore, important to a trader. And this is especially relevant when considering risk – a vital component of successful trading that humans a much better adapted at.
Caution as an obstacle or a stepping stone
When we develop a strategy, we take into account the risk and then structure our trading style in a way that works in the longer term. That is, if we are successful traders, of course.
The thing is, humans in general calibrate our sense of risk level and adjust our sensitivity accordingly. In other words, we take more cautious approaches when we think the risk is bigger, and act more bold when there is less risk. It’s not the same to risk losing some pocket change as it is to bet your mortgage.
However, this risk sensitivity can have have an impact on our trading style, which leads to increased hesitation to take trades, or forgoing trades altogether. Or if we perceive less risk, then we are willing to take more opportunities.
This is one of the contributing factors to why a trading strategy you develop in a demo account, where there is relatively no risk, might work out great – except when you put real money behind it, it starts to fail.
It’s not the strategy
The issue isn’t that you have a bad strategy, but that you had a different risk sensitivity when you are testing in a demo account than when you are using money.
This phenomenon can repeat itself when you switch to larger trade sizes.
It’s not uncommon for people starting out to want to make money by taking on large trade sizes; but this can get in the way of their strategy succeeding, because they become hesitant in the face of the larger risk and change their style enough so they are no longer making a profit. For some traders, there might be a psychological level in trade size that they have to overcome before they can adjust their risk sensitivity.
Rather than jump in with both feet with a new strategy, sometimes it’s better to slowly build up your trade size over time as you get used to the risk level and keep trading with the same style. This also helps reduce trading stress: if you are stressed and anxious every time you start trading, it might mean your risk sensitivity isn’t calibrated correctly.
Should You Let Your Trades Stop Out?
When to exit your trade is actually something of a controversial subject. There are some traders who insist that stop losses are there to be used – you should let your trade stop out if it’s not going the right way. Other traders are just as adamant about preventing losses by stopping out early – they say you should, of course, have a stop loss, but it should only be there as a failsafe.
Who’s right
Both points of view have their strengths and weaknesses – and probably the reality is that which one is “right” has more to do with the trader’s style than with any objective measure of whether stopping a loss as soon as possible is better than giving it room to recover.
The market has fluctuations, and it’s expected to correct a bit before ultimately driving towards where you expect it to go. This is why you can’t place your stop loss at your entry point; you’d be stopped out immediately and would never get a profitable trade.
Figuring out where to place your stop loss is a bit of an art of its own; but if you do so properly, the stop loss is going to be just on the other side of where the market would correct to before going towards your take profit. This would mean you have the minimum potential for loss and the maximum of profit.
On the other hand, you can’t really know where the market is going and saying that you can precisely determine where the market will turn around is about as absurd as saying you know where the market will be; if you know the market will go that far, why didn’t you take the opposite trade? Since the closer we place the stop loss, the more of our trades will be stopped out, there is a real risk to your profitability by putting the stop losses too close.
Having a broader stop loss and tracking the market allows you to take action when you can clearly see the market is going the wrong way and minimize your losses. You can’t know for sure where the market will go, but if your strategy gives you the reverse signal, you can become highly suspicious of your initial signal and get out.
On the other hand, the constant monitoring might lead to trouble; it’s more stressful, and if you have to step aside for a bit – for example, you are trading for a longer time period than just during the day – the market might go farther than you would have put your stop loss.
Since having a stop loss as a failsafe requires much more monitoring, it’s really best reserved for day trading; traders who leave their trades open overnight, for example, might feel more comfortable having a closer stop loss. This is why day traders often are the ones arguing more for the side of having a broader stop loss; while long-term traders insist on closer stop losses.
Whichever side you side with, there is still an important bottom line: always use a stop loss. A few – very few – can get away without them; but for the overall safety of your trading account, you should put in a stop loss at the very least as a fail safe. Stop losses are an intrinsic part of money management. A closer stop loss means you are more likely to have trades stop out, reducing potential profitability; a longer stop loss means your trades are more likely to run their course, but the losing ones will be bigger.
Low level Chinese official warned US blackmail won’t have an effect
In response to news that Trump is considering to slap 25% tariffs on USD 200B in Chinese imports, China Foreign Ministry spokesman Geng Shuang warned that "US pressure and blackmail won't have an effect." And Geng added "China will inevitably take countermeasures and we will resolutely protect our legitimate rights."
It's kind of boring rhetoric. And firstly, it's said in a regular press briefing. Secondly, it's by a low level official only. There's no need to get too excited until we see exactly how China is going to retaliate.
CADJPY Unlocks 2-Month Highs, Could Be Overbought
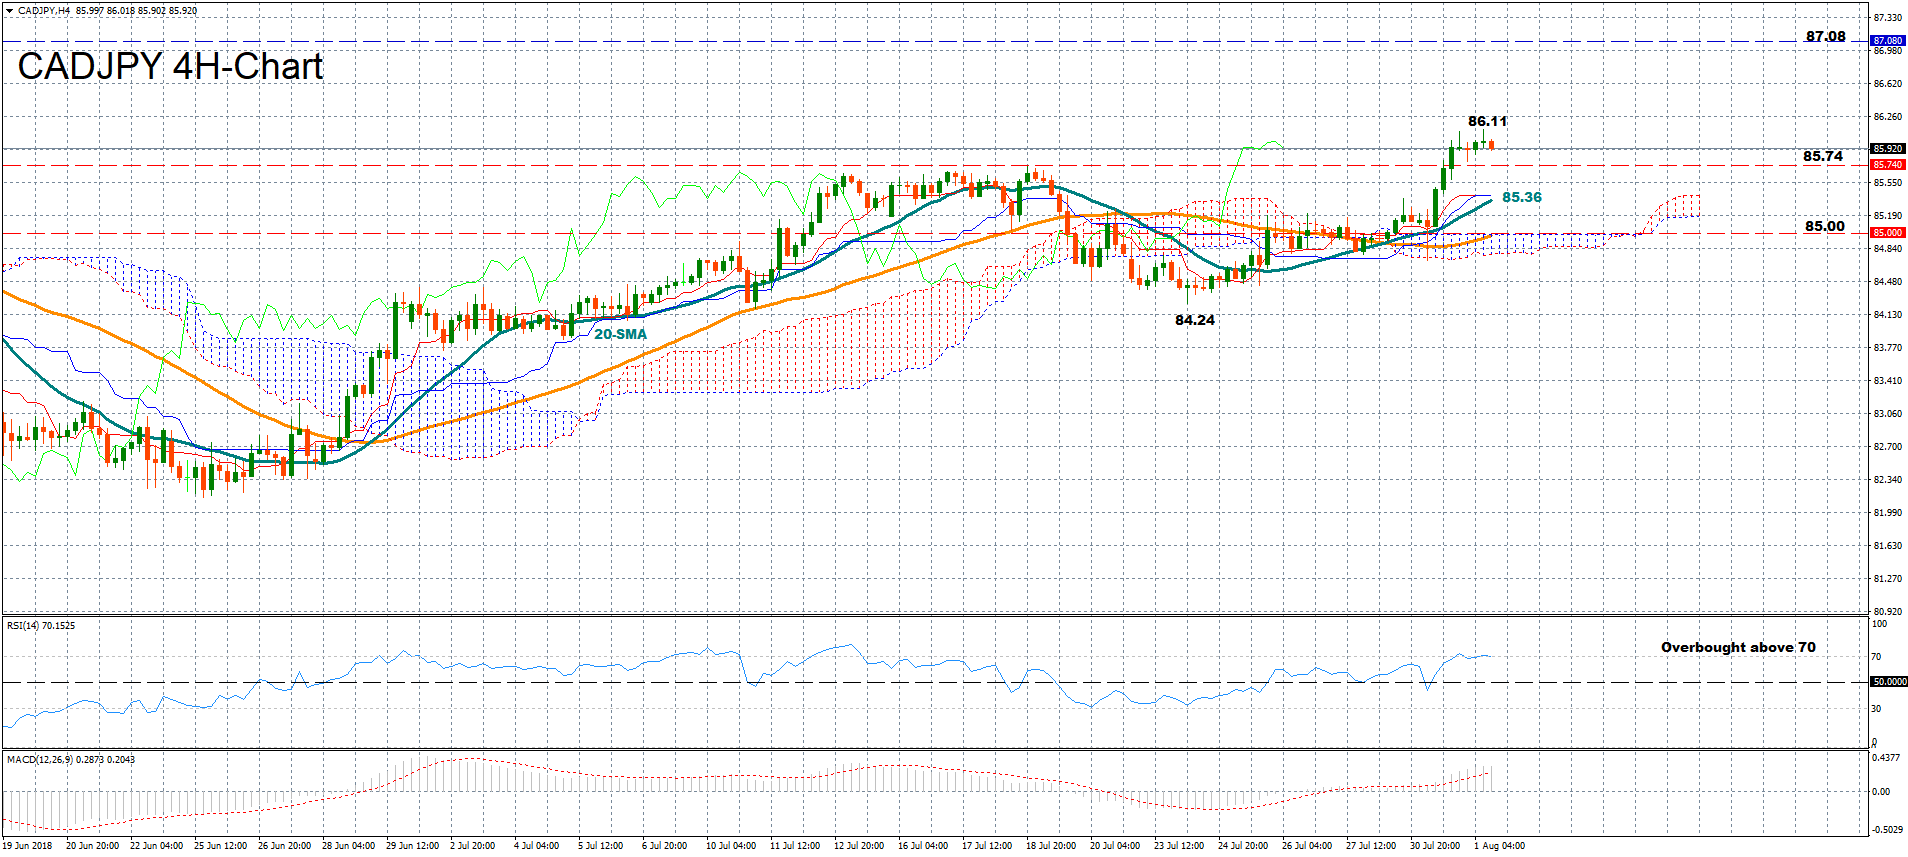
CADJPY is back in bullish mode in the four-hour chart as Tuesday’s rally helped the market to break the range-bound trading started in mid-July and peak at a two-month high of 86.11 early today. While the MACD suggests that the market could maintain bullish momentum in the short-term as the indicator continues to gain strength above its red signal line in positive territory, the RSI, which moves in overbought territory above 70, warns that downside corrections are possible.
Should the price head lower, traders could look for support around 85.74, where the market found resistance between July 12-19. Even lower, the market could touch the 20-period (simple) moving average (SMA) at 85.36 before it retests the 85.00 round level which could be of psychological importance. A substantial close below the July 24 low of 84.24, however, would clearly resume the bearish outlook in the market.
On the upside, additional gains could try to overcome today’s high of 86.11 to reach the top of 87.08 (May 22), the highest level touched since early February. Further up, the attention would turn to the area around 88.00, a frequently approached zone between October and February.