

Sample Category Title
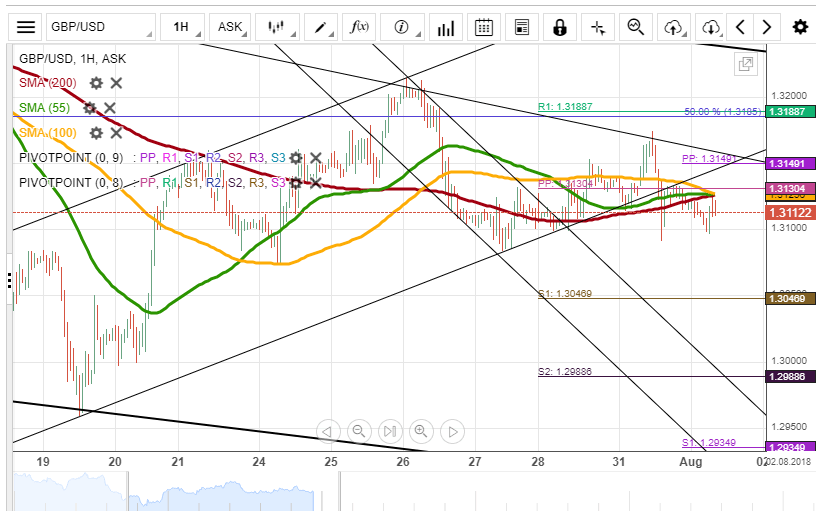
GBP/USD Falls Below 1.3130
Some bullish momentum was apparent in the market on Tuesday morning. This appreciation failed to exceed 1.3160, as the combined resistance of the 100– and 200-period (4H) SMAs weakened the strength of bulls. As a result, the Pound provided the third confirmation of a short-term trend-line near 1.3160. The rate was pushed lower past the 55-, 100– and 200-hour SMAs later in the day.
Technical signals are mixed today. However, the rate moving below this strong support cluster does suggest further decline in this session. A possible downside target is the weekly S1 at 1.3040.
In terms of resistance, it is unlikely that the weekly R1, the 50.00% Fibo and the 200-period SMAs near 1.32 are breached. The FOMC rate statement might introduce high volatility in the evening.
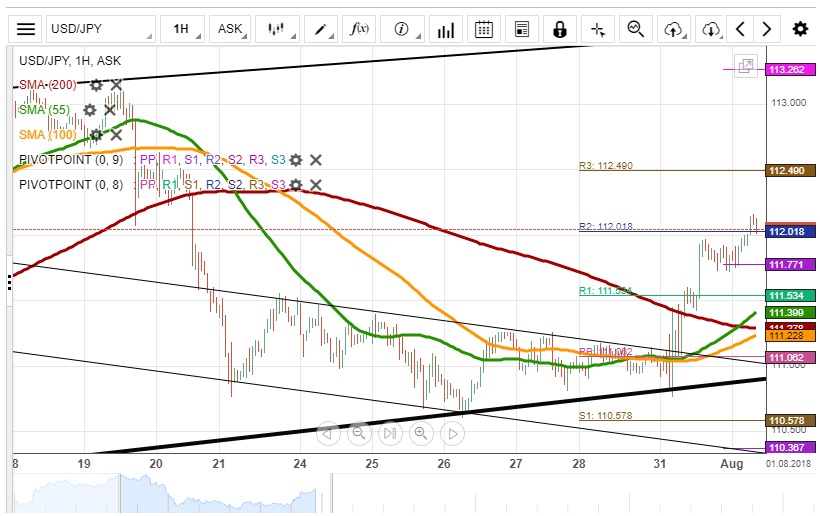
USD/JPY Shoots Up On Tuesday
USD/JPY gained 83 pips on Tuesday after accelerating from the senior channel near 111.00. The Greenback strengthened against all major currencies mid-session, thus surging almost 0.40% against the Yen in one hour.
By Wednesday morning, the rate had allayed considerably, but it was still able to reach the weekly R2 at 112.08. This solid appreciation has sent the pair in the overbought territory, while technical indicators are converging. Thus, the US Dollar is likely to aim for the 55-, 100– and 200-hour SMAs near 11.20. Given that this cluster is also reinforced by several other lines, this level should remain intact.
Conversely, upside target is set near the 113.00 mark. Despite trading sideways for several hours, bulls could still add some gains during the following hours.
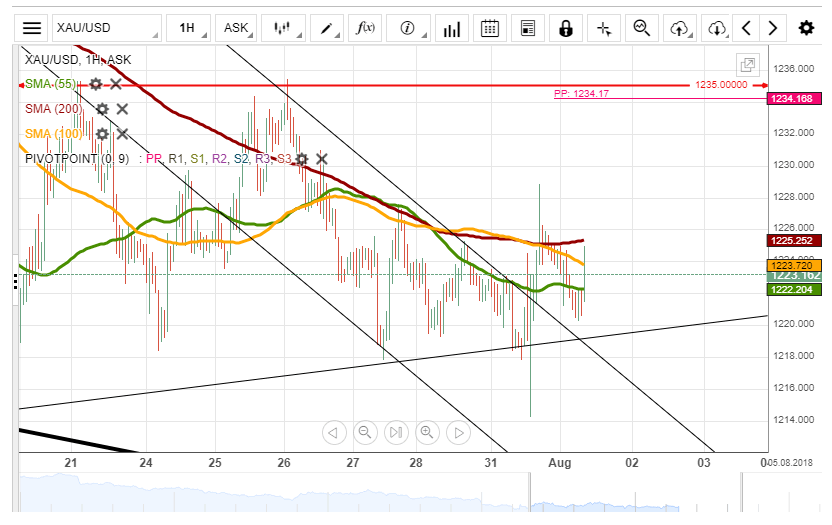
XAU/USD Fails To Breach Range
Gold has been trading sideways against the US Dollar since Friday, as it has been stranded in a narrow range between the 55-, 100– and 200-hour SMAs and the 1,218.50 mark.
The pair tried to re-test the longer-term SMAs mid-Tuesday, but bulls lacked the necessary momentum to dash through this weekly resistance. Nevertheless, bears also failed to accelerate, thus showing that the bearish sentiment is not very strong, as well.
When one of these sides eventually takes the upper hand, the yellow metal should surge considerably in the breakout level. Upside target is the monthly PP and the 100-period (4H) SMA at 1,235.00, while a fall can be limited solely by the weekly S1 at 1,205.00. Medium-term signals remain bullish.
Investors Expect The Fed Internest Rate Decision
The US currency strengthened against the basket of major currencies. The US dollar was supported by the CB consumer confidence index published yesterday, the value of which counted to 127.4 in July, while experts expected 126.5. It also became known that the US and China intend to repeat negotiations in order to avoid a trade war. The US dollar index (#DX) closed yesterday in the positive zone (+0.23%). Today, investors took a wait-and-see position before the Fed meeting. It is expected that the regulator will leave the interest rate unchanged at 2.00%.
Yesterday, important economic statistics in the Eurozone and Canada were also published. Thus, the number of unemployed in Germany reduced by 6K, while experts expected a decrease by 10K. The consumer price index in the Eurozone counted to 2.1% and was above the forecasted value of 2.0%. However, GDP (year-on-year) slowed down to 2.1% instead of 2.2%. The indicator of Canada GDP increased to 0.5% in May, although investors forecasted a value of 0.3%.
Today during the Asian trading session, a report on employment change (q/q) in New Zealand has been published. The value counted to 0.5% and was above the forecasted value of 0.4%. However, the unemployment rate in New Zealand rose to 4.5% in the second quarter instead of 4.4%. In China, the index of economic activity in the manufacturing sector from Caixin was published, which counted to 50.8 in July, while investors forecasted a value of 50.9.
The "black gold" prices are declining due to the increase in supply. At the moment, futures for the WTI crude oil are testing a mark of $68.10 per barrel. At 17:30 (GMT+3:00), a report on the US crude oil inventories will be published.
Market Indicators
Yesterday, the bullish sentiment was observed in the US stock market: #SPY (+0.49%), #DIA (+0.51%), #QQQ (+0.77%).
At the moment, the 10-year US government bonds yield is at the level of 2.96-2.97%.
The news feed on 2018.08.01:
- The index of economic activity in the manufacturing sector in Germany at 10:55 (GMT+3:00);
- The index of economic activity in the UK manufacturing sector at 11:30 (GMT+3:00);
- ADP nonfarm employment change at 15:15 (GMT+3:00);
- The index of economic activity in the US manufacturing sector from ISM at 17:00 (GMT+3:00);
- Fed interest rate decision at 21:00 (GMT+3:00).
Trump Raises Stakes In The Trade War With China…Again
Two opposite trends prevail in the global markets. Strong reporting of companies, including Apple indicators supports the demand in world markets. However, the Chinese bourses falls under the pressure on the news that Trump is considering 25% tariffs on Chinese goods worth $200 billion against 10% that are being discussed now.
The news about tariffs for China appeared shortly before the start of the negotiations round between the major world economies. We saw a similar move before Juncker and Trump meeting last week. The goods in the amount of $200 bln represent almost the half of U.S. imports from China and about 10% of total U.S. imports per year. 25% of tariffs can add to inflation more than 1.2 percentage points and seriously harm the established business practice in the USA. Since July 1, the States have introduced duties for goods worth $34 bln and China responded in tit-for-tat manner.
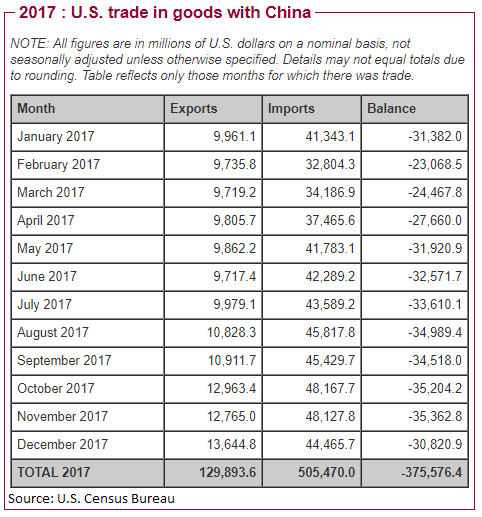
It is also interesting how China intends to respond to the expansion of duties up to $200 billion. The U.S. exports goods to China amounting to $130 bln, so it is unlikely that it will be able to respond with a proportionate expansion.
It is quite possible that the US-China rates are so high that the negotiations are simply bound to move into a more constructive direction.
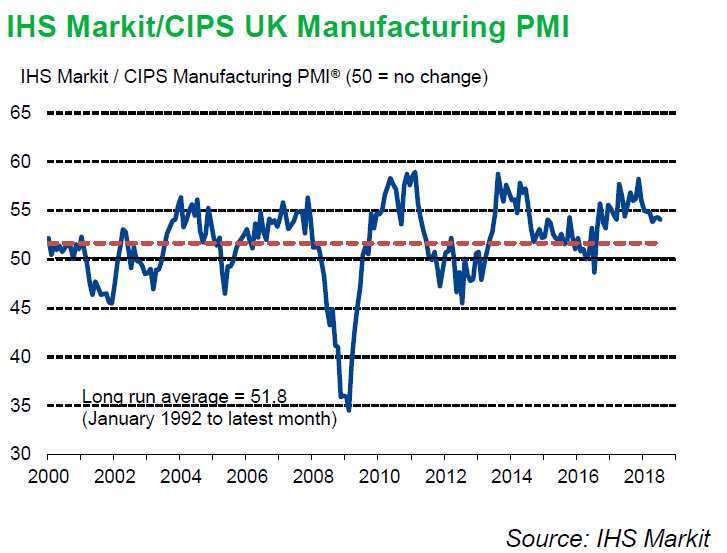
UK PMI manufacturing dropped to 54.2, performance becoming more uneven
UK PMI manufacturing dropped to 54.0 in July, down from 54.3 and missed expectation of 54.2. Markit noted weaker increases in both output and new orders. Also, intermediate goods production falls for first time in two years.
Rob Dobson, Director at IHS Markit, which compiles the survey:
"UK manufacturing started the third quarter on a softer footing, with rates of expansion in output and new orders losing steam. The upturn in the sector has eased noticeably since the back-end of 2017, meaning that manufacturing has failed to provide any meaningful boost to headline GDP growth through the year-so-far.
"The July survey data also shows that the performance of the sector is becoming more uneven, with solid output growth in the investment goods industry being largely offset by intermediate goods production contracting for the first time in two years. As the intermediate goods sector supplies other manufacturers, taken alongside weaker growth of total new orders and a drop in business confidence to a 21-month low, this all suggests industry is unlikely to exit this soft patch in the near future.
"The prices picture remained mixed in July. Cost inflation eased, whereas selling prices rose at the quickest pace in five months. The financial markets still seem to have an interest rate increase nailed on for August. However, if the combination of weaker growth and a softening of pipeline cost pressures at manufacturers is mirrored in the larger service sector, the Bank of England's decision will be far from unanimous and they may even yet find some cause for pause."
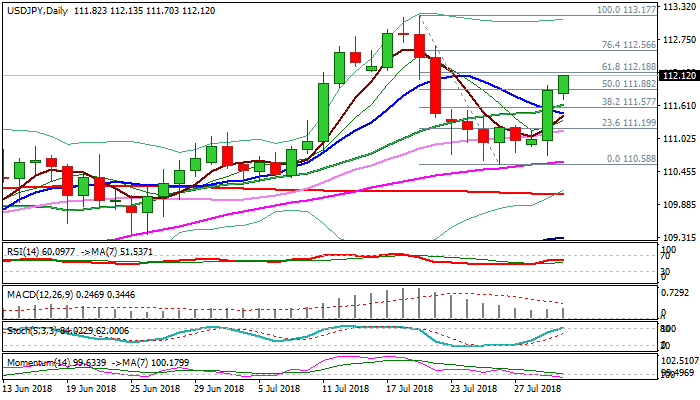
USD/JPY Outlook – Bulls Extend Above 112 Ahead Of Fed
The pair hit new nearly two-week high on probe above the 112 handle on Wednesday, in an extension of previous day's post-BoJ 0.8% rally (the biggest one-day gains since 11 July).
The dollar was additionally boosted by the news that Trump's administration is considering to raise tariffs on Chinese goods.
Fresh gains approach pivotal barrier at 112.18 (Fibo 61.8% of 113.17/110.58 pullback, break of which is needed for a new bullish signal.
Fed's policy decision is in focus, with the central bank widely expected to keep rates steady today and signal a rate hike in September, as inflation near 2% targets, stable growth and full employment support scenario.
The greenback may advance further if Fed's decision meets expectations, but caution is required as daily techs send negative signals and warn of rally's stall.
Overbought slow stochastic and bearish divergence of momentum, which trends lower in the negative territory, could be signals for ‘buy the rumor -sell the fact' scenario after FOMC.
Pivotal supports lay at 111.61 (20SMA) and 111.46 (10SMA), firm break of which would be a negative signal and would shift near-term focus higher.
On the other side, sustained break above the 112.18 Fibo barrier will be a bullish signal, but according to weak techs, it's not clear whether the pair will be able to hold gains.
Res: 112.18, 112.56, 113.17, 113.38
Sup: 111.88, 111.61, 111.46, 111.18
Master Candle Breakout On Gold
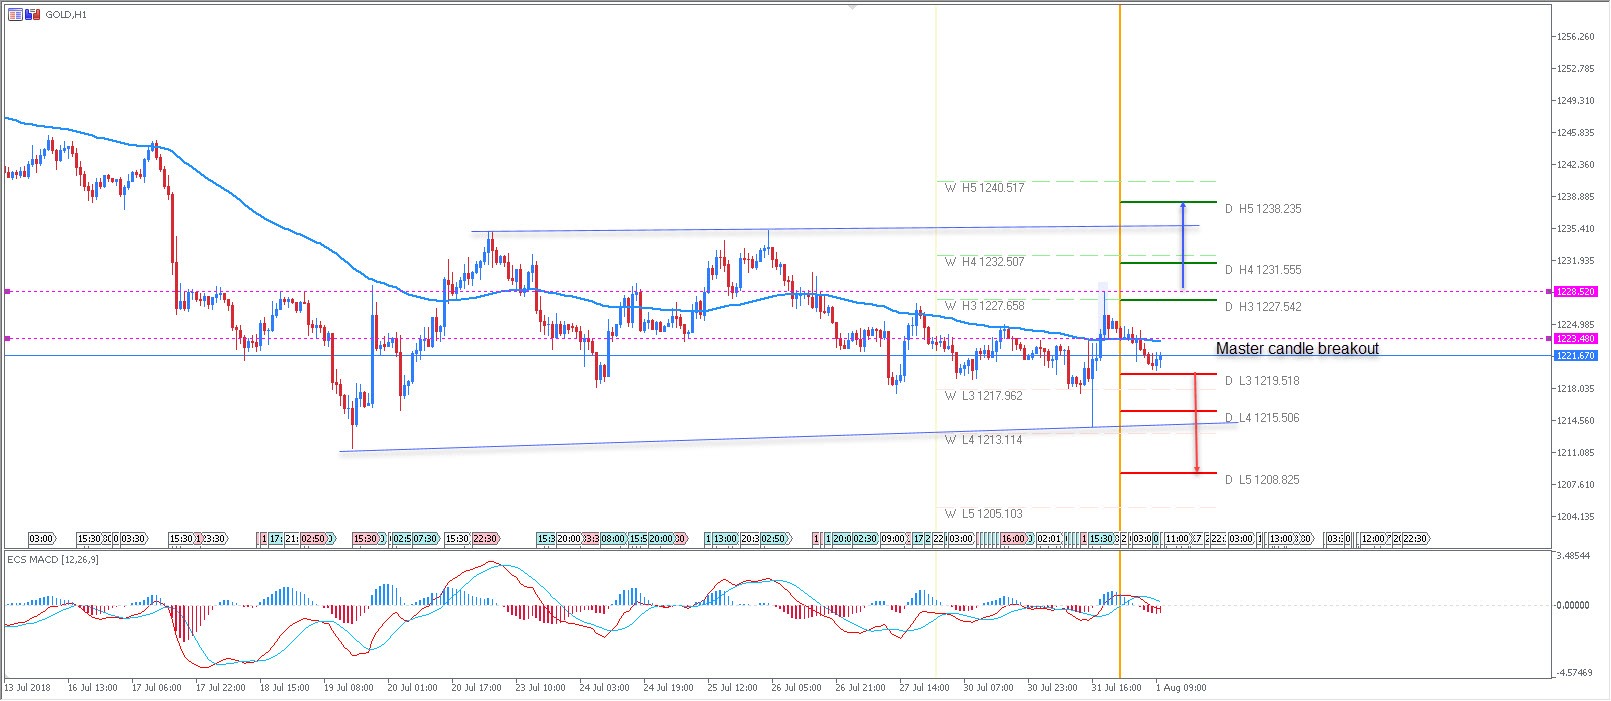
The Master candle breakout (blue highlight) happened exactly below 1223.48 and the price went to 1219 zone subsequently. This indicates a range play with continuation possibilities. Below 1219, targets are 1215.50 and 1213. 1208.82 is the final daily projected target.
However, if we see a spike above 1228.52 (master candle’s high) next targets should be 1232.50 followed by 1238.23.
W L3 - Weekly Camarilla Pivot (Weekly Interim Support)
W H3 - Weekly Camarilla Pivot (Weekly Interim Resistance)
W H4 - Weekly Camarilla Pivot (Strong Weekly Resistance)
D H4 - Daily Camarilla Pivot (Very Strong Daily Resistance)
D L3 – Daily Camarilla Pivot (Daily Support)
D L4 – Daily H4 Camarilla (Very Strong Daily Support)
POC - Point Of Confluence (The zone where we expect price to react aka entry zone)
Eurozone Mid-Year Economic Outlook
Executive Summary
Real GDP growth in the Eurozone slowed modestly in Q2, at 2.1 percent year over year. That said, the manufacturing sector and consumer spending were likely bright spots, and a tight labor market along with slowly rising incomes should support economic growth in the coming quarters. While GDP growth has remained solid, inflation in the Eurozone is still largely benign. Although headline inflation has picked up to reach the ECB's 2 percent target in recent months, core inflation still remains steady around 1 percent and has restrained the more rapid removal of policy accommodation on the part of the ECB. That said, the Governing Council has stated it plans to end its QE program at the end of this year. Assuming economic growth and inflation continue to pick up, we then look for the Governing Council to begin raising rates in early autumn 2019.
Amid the backdrop of solid economic growth and accommodative monetary policy, trade tensions in the Eurozone heated up in Q2 as the Trump administration threatened a 25 percent tariff on auto imports from the European Union (EU). A recent Washington, D.C. summit between President Trump and European Commission President Juncker has since calmed the nerves of trade watchers as the two countries agreed to work toward removing trade barriers. However, the situation could deteriorate again if negotiations were to reach an impasse. In our view, a fullblown trade war, should one come to pass, probably would not completely derail the Eurozone economy. Exports to the United States totaled just 2.5 percent of Eurozone GDP in 2017, meaning that the effect from tariffs could be painful, but not large enough to meaningfully drag on the overall economy. Although trade tensions present a downside risk to our forecast, we look for the economic expansion to remain in place, and forecast that real GDP will grow roughly 2 percent this year and in 2019.
Eurozone GDP Decelerates Further in Q2
Data released today showed that real GDP in the Eurozone rose 0.3 percent (1.4 percent at an annualized rate) in Q2-2018 relative to the previous quarter, which was a bit lower than the consensus forecast (Figure 1). On a year-ago basis, GDP was up 2.1 percent, which is not as strong as the 2.7 percent rate that was registered at the end of last year. Looking forward, we forecast that the year-over-year rate of GDP growth will slow further, although we believe that the expansion in the euro area that has been in place for the past five years will remain intact.
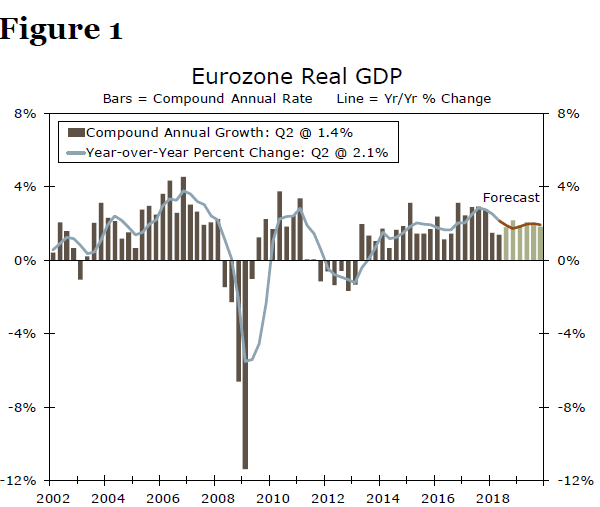
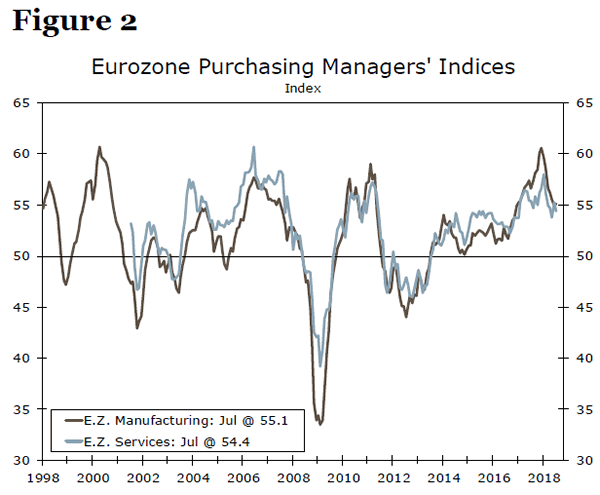
A breakdown of the real GDP data into its underlying demand components will not be available until next month. While it is too early to pinpoint the exact cause of the Q2 deceleration, monthly economic indicators still point to the solid nature of the underlying expansion. The Q1 slowdown was due in part to lackluster manufacturing output as the region experienced colder-than-normal temperatures, but the manufacturing sector looks to be recovering so far in Q2. Industrial production rose 1.3 percent in May after dropping into negative territory in April. Although the purchasing managers' indices (PMI) have trended lower so far this year, they still remain above the 50 demarcation line that signals expansion, with the manufacturing PMI rising 0.2 points to 55.1 in July's preliminary reading (Figure 2).
Alongside solid manufacturing output, consumer spending also looks to have remained firm in Q2 after rising a solid 0.5 percent in Q1. Although retail sales only make up a portion of total consumer spending, real retail sales rose 0.6 percent through the first two months of the quarter relative to Q1. As we discuss in more detail below, the labor market remains tight, and with inflation still relatively benign, the gradual pick up in real wages along with the solid pace of job gains should support growth in consumer spending in the coming quarters.
Although trade tensions have cooled in recent weeks, international trade in the Eurozone likely moderated slightly in Q2, as real exports dropped 0.2 percent through the first two months of Q2 relative to Q1. That said, solid global demand should support a rebound in exports in the coming quarters. On net, the monthly indicators paint a slightly more upbeat picture of the underlying trends in the Eurozone economy, and economic growth should continue in the coming quarters.
ECB Policy to Remain Accommodative for the Foreseeable Future
As noted above and as shown in Figure 1, we forecast that the economic expansion in the Eurozone will remain intact through the end of 2019. As we discuss in more detail subsequently, monetary policy in the euro area remains accommodative, which should help support growth in consumption and investment expenditures. Fiscal policy is no longer exerting strong headwinds on GDP growth as it was a few years ago when austerity held sway at the height of the European sovereign debt crisis. Growth in exports should remain buoyant due to solid economic growth in most of the Eurozone's major trading partners. That said, a potential trade war with the United States, which we also discuss in more detail subsequently, represents a downside risk to our real GDP forecast for the euro area.
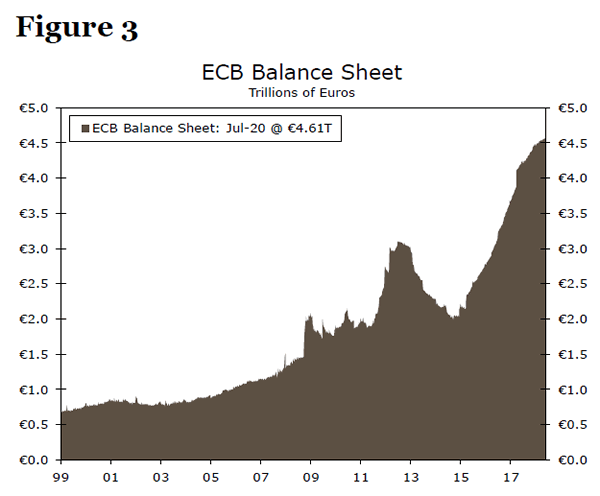
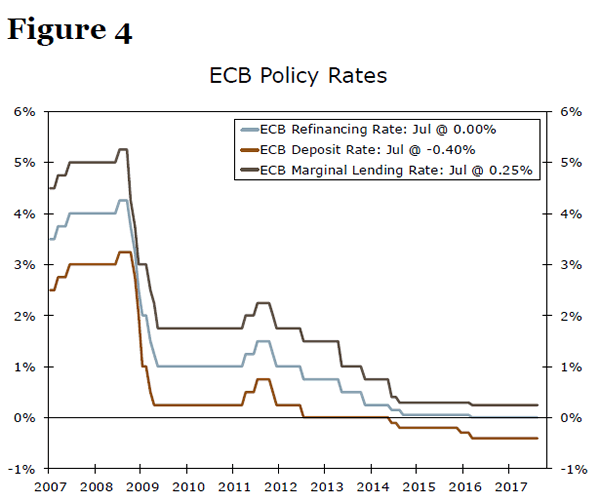
Although a self-sustaining economic expansion has been underway for some time in the Eurozone, the European Central Bank (ECB) has not yet started the process of removing its extraordinary degree of policy accommodation. Indeed, the ECB continues to maintain its quantitative easing (QE) program (Figure 3), although the Governing Council has said that it will cease buying bonds altogether at the end of the year. In addition, the Governing Council has not made any moves yet to raise the ECB's three policy rates from their historic lows (Figure 4).
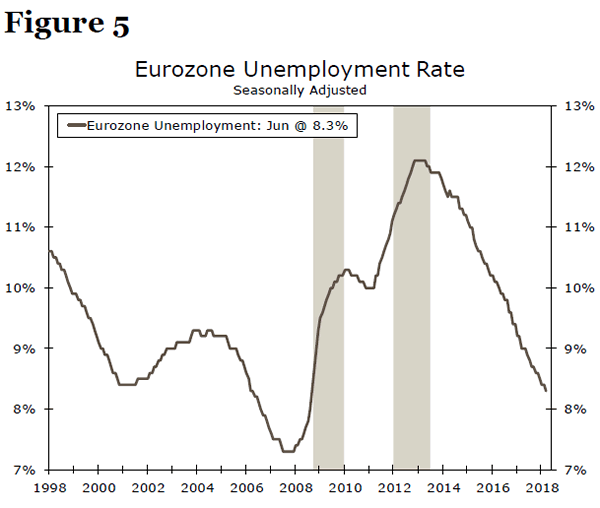
The economic expansion, which has been underway in the euro area for the past five years, has led to a marked decline in the unemployment rate over that period (Figure 5). Although the unemployment rate has not yet reached the low that was set at the end of the last expansion, it is only 1 percentage point from that nadir. Despite solid economic growth and the noticeable improvement in the labor market, the ECB has yet to remove policy accommodation. Why is the Governing Council dragging its feet?
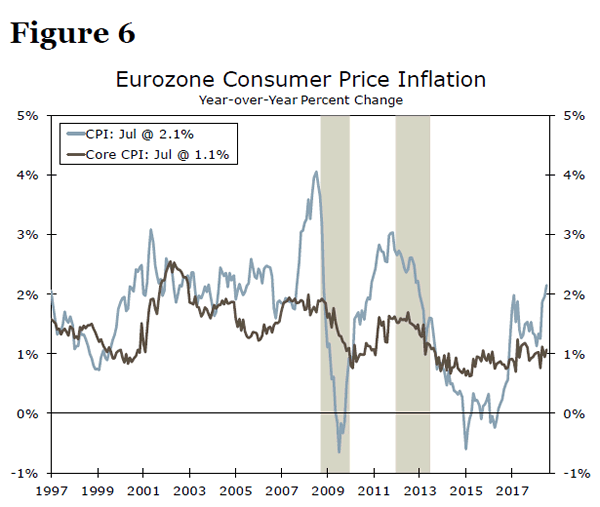
The ECB has a single mandate, namely price stability, which it interprets as "inflation rates below, but close to, 2 percent over the medium term." As shown in Figure 6, the overall CPI inflation rate is currently 2.1 percent. However, the core rate of inflation, which excludes prices of food, energy, alcohol and tobacco, has been steady at roughly 1 percent over the past three years. Because prices of the goods that are excluded from the core CPI tend to be volatile, the core rate of CPI inflation is a good measure of the underlying inflationary pressures in the economy. In short, the ECB has refrained from removing policy accommodation because there are few inflationary pressures in the Eurozone at present.
We take the Governing Council at its word when it says that it intends to wrap up its QE program at the end of the year.1 The Governing Council has also said that it intends to keep its three policy rates unchanged at their current levels "at least through the summer of 2019." If our forecast of continued economic expansion and gradually rising core inflation in the Eurozone comes to pass, then we would expect that the Governing Council will raise the deposit rate from -0.40 percent to -0.20 percent in early autumn 2019. But we expect that the Governing Council will leave the ECB's main refinancing rate, currently 0.00 percent, and the rate on the marginal lending facility (0.25 percent) unchanged initially. At the end of 2019, we forecast that the Governing Council will raise the ECB's deposit rate to 0.00 percent, the main refinancing rate to 0.25 percent and the rate on the marginal lending facility to 0.50 percent.
Could a Trade War Derail the Economic Expansion in the Euro Area?
The airwaves have been filled this year with threats of potential trade wars. Not only has the ire of the Trump administration been directed at China, but the EU has also felt its wrath. For starters, the administration has levied a 25 percent tariff on imports of steel products and a 10 percent tariff on imports of aluminum products from many of America's trading partners, including the countries of the EU. In addition, the administration has threatened to levy a 25 percent tariff on auto imports from the EU. The EU responded with its own retaliatory tariffs on some American-made goods.
Trade tensions between the United States and the EU ratcheted down a notch at a meeting in Washington, D.C. on July 25 between Jean-Claude Juncker, president of the European Commission, and President Trump. The two leaders agreed to work toward the elimination of all trade barriers between the two economies, and Juncker promised that the EU would buy more American soybeans and liquid natural gas (LNG). In return, Trump agreed that the United States would not raise tariffs on European autos, at least not for the time being. A trade war has been averted for now, but tensions could easily return if negotiations bog down. Could a trade war, should one eventually occur, bring the Eurozone economy to its knees?
Last year, the United States imported $6 billion worth of steel products from the EU and an additional $1.3 billion of aluminum products. EU exports of steel and aluminum products to the United States likely will be lower this year than they were in 2017 due to the tariffs that have been imposed. American imports of autos and auto parts from the EU were an order of magnitude larger, totaling about $50 billion in 2017. EU exports of autos and auto parts could weaken significantly going forward if the threatened tariffs actually were to be imposed.
Although individual European producers of steel, aluminum and autos could be harmed significantly by American trade restrictions, the tariffs are not likely to have a meaningful effect on the macro Eurozone economy. Last year, nominal GDP in the euro area totaled more than €11 trillion (nearly $15 trillion at the PPP exchange rate). Declines in steel, aluminum and auto exports are simply not large enough to cause a significant weakening in the Eurozone economy.
A full-blown trade war, in which the United State levied tariffs on all of its imports from the Eurozone, would be more painful, but it probably would not be a complete catastrophe either. The United States imported $330 billion worth of goods from euro area countries in 2017. This amount was equivalent to 2.5 percent of Eurozone GDP, but exports would not collapse completely, even if tariffs were levied on all goods. We do not have a well-informed view of the ultimate outcome of the current trade tensions/negotiations between the United States and the EU. If a full-blown trade war actually were to come to pass, we would need to ratchet back our growth outlook for the Eurozone in coming quarters. But we probably would not forecast an outright recession simply because Eurozone exports to the United States likely would not weaken enough to produce an outright recession.
Conclusion
Although real GDP growth in the Eurozone decelerated slightly in Q2, the underlying nature of the economic expansion remains intact. Firming manufacturing output and solid consumer spending should continue to support economic growth in the coming quarters. Lackluster price pressures have also led the ECB to keep monetary policy firmly in accommodative territory, although the Governing Council has signaled that it intends to end its QE program at the end of 2018. We take the Governing Council at its word, and assuming our expectations of economic growth and slowly rising inflation play out, we then look for the ECB to begin to slowly raise rates in the early autumn of 2019. While trade tensions pose a downside risk to our outlook, we do not view recent trade disputes as having a meaningful effect on the current economic expansion. We look for Eurozone real GDP to grow roughly 2 percent this year and in 2019.
1 The Governing Council announced on June 14 that it would reduce its monthly purchase rate from €30 billion to €15 billion after September 2018 and that it would cease buying bonds altogether after December.
Fed Set For ‘Hawkish Hold’? Trade Back In The Spotlight
Here are the latest developments in global markets:
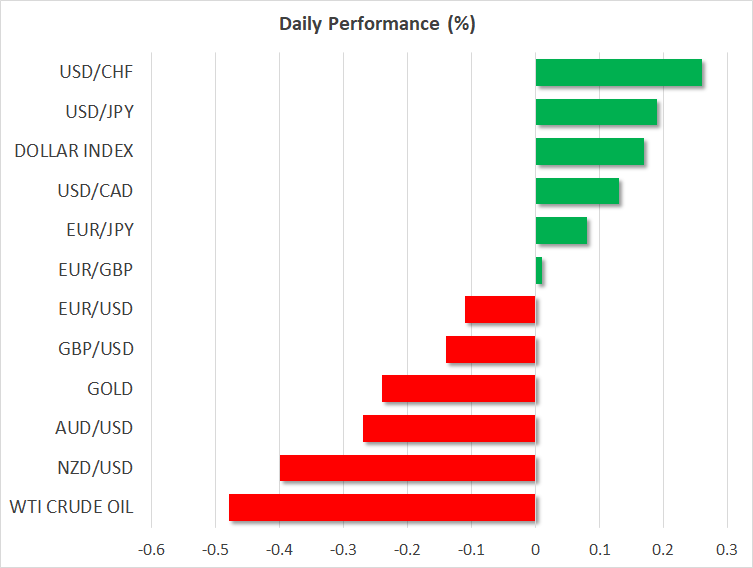
FOREX: The US dollar index is higher by 0.17% on Wednesday, ahead of the Fed policy decision at 1800 GMT, and building on the gains it posted in the previous session. The yen continued to retreat yesterday after the BoJ implicitly signaled it will keep its policy rates 'low for longer'. The aussie and the kiwi both took a modest hit overnight, after media reports suggested the US may impose 'heavier' tariffs on Chinese imports to ramp up the pressure on Beijing.
STOCKS: Wall Street closed higher on Tuesday, aided by reports that the US and China are looking to restart talks aimed at deescalating trade tensions between them. The Nasdaq Composite (+0.55%), S&P 500 (+0.49%), and Dow Jones (+0.43%) all advanced. Meanwhile, futures suggest a relatively flat open for the Dow and S&P today, but the Nasdaq 100 is expected to open much higher, likely lifted by Apple reporting strong earnings after the closing bell. Elsewhere, Asia was mixed on Wednesday. Whereas Japan’s Nikkei 225 and Topix climbed by 0.86% and 0.94% respectively, boosted by a weaker yen, the Hang Seng in Hong Kong dropped by 0.63%, weighed on by separate reports the US may impose heavier tariffs on China. In Europe, most benchmarks were expected to open lower today, futures suggest, with the only exception being the French CAC 40.
COMMODITIES: Oil prices dropped on Tuesday and are lower on Wednesday as well, as a combination of a stronger dollar, fresh signs of US-China trade tensions, and a surprising buildup in the private API crude inventory figures all took their toll. WTI is down by 0.47% to $68.21 per barrel, while Brent fell by 0.35% to $73.81 a barrel. Today, all eyes will turn to the official EIA weekly stockpile data. In precious metals, gold continues its 'summer lull', trading in a narrow range between $1,235 and $1,211 an ounce since July 18. A break in either direction could determine the next directional wave.
Major movers: Yen crumbles after BoJ; trade saga back in focus; dollar recovers
The Japanese yen continued to tumble following the BoJ meeting, as the theme of monetary policy divergence came back to the fore. With the BoJ confirming it will continue to keep yields on Japanese bonds capped at low levels while other major central banks such as the Fed are raising rates, interest rate differentials may widen even further, rendering the yen less attractive relative to currencies like the dollar. Hence, absent some 'risk off' episode that drives safe-haven flows into the yen, changes in relative interest rates could continue to keep the Japanese currency under pressure.
After what seemed like a brief 'summer pause', US-China trade tensions came back to the spotlight yesterday. Stock markets initially got a boost by a Bloomberg report that the US and China are trying to restart trade talks in order to deescalate tensions. The optimism didn’t last though, with reports a few hours later suggesting Washington will propose raising to 25% its planned 10% tariffs on $200bn worth of Chinese imports – a move aimed at pressuring Beijing. High-yielding currencies took a hit, with aussie/dollar and kiwi/dollar trading lower by 0.27% and 0.40% respectively today. The kiwi was also dragged down by a surprising uptick in New Zealand’s unemployment rate for Q2, released overnight.
Overall, while the trade headlines appear contradictory at first glance, they are nevertheless in line with the Trump administration’s method of operation thus far: ratchet up pressure first, before negotiating a favorable deal. Stocks and high-yielding currencies will likely remain sensitive to incoming headlines, reacting positively to any signs of negotiations, and negatively to any fresh escalation.
Meanwhile, the dollar index managed to end the day higher, despite a slight miss in the Fed’s preferred inflation measure. The core PCE price index for June rose by 1.9% in yearly terms, missing the forecast of 2.0%, with the previous print also revised down to 1.9%. That said, the rest of the US data – including personal income and spending – were in line with expectations, reaffirming the US economy closed Q2 on a strong footing. Today, all eyes will be on the Fed decision (see below).
Day ahead: Trade back in the forefront; Fed to deliver a 'hawkish hold'?
The conclusion of the Federal Reserve’s meeting on monetary policy is likely to be gathering most interest out of Wednesday’s trading, alongside fresh developments on global trade, namely the US-China spat.
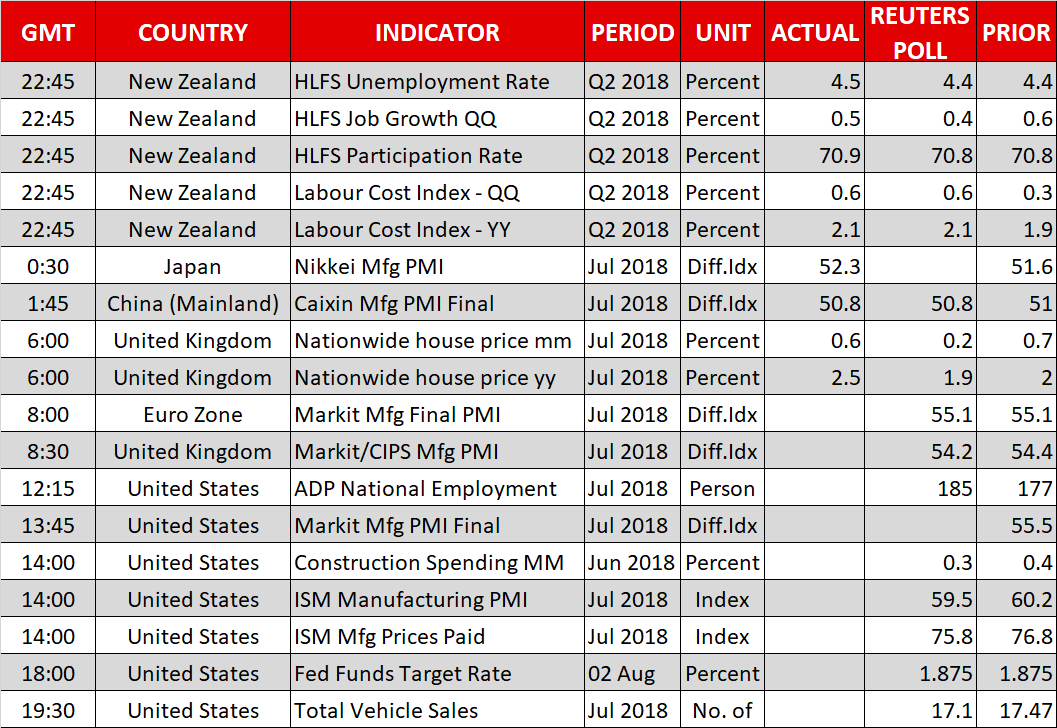
The eurozone’s final manufacturing PMI for July due at 0900 GMT is expected to be confirmed at 55.1, which would constitute the first advance for the gauge after declining for six straight months. Germany and France’s respective PMI prints will be made public at 0755 GMT and 0750 GMT correspondingly.
At 0930 GMT, manufacturing PMI figures for the UK will be released as well. The measure is projected to ease to 54.2 from 54.4 in June. Unlike the eurozone which sees the release of preliminary estimates as well, the UK is on the receiving end of one and only print, something which might render sterling more sensitive to the UK figure. It should be said, though, that the number is unlikely to change much ahead of tomorrow’s Bank of England meeting; market participants are widely expecting the delivery of a 25bps rate increase.
Out of the US, the ADP’s employment report on the number of positions added to the economy by the private sector is due at 1215 GMT, with analysts projecting the addition of 185k positions in July from 177k in June. This report is sometimes viewed as a preamble to the nonfarm payrolls one (out on Friday) which covers both the public and private sectors, though it should be stressed that the two are not as strongly correlated nowadays.
Other data out of the US will pertain to Markit’s manufacturing PMI for July (1345 GMT), June’s construction spending (1400 GMT), the ISM’s manufacturing prices paid for July as well as the institute’s manufacturing PMI for the same month (both due at 1400 GMT). As regards the latter, it is forecast to weaken a bit from June’s 60.2, though to still comfortably remain in expansion territory at 59.5; any number above 50 denotes sectoral growth. Meanwhile, the figures for July’s total vehicle sales out of the country are scheduled for release at 1930 GMT.
But the relative focus will be on the US central bank’s decision on interest rates which will be hitting the markets at 1800 GMT alongside the accompanying statement. The absence of a press conference and new economic projections are toning down the meeting’s importance, though still FOMC members’ views can steer the markets. No change in rates is expected but policymakers are likely to reiterate that the central bank remains on track to continue normalizing rates. Traders will likely attempt to decipher how strong the 'commitment' for two more rate hikes in 2018 is and position themselves accordingly. At the moment, Fed funds futures show that markets have fully priced in an additional quarter percentage point rate increase, while they assign a 69% probability for a second one. Lastly, any commentary on global trade and how it might affect the outlook will also be generating interest.
On the trade front, where developments can spur movements in FX, equity, fixed income and commodity markets, sources familiar with underlying developments said the Trump administration will propose raising to 25% its planned 10% tariffs on $200 billion in Chinese imports in a move to push back China into talks; the announcement could come as early as today, with China’s response to be eyed.
In equities, Tesla will be releasing quarterly earnings after the US market close on Wednesday.
In energy markets, weekly EIA data on US crude stocks are due at 1430 GMT and might offer short-term direction to oil prices; a roughly 2.8 million barrels drawdown is anticipated during the week ending July 27 after a fall by around 6.15m in the previously tracked week.
Technical Analysis: USDJPY short-term bullish at 11-day high; possibly overbought
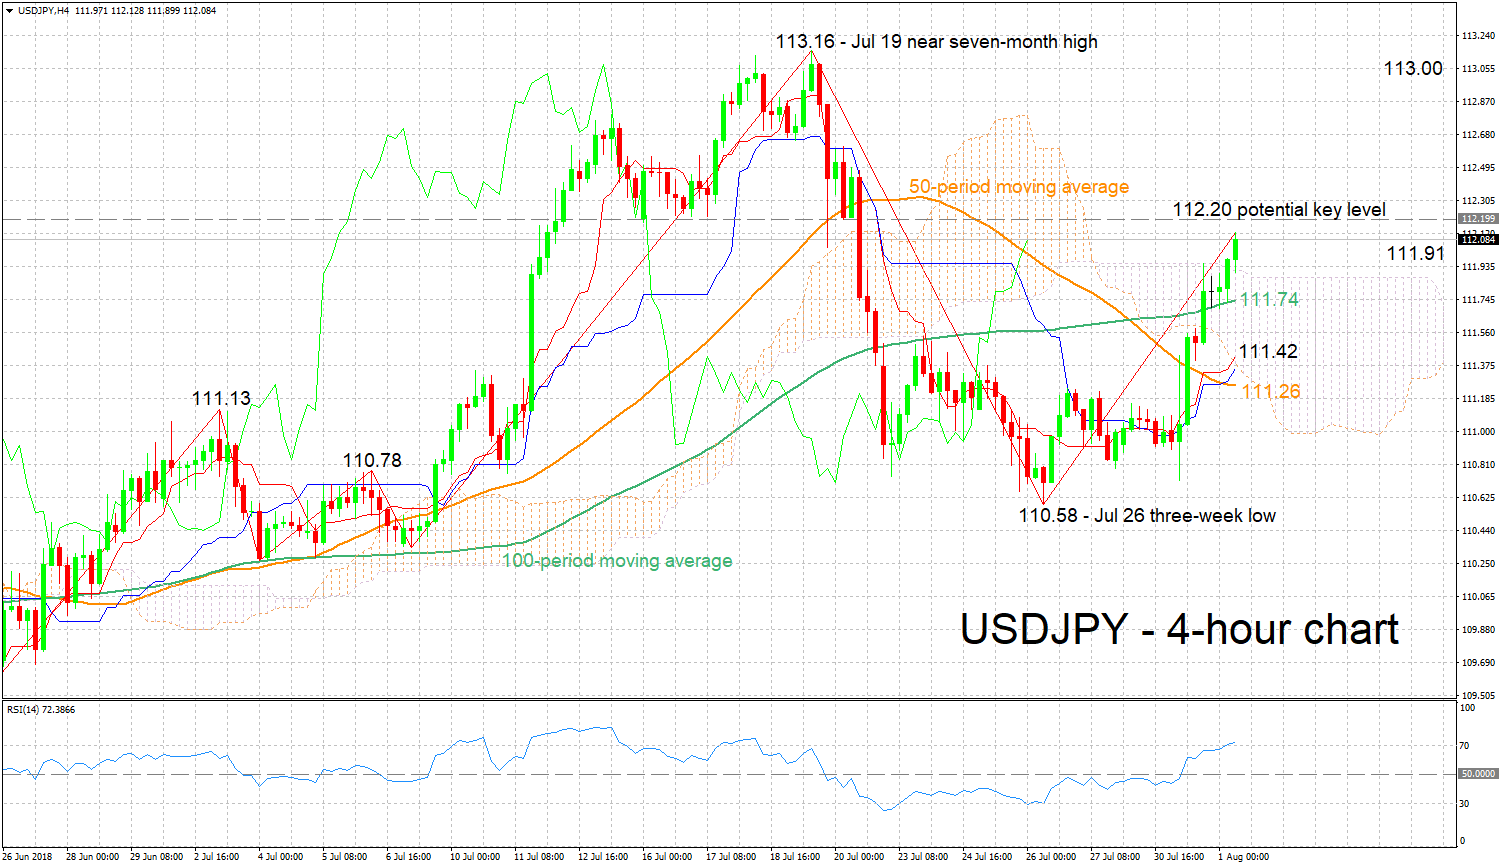
USDJPY is trading not far below the 11-day high of 112.13 hit earlier on Wednesday. The Tenkan- and Kijun-sen lines are positively aligned, and the RSI is advancing in bullish territory. All these are pointing to a positive picture in the near-term. However, notice that the RSI has entered overbought territory above 70; a reversal in the short-term is not to be ruled out.
A relatively hawkish Fed later today is expected to further boost the pair. The area around 112.20 provided support in previous weeks and may now act as immediate resistance to gains. An upside break would increasingly turn the attention to the 113 handle as well as to the near seven-month high of 113.16 from July 19.
Conversely, a more dovish than anticipated US central bank, will likely push USDJPY lower. The zone around the Ichimoku cloud top (111.91) and the current level of the 100-period moving average (111.74) may provide support. Further below, the region from 111.42 to 111.26 encapsulates the Tenkan-sen, Ichimoku cloud bottom, Kijun-sen and the 50-period MA, and may thus be of importance.
Trade deliberations can also move the pair.