

Sample Category Title
Sterling Trading A Tad Higher In The Asian Session
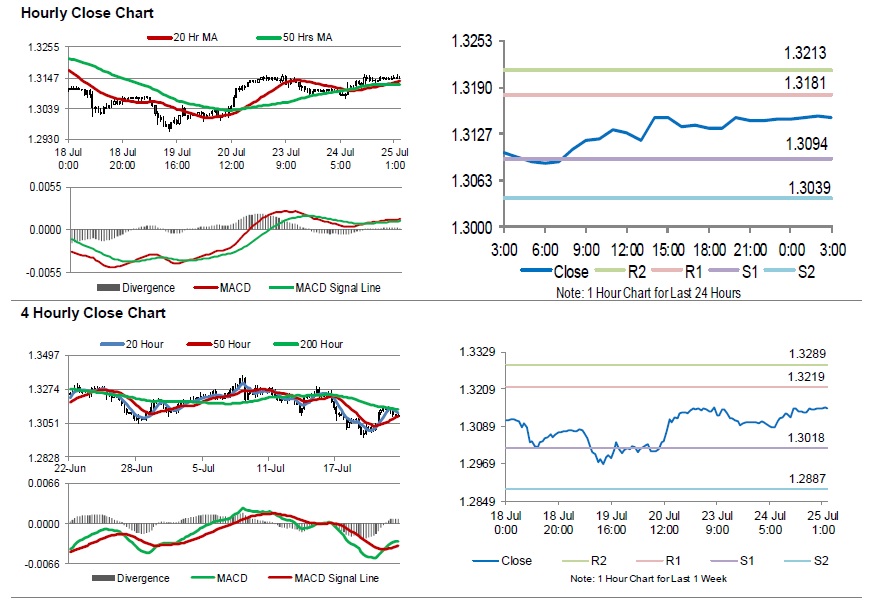
For the 24 hours to 23:00 GMT, the GBP rose 0.34% against the USD and closed at 1.3147.
Data indicated that, Britain’s CBI industrial trends total orders eased to a level of 11.0 in July, compared to a reading of 13.0 in the prior month. Markets had expected trend orders to fall to a level of 9.0.
In the Asian session, at GMT0300, the pair is trading at 1.3148, with the GBP trading marginally higher against the USD from yesterday’s close.
The pair is expected to find support at 1.3094, and a fall through could take it to the next support level of 1.3039. The pair is expected to find its first resistance at 1.3181, and a rise through could take it to the next resistance level of 1.3213.
Moving forward, investors will keep an eye on UK’s BBA mortgage approvals for June, due to release in a few hours.
The currency pair is trading above its 20 Hr and 50 Hr moving averages.
Japan’s Leading Index Climbed To A 6-Month High Level In May
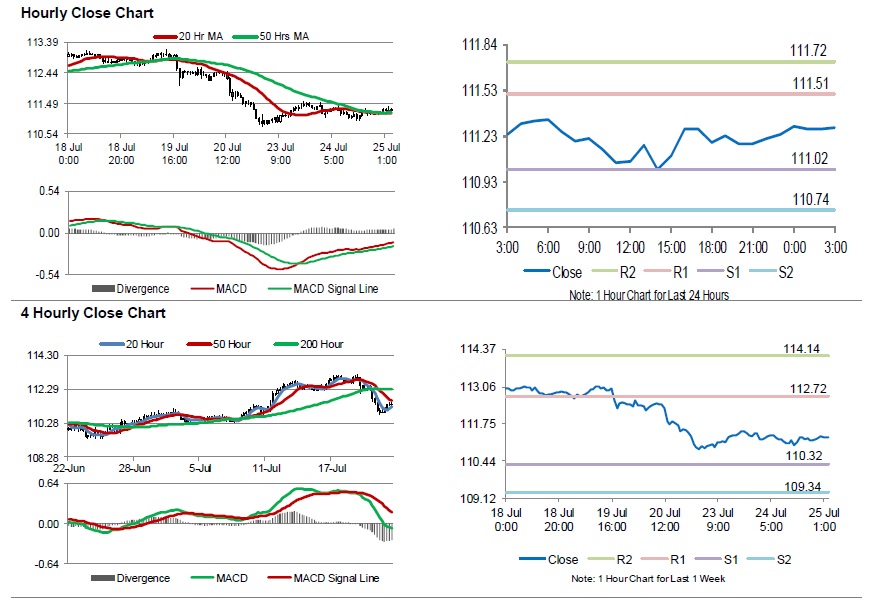
For the 24 hours to 23:00 GMT, the USD declined 0.16% against the JPY and closed at 111.24.
Data indicated that Japan's final leading economic index rose as initially estimated to a 6-month high level of 106.9 in May, in line with market expectations and compared to a reading of 106.2 in the prior month. Meanwhile, the nation's final coincident index dropped less than expected to a level of 116.8 in May, following a reading of 117.5 in the previous month. The preliminary figures had indicated a drop to a level of 116.1.
In the Asian session, at GMT0300, the pair is trading at 111.29, with the USD trading slightly higher against the JPY from yesterday's close.
The pair is expected to find support at 111.02, and a fall through could take it to the next support level of 110.74. The pair is expected to find its first resistance at 111.51, and a rise through could take it to the next resistance level of 111.72.
In absence of key economic releases in Japan today, investor sentiment would be determined by global macroeconomic events.
The currency pair is showing convergence with its 20 Hr and 50 Hr moving averages.
Swiss Franc Trading Marginally Lower In The Morning Session
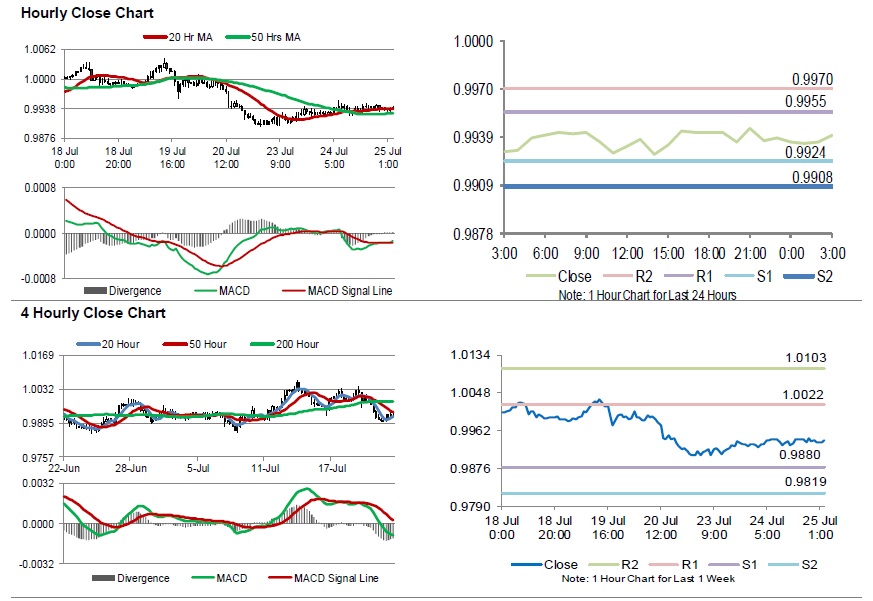
For the 24 hours to 23:00 GMT, the USD rose 0.08% against the CHF and closed at 0.9939.
In the Asian session, at GMT0300, the pair is trading at 0.9940, with the USD trading a tad higher against the CHF from yesterday’s close.
The pair is expected to find support at 0.9924, and a fall through could take it to the next support level of 0.9908. The pair is expected to find its first resistance at 0.9955, and a rise through could take it to the next resistance level of 0.9970.
Ahead in the day, market participants would keep a close watch on Switzerland’s ZEW survey – expectations for July.
The currency pair is showing convergence with its 20 Hr moving average and trading above its 50 Hr moving average.
Loonie Trading A Tad Lower In The Morning Session
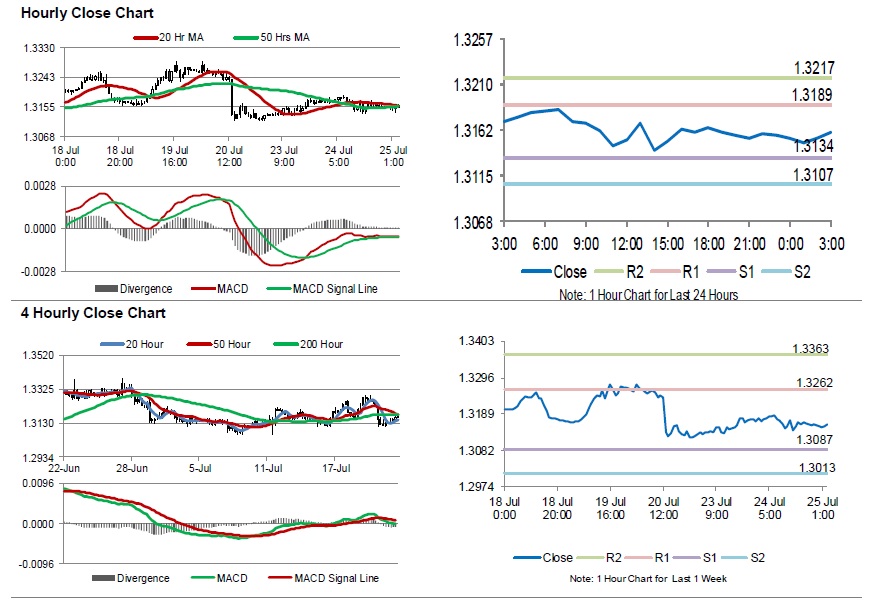
For the 24 hours to 23:00 GMT, the USD declined 0.12% against the CAD and closed at 1.3157.
In the Asian session, at GMT0300, the pair is trading at 1.3160, with the USD trading slightly higher against the CAD from yesterday’s close.
The pair is expected to find support at 1.3134, and a fall through could take it to the next support level of 1.3107. The pair is expected to find its first resistance at 1.3189, and a rise through could take it to the next resistance level of 1.3217.
In absence of any macroeconomic releases in Canada today, investor sentiment would be governed by global macroeconomic factors.
The currency pair is showing convergence with its 20 Hr and 50 Hr moving averages.
Australia’s Inflation Rose Less-Than-Anticipated In Q2
For the 24 hours to 23:00 GMT, the AUD rose 0.60% against the USD and closed at 0.7425.
LME Copper prices rose 0.2% or $14.0/MT to $6167.0/MT. Aluminium prices declined 2.3% or $48.0/MT to $2082.0/MT.
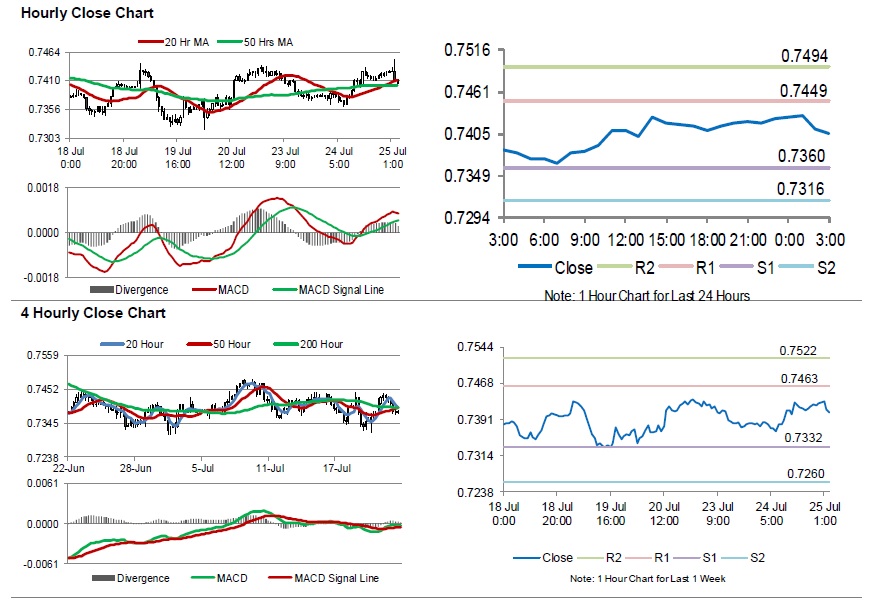
In the Asian session, at GMT0300, the pair is trading at 0.7405, with the AUD trading 0.27% lower against the USD from yesterday's close.
Overnight data indicated that Australia's consumer price index (CPI) jumped 2.1% on an annual basis in 2Q 2018, falling short of market expectations for an advance of 2.2% and dimming the prospects for rate hike. In the previous quarter, the CPI had climbed 1.9%.
The pair is expected to find support at 0.7360, and a fall through could take it to the next support level of 0.7316. The pair is expected to find its first resistance at 0.7449, and a rise through could take it to the next resistance level of 0.7494.
Amid lack of economic releases in Australia today, traders would focus on global macroeconomic events for further direction.
The currency pair is showing convergence with its 20 Hr and 50 Hr moving averages.
Gold: Yellow Metal Trading Slightly Higher In The Asian Session
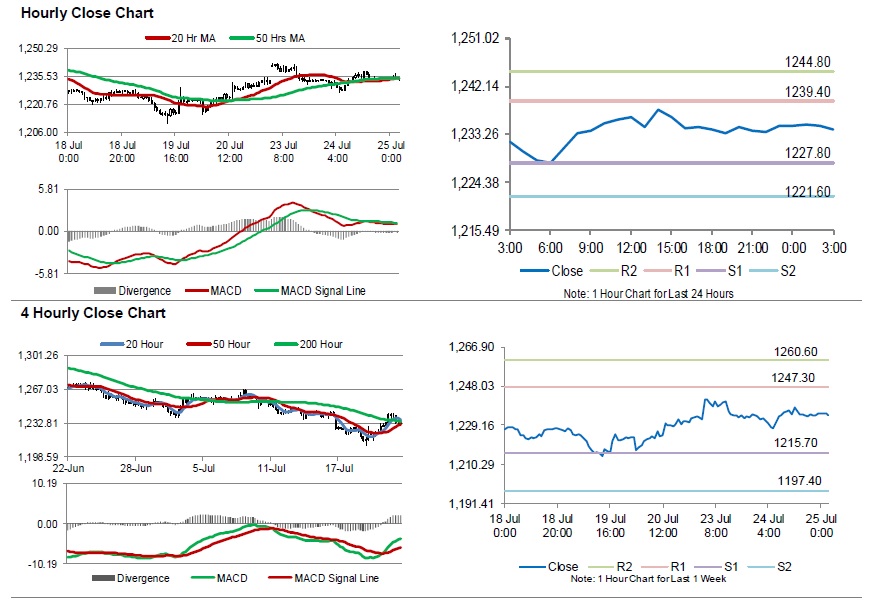
For the 24 hours to 23:00 GMT, Gold is trading flat against the USD and closed at USD1233.70 per ounce.
In the Asian session, at GMT0300, the pair is trading at 1234.00, with gold trading marginally higher against the USD from yesterday’s close.
The pair is expected to find support at 1227.80, and a fall through could take it to the next support level of 1221.60. The pair is expected to find its first resistance at 1239.40, and a rise through could take it to the next resistance level of 1244.80.
The yellow metal is showing convergence with its 20 Hr and 50 Hr moving averages.
Silver: White Metal Reverses Its Gains In The Morning Session
For the 24 hours to 23:00 GMT, Silver rose 0.71% against the USD and closed at USD15.51 per ounce.
In the Asian session, at GMT0300, the pair is trading at 15.50, with silver trading 0.10% lower against the USD from yesterday’s close.
The pair is expected to find support at 15.36, and a fall through could take it to the next support level of 15.22. The pair is expected to find its first resistance at 15.63, and a rise through could take it to the next resistance level of 15.77.
The white metal is showing convergence with its 20 Hr moving average and trading above its 50 Hr moving average.

Crude Oil: Oil Trading Higher, Amid Drop In Crude Inventories And Ahead Of EIA’s Weekly Crude Oil Stockpiles Data
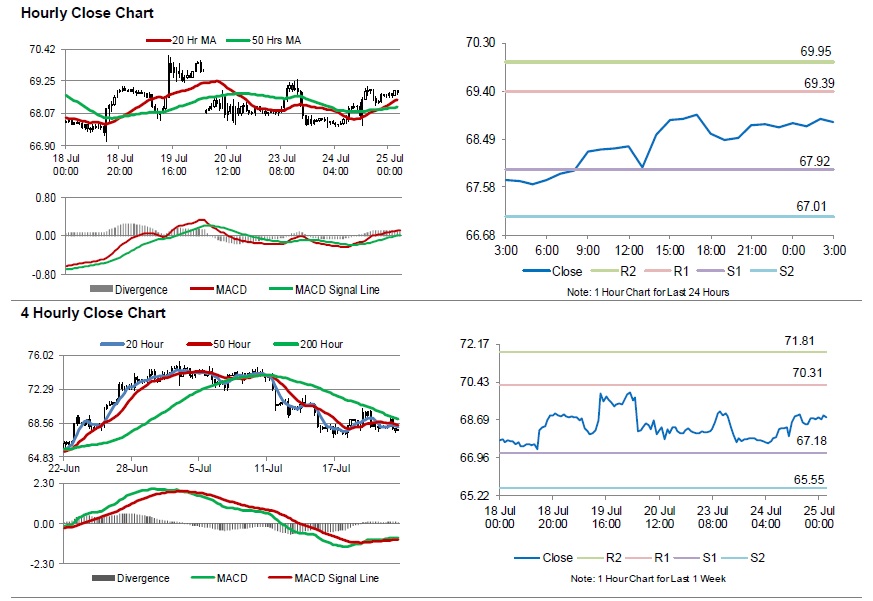
For the 24 hours to 23:00 GMT, Crude Oil rose 1.31% against the USD and closed at USD68.72 per barrel.
In the Asian session, at GMT0300, the pair is trading at 68.82, with oil trading 0.15% higher against the USD from yesterday's close, after the American Petroleum Institute (API) reported that US crude oil inventories fell more than expected by 3.2 million barrels to 407.6 million barrels in the week ended 20 July.
The pair is expected to find support at 67.92, and a fall through could take it to the next support level of 67.01. The pair is expected to find its first resistance at 69.39, and a rise through could take it to the next resistance level of 69.95.
Crude oil is trading above its 20 Hr and 50 Hr moving averages.
Market Morning Briefing: Euro Might Be Trading Quietly In Anticipation Of The ECB Meet On Thursday
STOCKS
Although the equities look bullish for the next few sessions, there are important resistances visible above current levels which may hold and bring down the prices in the medium term. There could be a rise in the equity indices in the next few sessions followed by a corrective fall.
Dow (25241.94, +0.79%) and Dax (12689.39, +1.12%) both have risen. Dax looks bullish towards resistance near 12900-13000 while Dow is trying to break above the important levels of 25250. Dow could turn bullish on a sustained rise above 25250 while Dax may come off in the longer run after testing 13000 on the upside.
Nikkei (22621.22, +0.49%) has bounced from the immediate trend support on the daily candles and could re-test higher levels of 22800-23000 in the near term.
Shanghai (2898.71, -0.24%) is stable near 2900 and has near term resistance at 2950 which could be tested in the next few sessions before coming off from there.
Nifty (11134.30, +0.45%) rose to levels above 11100 and closed higher yesterday. The index could continue to rise towards near term resistance near 11200 before seeing a short term dip from there.
COMMODITIES
On the weekly and 3-day charts, both Nymex WTI (68.80) and Brent (73.91) have risen from support levels and while the supports hold, the prices could eventually move up in the near to medium term. WTI could head towards 70-71 while Brent may also rise targeting 75-76 in the coming sessions.
Gold (1225.10) is stuck in the 1210-1240 region and while price remains below 1240, there is scope of testing 1200 on the downside. A break above 1240 initially is required for prices to gradually move up towards 1270/80 in the longer run.
Support on the 3-day candles has held well on Copper (2.8115) and while the rise sustains, medium term could see a rise towards 2.90-2.95. While above 2.70, Copper looks bullish in the longer run.
FOREX
Dollar Index (94.62): Dollar Index is respecting support on 3 day candles and could rise towards 95.0-95.5-96.0 in the next 1-2 weeks. A break below 94.1 would be required to negate an immediate rise towards 95-96.
Euro (1.1678): Euro might be trading quietly in anticipation of the ECB meet on Thursday. It could continue ranging over today-tomorrow between resistance near 1.174 and support near 1.165. Thursday could see greater volatility. A breach above 1.175 would open up higher resistance near 1.185 and a break below 1.165 would open up supports near 1.16 and lower down, near 1.145. From the Dollar Index’s forecast, it looks like Euro could weaken below 1.16 in the days ahead.
Dollar Yen (111.30): Dollar Yen continues to trade slightly above support near 111 on daily candles. Currently, we are not preferring this support to break; which implies a rise towards 112.0-112.5 in the next few sessions. On weekly candles there is resistance near 112.5 which might cap the upside. If it breaks, then higher resistance near 114 might be the upside target.
Euro Yen (129.99): As expected, Euro Yen hasn’t seen much movement. On daily candles, it could move lower towards support near 129.6 in the next 2-3 sessions.
Pound (1.3141): As per expectation, Pound has moved up slightly and could move up further towards 1.32 in the next 1-2 sessions. The 89 weeks MA (1.3115) on weekly line chart is a crucial support, whose break would confirm medium term bearishness.
Dollar Rupee (68.97): Dollar Rupee is likely to move up towards 69.30 while above 68.80.
INTEREST RATES
Speculations regarding the Bank of Japan’s policy change have also lifted German yields. German 10 year yield (0.4%) is rising towards resistance near 0.45%-0.50% on short term chart, from where it should dip in the weeks ahead. The ECB meeting tomorrow could also be an important factor for German yields. If the ECB’s policy statement has a dovish tilt, the German 10 year yield might not rise till 0.45% and may instead drop towards 0.3%-0.2% again.
The Japanese 30-5 Year yield spread (0.89%) has broken above resistance on medium term chart and could now find higher resistance near 0.92%-0.93%. Similarly, the Japanese 10-5 yield spread (0.177%) has also shot up from support and could now find resistance near 0.180%-0.185%. This suggests that the upside in longer term Japanese yields is capped near current levels.
The rise in Japanese yields had led to a steep rise in US yields as well – which was based on speculation that some Japanese insurers might have offloaded their holding of US Treasuries in response to the possible policy shift by the BoJ.
US 10 year yield (2.94%), 30 Year (3.06%), 5 Year (2.81%), 2 Year (2.64%):
As mentioned yesterday, the 2.95%-3.00% is a potent resistance zone for the 10 year yield. The longer the 10 year yield stays below this zone, the greater the chances of another correction towards 2.80%-2.75%.
Can NZD/USD Recover Further Above 0.6850?
Key Highlights
- The New Zealand Dollar formed a base near 0.6710 and moved higher against the US Dollar.
- The NZD/USD pair is attempting a close above a key bearish trend line with resistance at 0.6820 on the 4-hours chart .
- The US Manufacturing PMI in July 2018 (Prelim) increased from the last reading of 55.4 tom 55.5.
- The New Zealand Trade Balance in June 2018 posted a deficit of $113M (MoM), compared with the forecast of $200M surplus.
NZDUSD Technical Analysis
The New Zealand Dollar formed a decent bottom near the 0.6700 level against the US Dollar. The NZD/USD pair traded higher and is currently facing a couple of important resistances near 0.6840-0.6850.
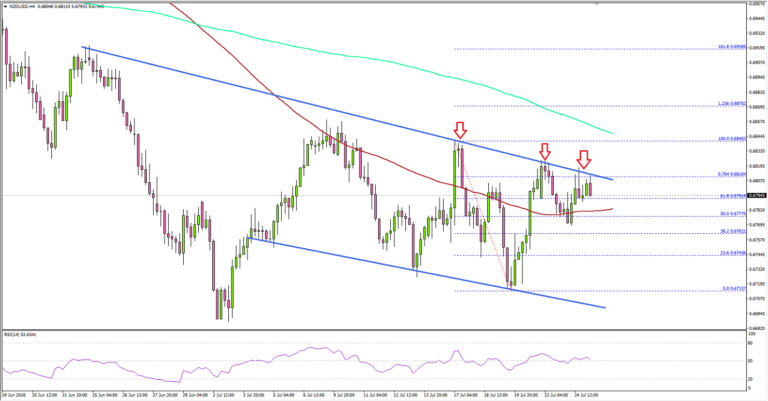
Looking at the 4-hours chart, the pair tested the 0.6720 support area on a couple of occasions, but sellers failed to gain momentum. As a result there, was a decent bounce and the pair managed to move above the 0.6760 resistance and the 100 simple moving average (red, 4-hours).
At the outset, the pair is attempting a close above a key bearish trend line with resistance at 0.6820. However, the pair needs to break the last swing high near the 0.6840 level and the 200 simple moving average (green) to move into a bullish zone.
Above 0.6840-50, the pair is likely to gain traction towards the 0.6900 and 0.7000 levels. On the other hand, if the pair fails to settle above 0.6850 and the 200 SMA, it could decline once again.
On the downside, supports are seen near 0.6765 and 0.6750. Below this last, the pair may revisit the 0.6710-20 support zone.
Recently in the US, the Manufacturing PMI for July 2018 (Prelim) was released by the Markit Economics. The market was looking for no change in the PMI from the last reading of 55.4.
The actual result was positive as there was an increase in the PMI from 55.4 to 55.5. There was a minor dip in NZD/USD, but the pair is still well supported above the 100 SMA.
Economic Releases to Watch Today
- German IFO Business Climate Index for July 2018 – Forecast 101.5, versus 101.8 previous.
- German current assessment index July 2018 – Forecast 104.8, versus 105.1 previous.
- German expectations index for July 2018 – Forecast 98.1, versus 98.6 previous.
- UK’s CBI Distributive Trades July 2018 (MoM) – Forecast 15%, versus 32% previous.
- US New Home Sales for June 2018 (MoM) – Forecast -2.8% versus +6.7% previous.