Sample Category Title
EURUSD Outlook: Positive German Data Eased Downside Pressure, EU PMI Eyed For Fresh Signals
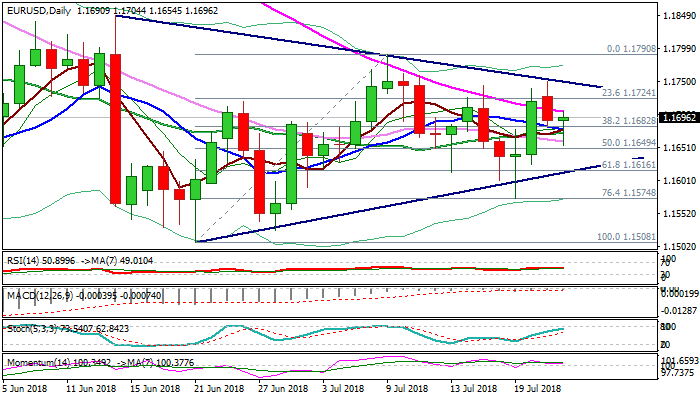
The Euro moved lower in late Asian/early European trading as dollar firmed on expectations the Fed would continue with rate hikes despite President Trump's criticism. Repeated failure at daily cloud base and bearish close on Monday (red daily candle with long upper shadow) signal the upside attempts remain limited as thick daily cloud weighs heavily and continues to cap. Fresh easing probed below a cluster of daily MA's (1.1676/60), focusing lower pivot at 1.1615 (triangle support/Fibo 61.8% of 1.1508/1.1790 upleg), break of which would generate fresh bearish signal. Weakening momentum supports the notion. Better than expected German Manufacturing PMI data (July 57.3 vs 55.5 f/c) provided relief, ahead of release of EU PMI data which are expected to ease in July, according to the forecasts (Manufacturing PMI 54.7 f/c vs 54.9 prev/Services PMI 55.0 f/c vs 55.2 prev). Weak numbers would add to negative tone and risk further easing, while upbeat figures would support and sideline existing downside risk.
Res: 1.1704, 1.1750, 1.1790, 1.1848
Sup: 1.1654, 1.1616, 1.1574, 1.1527
EUR/USD – Euro Shrugs Off Strong German, Eurozone Manufacturing PMIs
EUR/USD is hugging the 1.17 line in the Tuesday session. Currently, the pair is trading at 1.1693, up 0.01% on the day. On the release front, German and Eurozone manufacturing PMIs beat expectations, but services PMIs missed their forecasts. There are no major U.S releases. On Wednesday, German Ifo Business Climate is expected to dip to 101.6 points and U.S New Home Sales is forecast to drop sharply to 671 thousand.
Eurozone and German manufacturing PMIs continue to point to expansion. The German release improved to 57.3, easily beating the estimate of 55.5, while the eurozone reading of 55.1 was above the forecast of 54.7. Both indicators had dropped over six consecutive months and the July releases put an end to that nasty streak. With the tariff war threatening to hurt German and eurozone exports, investors have been keeping a close eye on manufacturing data. Services PMIs were not as strong, as the German and eurozone releases missed their estimates.
The U.S. dollar has steadied this week, after broad losses on Friday. Investors reacted negatively to comments by President Trump which were critical of Federal Reserve monetary policy. On the weekend, Treasury Secretary Steven Mnuchin engaged in damage control, saying at the G-20 meeting that Trump was not interfering with the Fed policy of gradually raising rates. However, investors weren’t buying Mnuchin’s apologetics, and the U.S dollar continued to lose ground in Monday’s Asian session. There was more for investors to fret over, as Trump also attacked the EU and China for manipulating their currencies and keeping interest rates lower. This has raised concerns that the current global trade tensions could be followed by a currency war. Growing concerns over the dangers of the ongoing trade war were summed up in the final communiqué from the G-20 meeting in Argentina over the weekend, which noted that “heightened trade and geopolitical tensions pose an increased risk to global growth”.
US Futures And European Under Alphabet And UBS Influence
- European banking sector is also an area of interest
- Alphabet shows a moderate slowdown in spending
- People Bank Of China would have to act to ignite the growth in China
US futures and European markets are under the influence of the earnings season. Today, it is all about Alphabet; Google is the king of the advertisement and its ad business is in full throttle. The message is clear for its investors that the company is a monster in this arena and the EU regulatory backlash hasn’t been able to damage its number in any significant way.
The internet giant reported its earning number last night and it smashed all the estimates. The crown jewel, its ads business experienced growth of 24% and its second most important lucrative business; cloud services also added a strong number. The growth in the cloud services was 37%.
When we look at the Alphabet’s earning, it makes us comfortable that there is a moderate slowdown in spending. This means that the user acquisition cost is going down. This creates a more efficient environment for revenue growth. Having said this, the company cannot afford to have reputation damage and it still needs to bring fines under-control because eventually this would add go against the Google’s values.
European banking sector is also an area of interest for investors today. Last week, we have seen some serious inflow in the iShares MSCI European Financial ETF. Investors poured a record $345 million. This is mainly on the back of the good performance from the US banks which lead them to believe that the European banks would echo the same message. European banks have the healthy balance sheet and the economic growth in the region should add value to their headline numbers.
UBS reported it's earning earlier today and it has pleased its shareholders for the second consecutive quarter by beating expectations. It reported a pre-tax profit of 569 million francs while the average estimate was for 397 million francs. However, the number for the global wealth management pre-tax profit came in at 1.04 billion francs, a little below the forecast. Another area of concern was the outflow of funds, astonishing 9 billion francs in Americas. A number of this scale threaten the company growth equation and the bank needs to pay attention to this if it wants to attract its wealthy clients.
Over in Asia, we have seen most of the markets green as the speculation picked up further popularity. Investors are of the mind frame that the People Bank Of China would have to act to ignite the growth fire in China once again. One way of doing that would be to increase the stimulus package and this could just do the trick to fade the effects of the trade war on the Chinese economy.
Back in the currency market, the euro is struggling to hold ground against the mighty dollar. The European Central Bank would be making its decision on its monetary policy on Thursday. Many in the market are expecting the bank to stick to its plan and end of the QE program. Over the years, the economic data has provided many clues for the ECB to make its decision on the monetary policy.
The Euro-area composite PMI numbers are due later today. The data has seen improvement during June and this was the first upbeat reading since this year. The forecast for the flash service PMI is for 55 and for manufacturing is 54.7
USDJPY – Rejects Lower Prices, Looks To Recover Higher
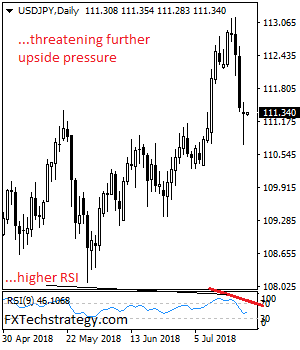
USDJPY - The pair rejected lower prices to close flat on Monday leaving risk of a move higher on the cards. On the downside, support lies at the 111.00 level where a break if seen will aim at the 110.50 level. A cut through here will turn focus to the 110.00 level and possibly lower towards the 109.50 level. On the upside, resistance resides at the 112.00 level. Further out, we envisage a possible move towards the 112.50 level. Further out, resistance resides at the 113.00 level with a turn above here aiming at the 113.50 level. On the whole, USDJPY faces further downside pressure.
The Analytical Overview of the Main Currency Pairs
The EUR/USD currency pair
Technical indicators of the currency pair:
Prev Open: 1.17261
Open: 1.16920
% chg. over the last day: -0.40
Day's range: 1.16831 – 1.16930
52 wk range: 1.0571 – 1.2557
During yesterday's trading, the EUR/USD currency pair went down. Quotations fell by more than 80 points. At the moment, the corection of the trading instrument is bserved. Local support and resistance levels are: 1.16600 and 1.17000, respectively. We recommend opening positions from these marks. The further growth of the currency pair is not excluded.
The news feed on 2018.07.24:
The index of economic activity in the manufacturing sector of Germany at 10:30 (GMT+3:00).
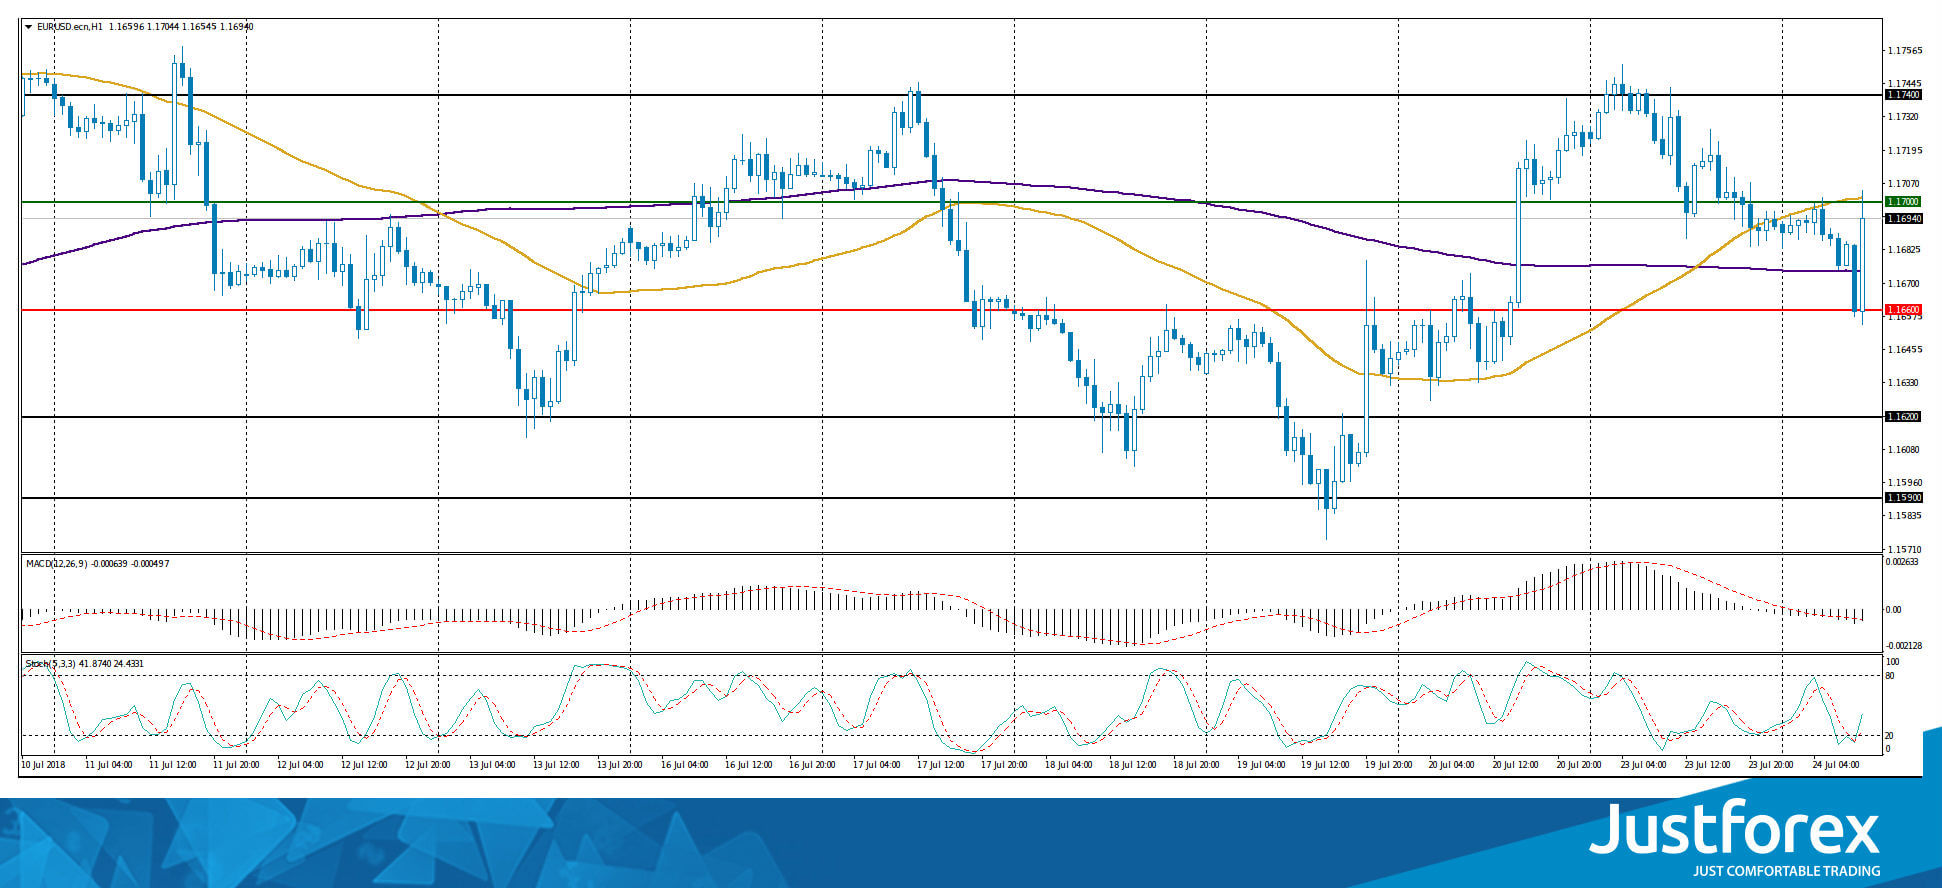
Indicators do not send accurate signals: the price has fixed between 50 MA and 200 MA.
The MACD histogram is located in the negative zone and below the signal line, which gives a strong signal to sell EUR/USD.
Stochastic Oscillator is in the neutral zone,the %K line is above the %D line, which indicates the power of the buyers.
Trading recommendations
Support levels: 1.16600, 1.16200, 1.15900
Resistance: 1.17000, 1.17400
If the price fixes below 1.16600, further decline of the EUR/USD quotations are expected to decline further. The movement is tending to 1.16200-1.15900.
Alternative option. If the price fixes above the round level of 1.17000, it is necessary to consider buying EUR/USD. The movement is tending to 1.17400-1.17600.
The GBP/USD currency pair
Technical indicators of the currency pair:
Prev opening: 1.31136
Discovery: 1.30944
Rev. % of the last day: -0.33
The daily range: 1.30965 – 1.31029
52-week range: 1.2361 – 1.4345
Yesterday, the GBP/USD currency pair went down. Quotes fell by more than 60 points. At the moment, the technical pattern is ambiguous. Investors expect additional drivers. The trading instrument is moving in the range of 1.30700-1.31200. Positions need to be opened from key levels of support and resistance.
The news feed on the UK economy is calm.
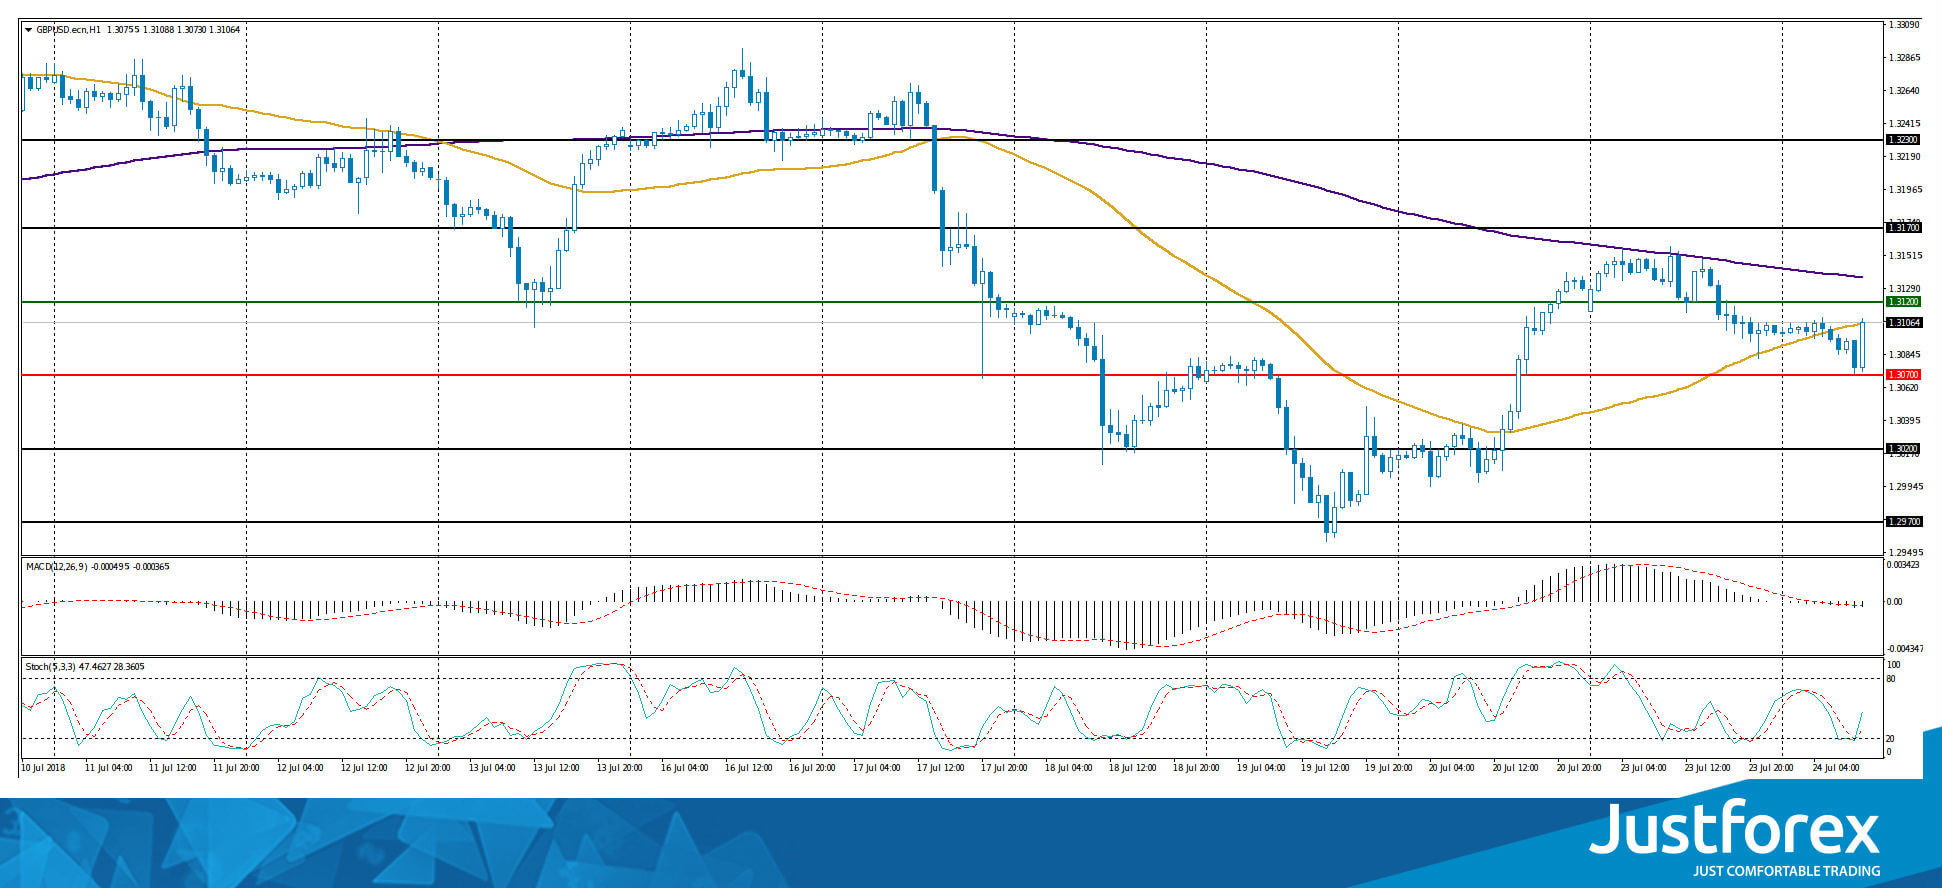
Indicators do not send accurate signals: the price is testing 50 MA.
The MACD histogram is in the negative zone and below the signal line, which sends a signal to sell GBP/USD.
Stochastic Oscillator is located in the neutral zone, the %K line is above the %D line, which also signals the purchases of GBP/USD.
Trading recommendations
Support levels: 1.30700, 1.30200, 1.29700
Resistance levels: 1.31200, 1.31700, 1.32300
If the price falls below the level of 1.30700, further decrease in the GBP/USD price is expected. The movement is tending to 1.30200-1.30000.
Alternative option. If the price fixes above the already "mirror" resistance of 1.31200, it is necessary to consider buying GBP/USD. The movement is tending to 1.31700-1.31900.
The USD/CAD currency pair
Technical indicators of the currency pair:
Prev Open: 1.31273
Open: 1.31667
% chg. over the last day: +0.39
Day's range: 1.31759 – 1.31911
52 wk range: 1.2059 – 1.3795
Yesterday, the bullish sentiment was observed on the USD/CAD currency pair. The growth of quotations exceeded 60 points. At the moment, the key support and resistance levels are: 1.31600 and 1.31900, respectively. The positions must be opened from these marks. The trading instrument is tending to grow. We recommend paying attention to the dynamics of oil quotations.
Publication of important news from Canada is not expected.
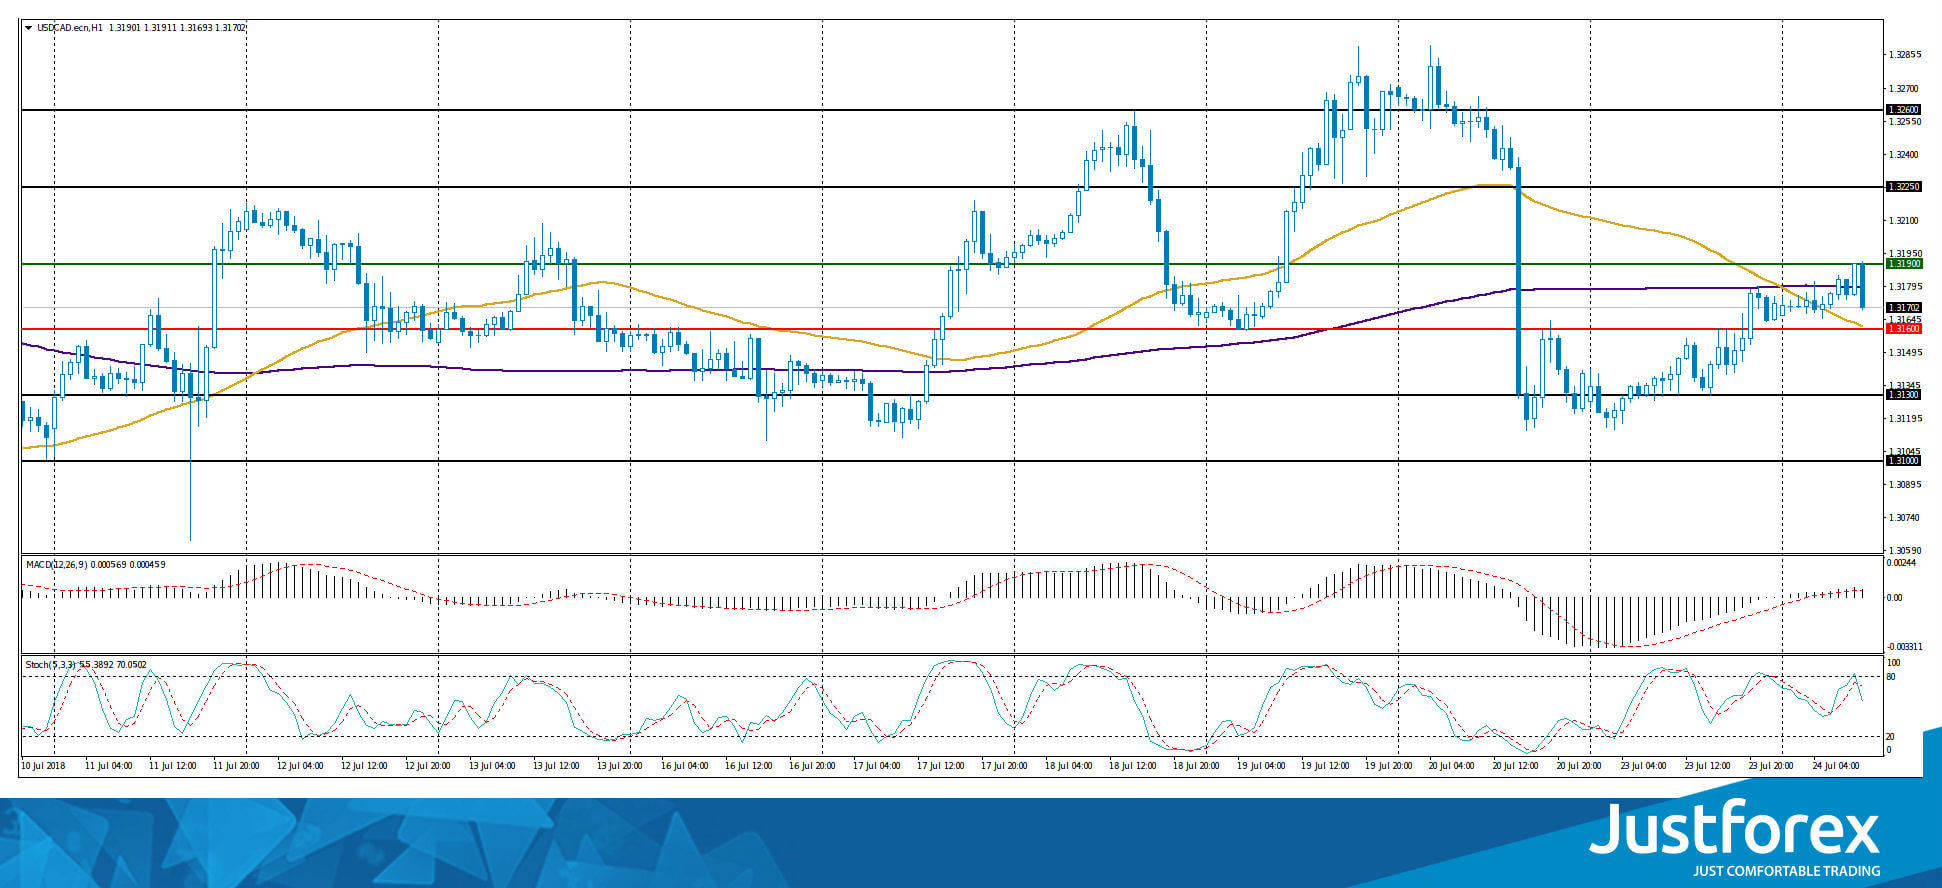
Indicators do not send accurate signals: the price has fixed between 50 MA and 200 MA.
The MACD histogram is in the positive zone and above the signal line, which gives a strong signal to buy USD/CAD.
Stochastic Oscillator is in the neutral zone, the %K line has crossed the %D line. There are no accurate signals.
Trading recommendations
Support levels: 1.31600, 1.31300
Resistance levels: 1.31900, 1.32250, 1.32600
If the price fixes below the support level of 1.31600, a decline in the currency pair is expected. The movement is tending to 1.31300-1.30000.
If the price fixes above the level of 1.31900, you need to look for entry points to the market to open long positions. The target movement level is 1.32250-1.32600.
The USD/JPY currency pair
Technical indicators of the currency pair:
Prev Open: 111.371
Open: 111.325
% chg. over the last day: +0.37
Day's range: 111.138 – 111.359
52 wk range: 104.56 – 114.74
Yesterday, the USD/JPY currency pair went up. The trading instrument grew by more than 60 points. At the moment, the technical pattern is ambiguous: quotes are moving in flat. Local support and resistance levels are: 111.100 and 111.450, respectively. We recommend opening positions from these marks. It is also necessary to pay attention to the yield of US 10-year government bonds.
The news feed on Japan's economy is calm.
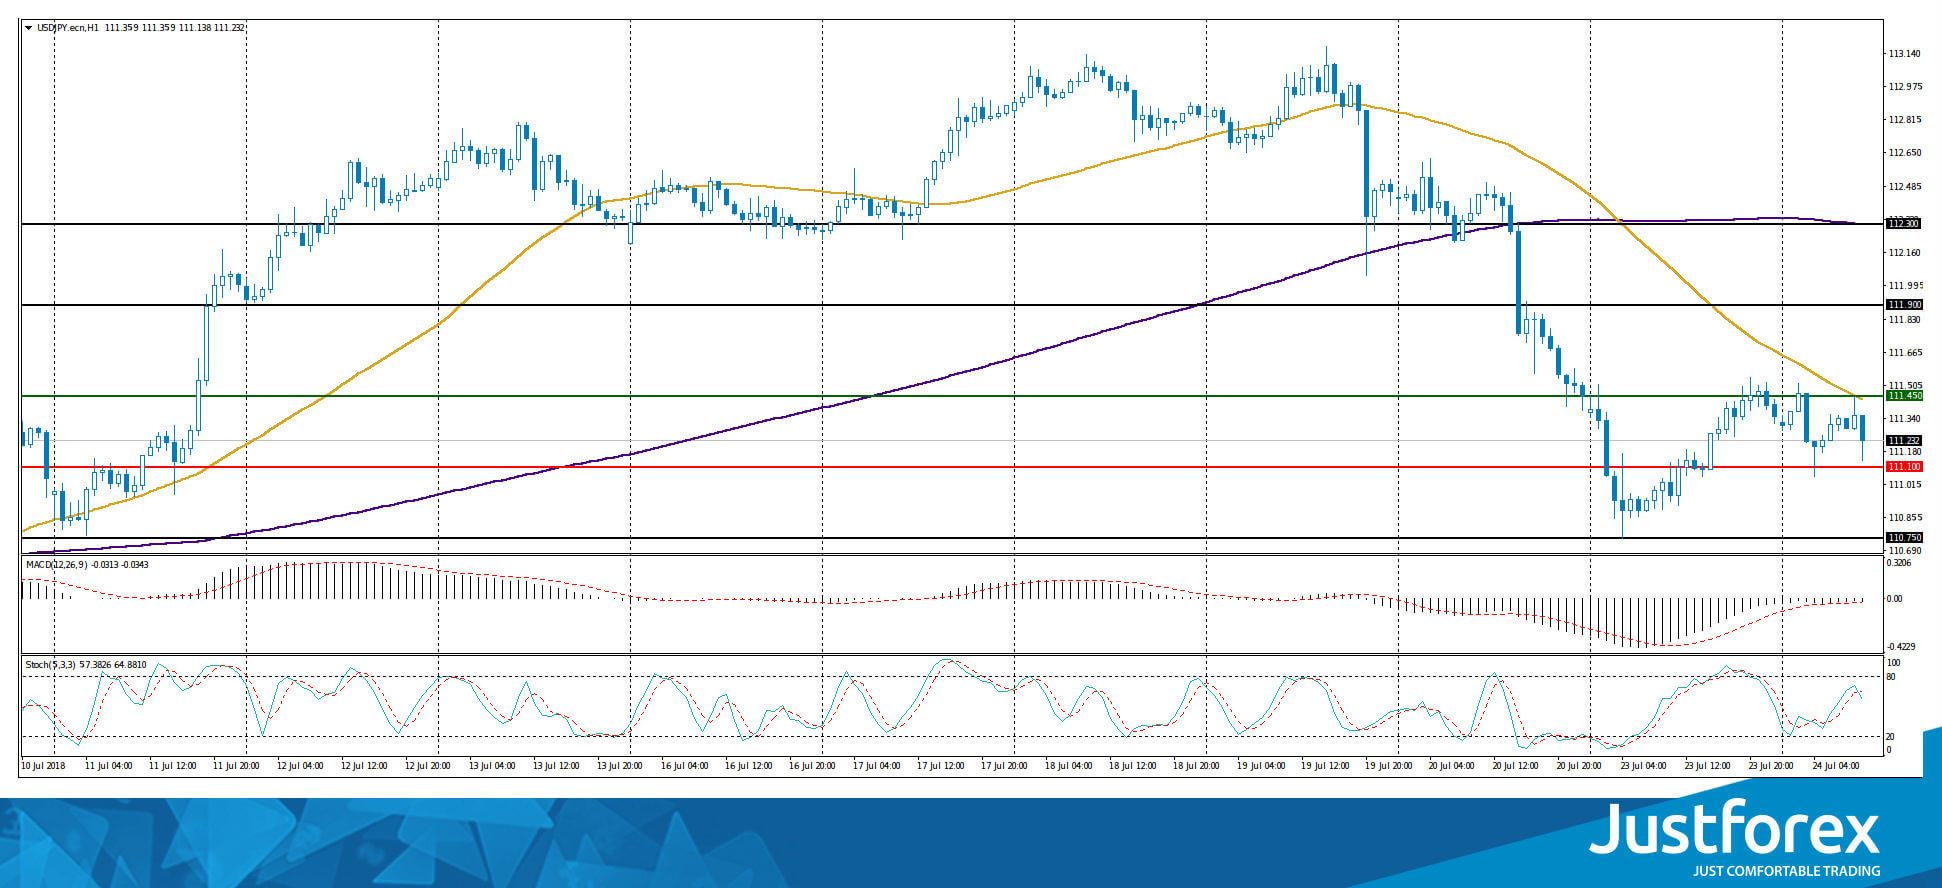
The price has fixed below 50 MA and 200 MA, which indicates the power of buyers.
The MACD histogram is in the negative zone, but above the signal line, which gives a weak signal to sell USD/JPY.
Stochastic Oscillator is located in the neutral zone, the %K line has crossed the %D line. There are no exact signals.
Trading recommendations
Support levels: 111.100, 110.750
Resistance levels: 111.450, 111.900, 112.300
If the price fixes below the 111.100 level, the USD/JPY currency pair is expected to decline. The movement is tending to 110.750-110.500.
Alternative option. If the price fixes above the level of 111.450, it is necessary to consider buying USD/JPY. The movement is tending to 111.900-112.100.
The US Dollar Has Hardened
During yesterday's trading session, the US currency stabilized against the basket of major currencies. The US dollar index (#DX) closed in the positive zone (+0.20%). Yesterday, a report on existing home sales in the US was released, which showed that in June sales fell to 5.38M, while experts forecasted the value of 5.46M. This statistic restrained the growth of the US currency.
The trade conflict between the US and China is still in the spotlight. Also, the geopolitical situation was escalated again after US President Donald Trump and Iran's President Hassan Ruhani exchanged threats and counterthreats. Ruhani warned Trump that the aggressive policy of Washington towards Tehran could lead to a full war. In response, in a tweet addressed to the President of Iran, Donald Trump advised him not to threaten the States and to be cautios.
The "black gold" prices are declining. At the moment, futures for the WTI crude oil are testing a mark of $67.75 per barrel. At 23:30 (GMT+3:00), a report on weekly stocks of crude oil according to the American Petroleum Institute will be published.
Market Indicators
Yesterday, there was a variety of trends on the US stock market: #SPY (+0.19%), #DIA (-0.07%), #QQQ (+0.32%).
The yield of 10-year US government bonds has been growing. At the moment, the indicator is at the level of 2.94-2.95%.
The news feed on 2018.07.24:
The index of economic activity in the manufacturing sector of Germany at 10:30 (GMT+3:00).
GBPUSD Dives But Is Still Above 10-Month Low Of 1.2960
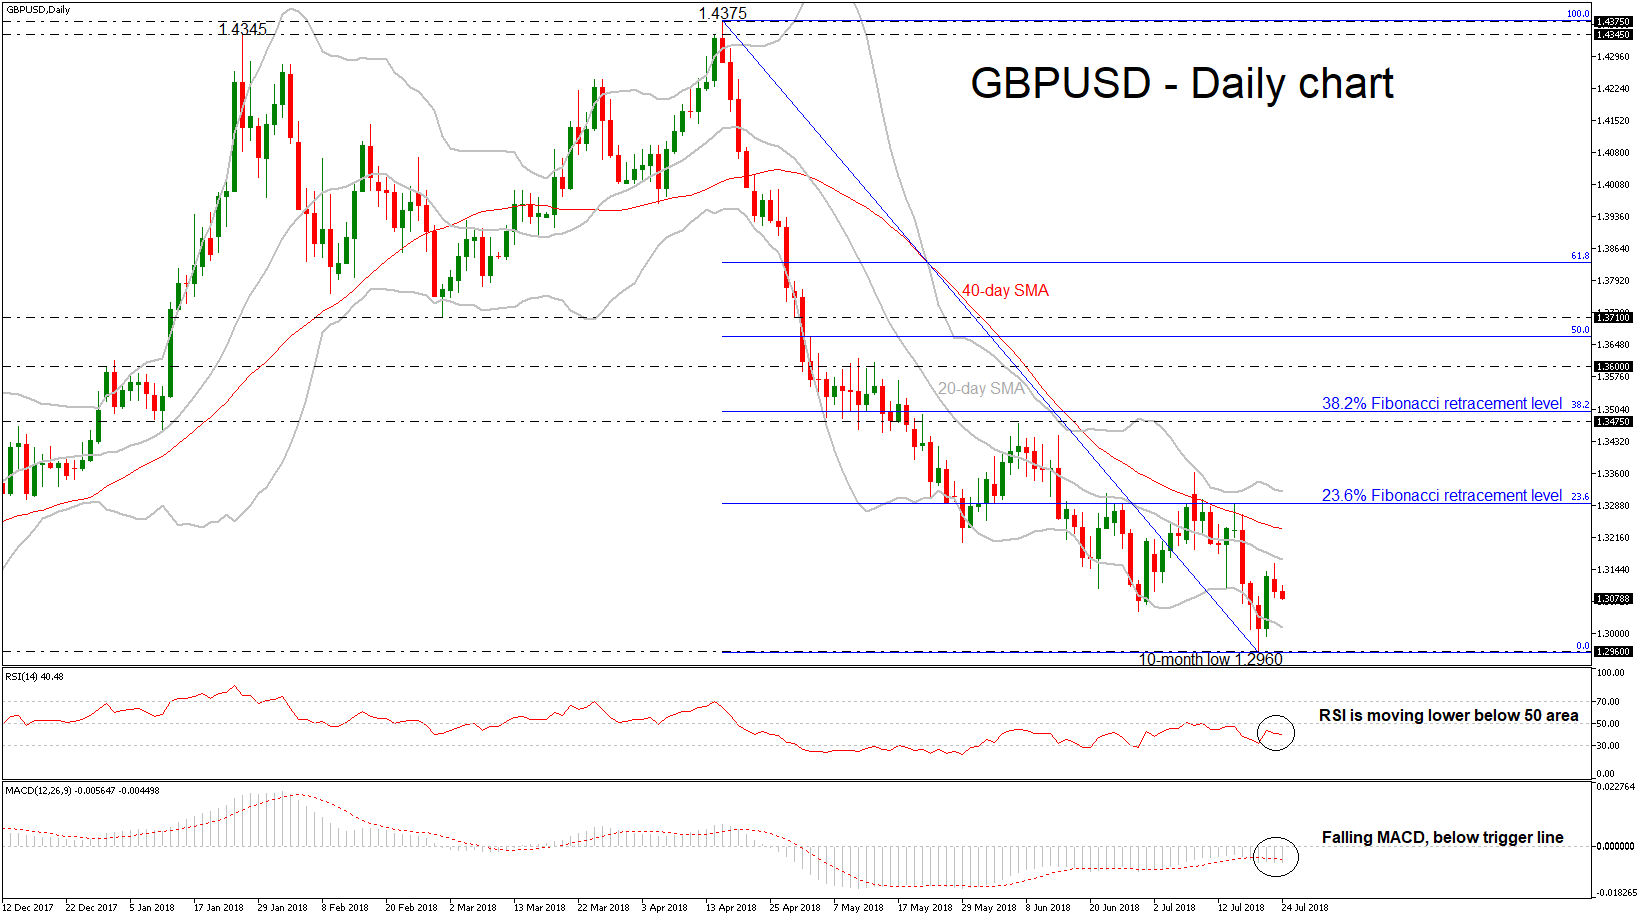
GBPUSD has been developing above the 10-month low of 1.2960 that it posted last Thursday, but with weak momentum. Moreover, the price seems to be turning negative again as it holds below the 20- and 40-simple moving averages in the daily timeframe. It is worth mentioning that the cable is still developing below the 23.6% Fibonacci retracement level of the downleg from 1.4375 to 1.2960, around 1.3290.
In the short-term, the technical indicators are recommending further downside pressure. The RSI indicator is falling with weak momentum below the threshold of 50, while the MACD oscillator is still moving below its trigger line and remains in the negative territory. Still, downside risks have not faded out yet as both indicators continue to fluctuate in bearish zones.
A further decline could find support at the lower Bollinger Band near 1.3013, where if the bearish moves appear stronger, the price could hit the 10-month low (1.2960). If the price fails to hold above this level, this would open the way towards the 1.2770 barrier, taken from the low on August 2017.
Should the price climb above the 20- and 40-SMAs of 1.3165 and 1.3233 respectively, traders would turn their focus towards the 23.6% Fibonacci of 1.3290. In case of further gains, bulls could push the pair until the 1.3475 resistance level, taken from the high on June 7, which stands near the 38.2% Fibonacci of 1.3500.
In the medium term, the neutral to bearish outlook remains intact, with the Bollinger Band appearing to follow a sideways downward movement. Having a look at the weekly timeframe, the 20-SMA posted a bearish crossover with the 40-SMA.
Yen Grinds Higher Amid BoJ Speculation, Eurozone PMIs In The Spotlight
Here are the latest developments in global markets:
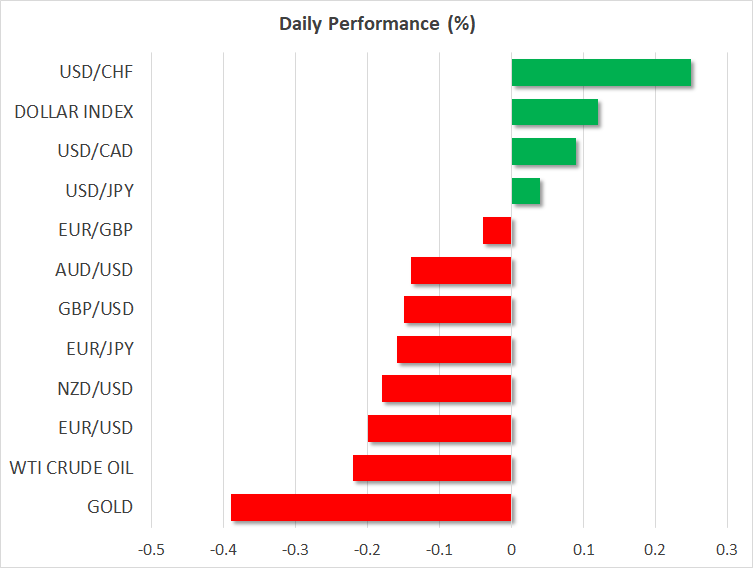
FOREX: The US dollar index advanced higher on Monday, recovering some of its Trump-induced losses as a solid rise in US bond yields increased the currency’s appeal. Heightened expectations for a very strong US GDP print for Q2, due out on Friday, may have supported the move. The yen also grinded higher, as speculation continued to mount that the Bank of Japan may alter its policy in a more hawkish direction as soon as at next week’s policy meeting.
STOCKS: US markets closed mixed on Monday, with the S&P 500 (+0.18%) and Nasdaq Composite (+0.28%) advancing, but the Dow Jones (-0.06%) edging slightly lower. Futures tracking these three indices were pointing to a flat open today. In company-specific news, the stock of Google parent Alphabet soared in after-hours trading, with futures suggesting a new record high today, as the firm reported much stronger earnings than projected. Asia was a sea of green on Tuesday, with Japan’s Nikkei 225 and Topix edging higher by 0.51% and 0.47% respectively. In Hong Kong, the Hang Seng was up by 1.39%. All European benchmarks were expected to open higher today according to futures, with the only exception being the UK FTSE 100.
COMMODITIES: Oil prices fell on Monday, giving back all the gains they posted early in the session on the back of mounting tensions between the US and Iran. The decline appeared to be driven by a combination of a stronger dollar and expectations Saudi Arabia and other major producers will continue to raise their production. WTI was down by 0.21% on Tuesday to touch $67.89 per barrel, though Brent rebounded somewhat, rising by 0.24% to $73.22. In precious metals, gold fell on Monday and is 0.38% lower on Tuesday as well amid a stronger dollar, which renders the dollar-denominated metal less attractive for investors using foreign currencies. The metal is currently trading near $1,220 per troy ounce, not far above its lows for the year at $1,211.
Major movers: Rising yields boost dollar; yen grinds higher on BoJ speculation
The US dollar edged higher against most of its major peers on Monday, with the only exceptions being the Japanese yen and Swiss franc, as a significant rise in Treasury yields boosted the appeal of the world’s reserve currency. The dollar index recovered part of the losses it posted on Friday after the US President criticized the Fed’s tightening plans, calling for fewer rates increases. Still, investors remain fairly convinced the Fed will raise rates twice more this year, with one 25bps rate hike being fully priced in already and markets assigning a 65% probability for a second one, according to the Fed funds futures.
US GDP growth in the second quarter is expected to be close to 4.5% on an annualized basis, models like the Atlanta Fed GDPNow suggest, something likely playing a large role in fueling expectations for quicker Fed hikes and hence supporting the dollar. The first estimate of GDP for Q2 is due out on Friday. Recent media reports indicate the White House is touting a number even higher, around 5%.
The Japanese yen was another notable mover, gaining across the board amid speculation the Bank of Japan (BoJ) may tweak its policy in a more hawkish direction at its policy gathering next week. The BoJ is currently keeping yields on longer-dated Japanese bonds capped at 0.10%, something that renders the yen less attractive from a relative interest rates perspective. Recent reports suggest policymakers may raise that yield target ceiling slightly, perhaps by 2bps to 0.12%, which could spark some repatriation of Japanese funds from abroad, thereby strengthening the yen. That being said, it remains questionable whether the Bank will actually proceed with tweaking its policy so early, particularly considering that the inflation outlook in Japan remains subdued.
Day ahead: Eurozone PMIs due; Markit’s US manufacturing PMI also out
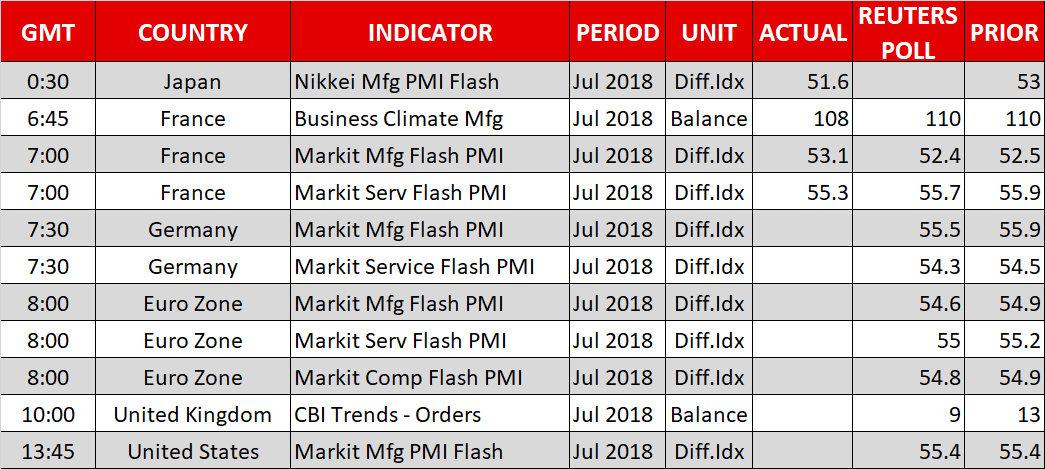
The main releases out of Tuesday’s calendar pertain to the eurozone’s flash PMIs for the month of July.
At 0800 GMT, the eurozone will see the release of flash PMI figures for the manufacturing and services sectors, as well as the composite measure the blends the two. All three prints are anticipated to weaken a bit relative to their respective June readings, though overall they’re expected to paint a mostly steady picture of economic activity. Moreover, they’re all projected to comfortably remain above the 50 threshold that separates sectoral expansion from contraction. It is notable that if the manufacturing PMI indeed declines, this would mark its seventh straight monthly fall. Meanwhile, the numbers might attract additional interest than usual, given they come out two days before the ECB’s meeting on monetary policy.
Germany, the eurozone’s largest economy, will see the release of its corresponding PMI figures at 0730 GMT; its numbers might be viewed as a preamble for what is to follow in terms of the euro area release. France’s respective prints were made public at 0700 GMT. A miss was delivered on the services front and a data beat on the manufacturing front; the euro initially fell a bit before recovering its losses.
Out of the UK, the Confederation of British Industry’s industrial orders data for July is due at 1000 GMT, with the monthly orders balance expected to ease to +9 in July, after jumping to +13 in June.
Markit’s US flash manufacturing PMI for July will be hitting the markets at 1345 GMT. It is forecasted to remain steady at 55.4.
In equities, 3M, AT&T, Verizon, and Harley-Davidson are among companies releasing quarterly results today; AT&T will be reporting after the market close, with all others releasing results before the opening bell on Wall Street.
In energy markets, weekly API data on US crude stocks due at 2030 GMT may give some short-term direction to oil prices.
Technical Analysis: EURUSD moderately bearish in the short-term
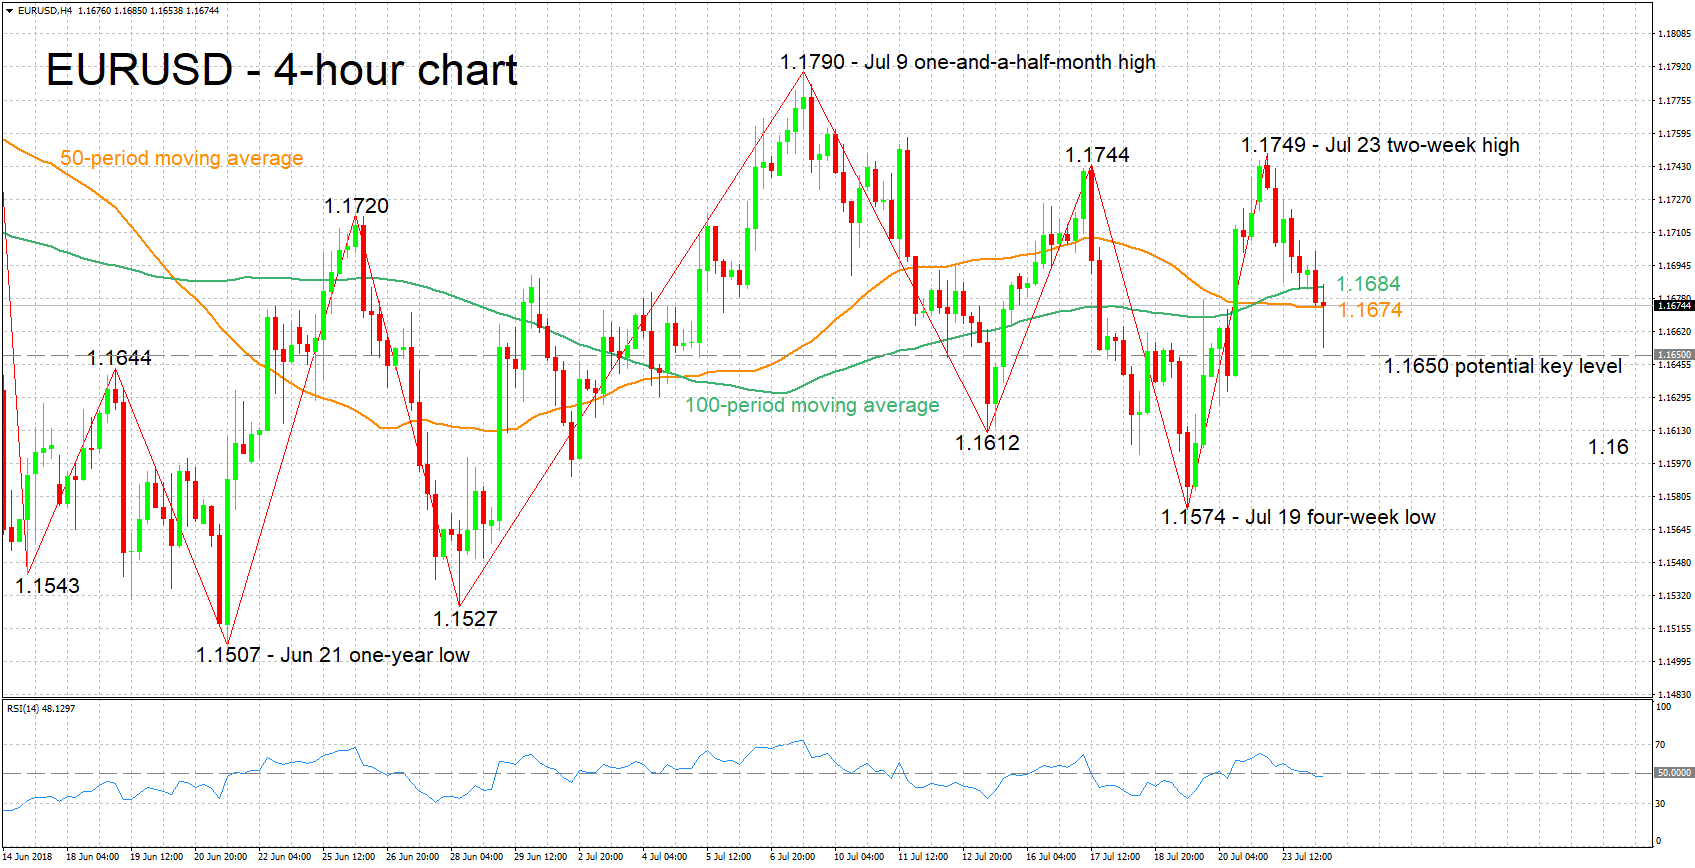
EURUSD has lost ground after touching a two-week high of 1.1749 on Monday. The declining RSI is projecting a bearish picture in the short-term, though the negative bias does not appear strong – the indicator is only moderately negatively sloped.
Upbeat eurozone PMI readings are anticipated to boost the pair. An initial line of resistance seems to be taking place around the current levels of the 50- and 100-period moving average lines at 1.1674 and 1.1684 correspondingly, with the area around them also encapsulating the 1.17 round figure. Further above, yesterday’s two-week high of 1.1749 would increasingly come into view.
Conversely, weaker-than-expected readings are likely to push the pair lower. The region around 1.1650 was congested in the past and may provide support. Steeper losses would start bringing into scope the 1.16 handle.
Markit’s manufacturing PMI release for the US can also move the pair.
XAUUSD Intraday Analysis
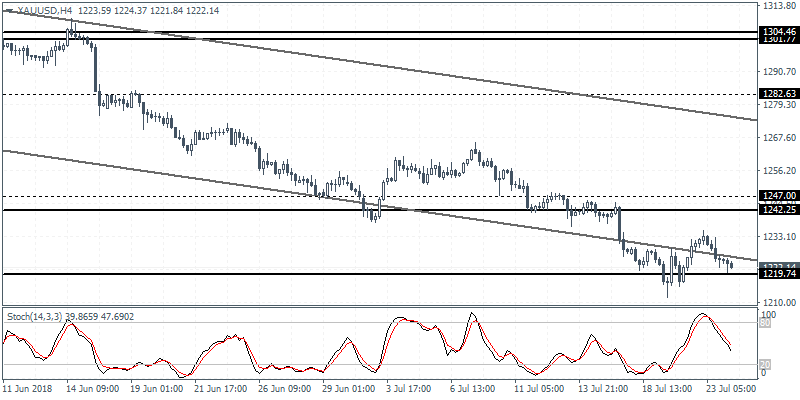
XAUUSD (1222.14): Gold prices posted a modest rally but price action was seen easing back again. As gold prices approach the support level of 1219, we could anticipate a possible bottom in the making. Failure to reverse around this level will see further losses being extended. To the upside, price action will need to break past the previously established highs in order to rise to the resistance level at 1242.25.
USDJPY Intraday Analysis
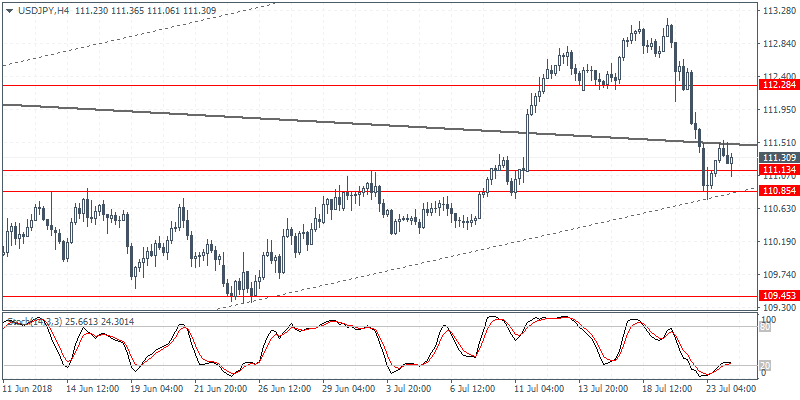
USDJPY (111.30): The USDJPY currency pair extended losses as price action was seen trading near the support region of 111.13 - 110.85. The consolidation at this level could see the declines continuing to extend lower. A breakdown below the support could push USDJPY lower with the next support seen at 109.45. To the upside, price action is seen struggling to breakout to the upside after breaching the trend line. Any gains are likely to stall back bear the 112.28 resistance provided USDJPY breaks past the previous local highs.