Sample Category Title
EURUSD Trading Below Breakout Area
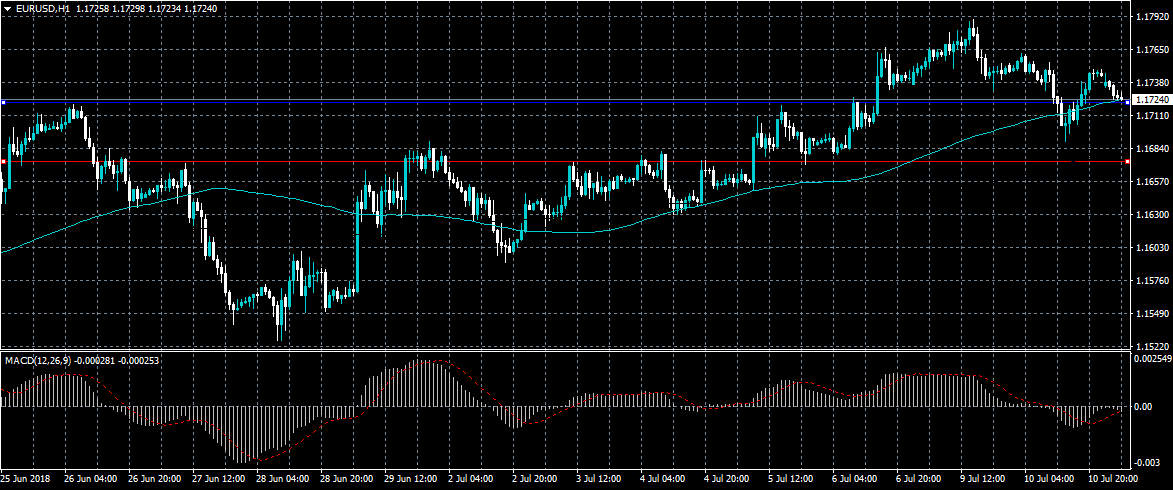
The euro has fallen towards the 1.1700 level against the US dollar, after intraday buyers failed to hold price above the key 1.1724 level. The EURUSD pair has also come back under pressure as the US dollar index starts to move back towards Tuesday’s trading-high. Sellers will target further losses below the 1.1674 level, while buyers will look to reclaim the 1.1724 level.
The EURUSD pair is intraday bearish while trading below the 1.1724 level, key support is now found at the 1.1674 and 1.1638 levels.
If the EURUSD pair moves back above the 1.1724 level, buyers may test back towards the 1.1750 and 1.1800 levels.
GBPUSD Falling Below Key Daily Support
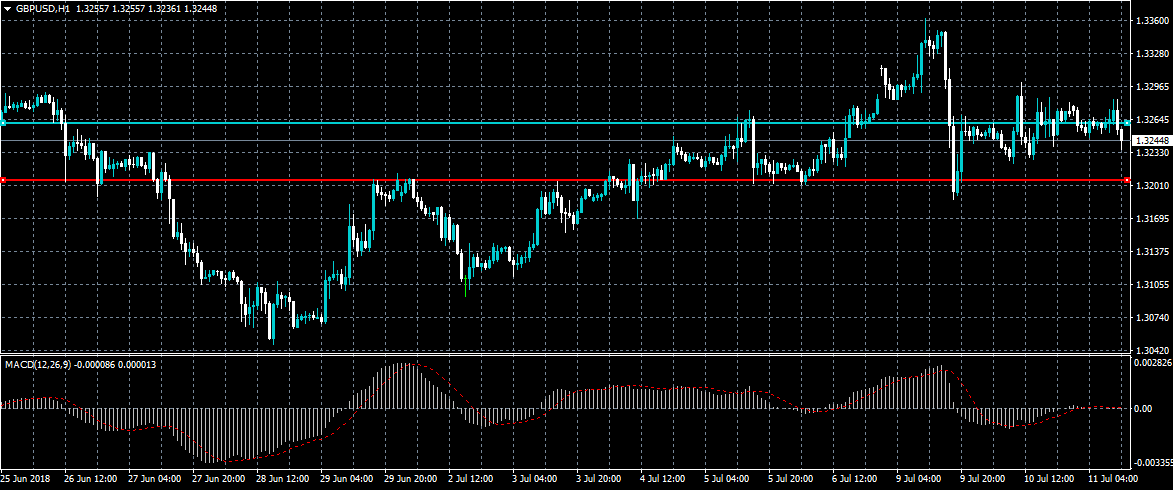
The British pound has fallen below key daily support against the US dollar as buyers failed to move price back above the 1.3300 level. The GBPUSD pair has also started to come under pressure as the greenback recovers higher, after slipping back towards the 94.00 level on Tuesday. Sellers will continue to press for losses below the 1.3205 level, while buyers will look to reclaim the key 1.3255 level.
The GBPUSD pair is bearish while trading below the 1.3255 level, key support is found at the 1.3205 and 1.3142 levels.
If the GBPUSD pair starts to trade above the 1.3255 level, buyers are likely to test towards the 1.3280 and 1.3300 levels.
Forex Analysis: Copper
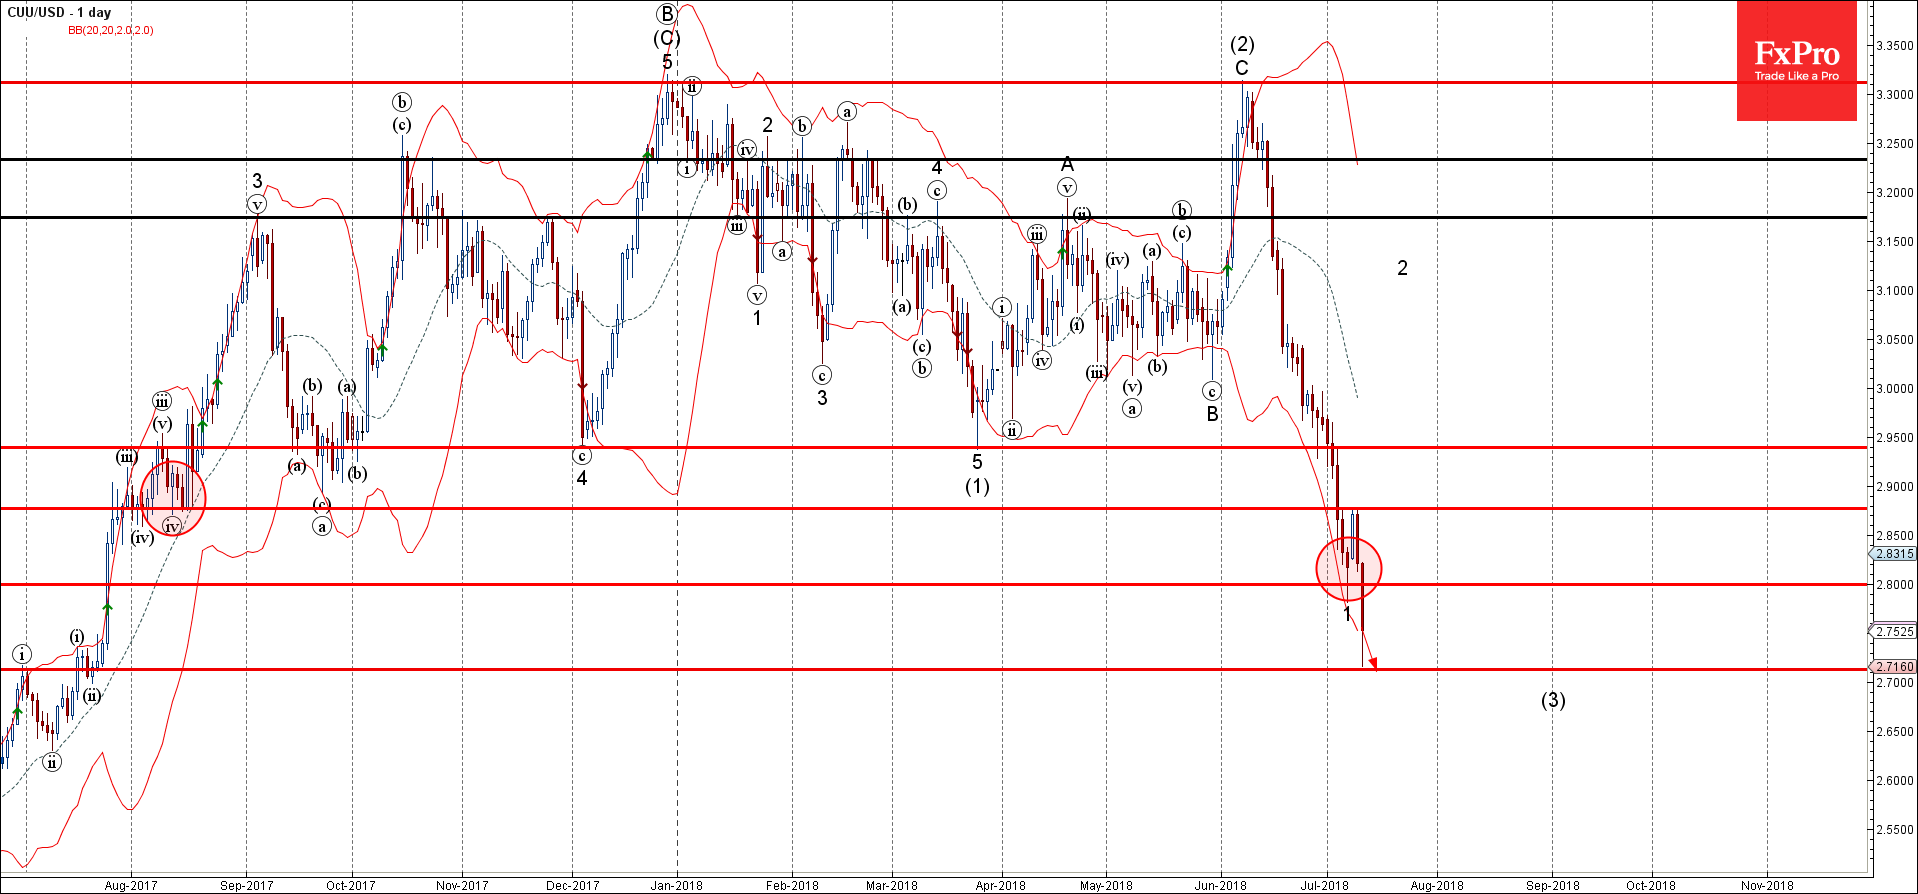
Copper broke support level 2.8000
Likely to fall further
Copper continues to fall after the earlier breakout of the support level 2.8000, which reversed the previous sharp minor impulse wave 1 with the daily Hammer at the start of July.
The breakout of the support level 2.8000 strengthened the bearish pressure on this currency pair – accelerating the active medium-term impulse wave (3) from the start of June.
Copper is likely to fall further and re-test the next support level 2.7000 (forecast price calculated for completion of the active impulse wave (3)).
Forex Analysis: USDCAD
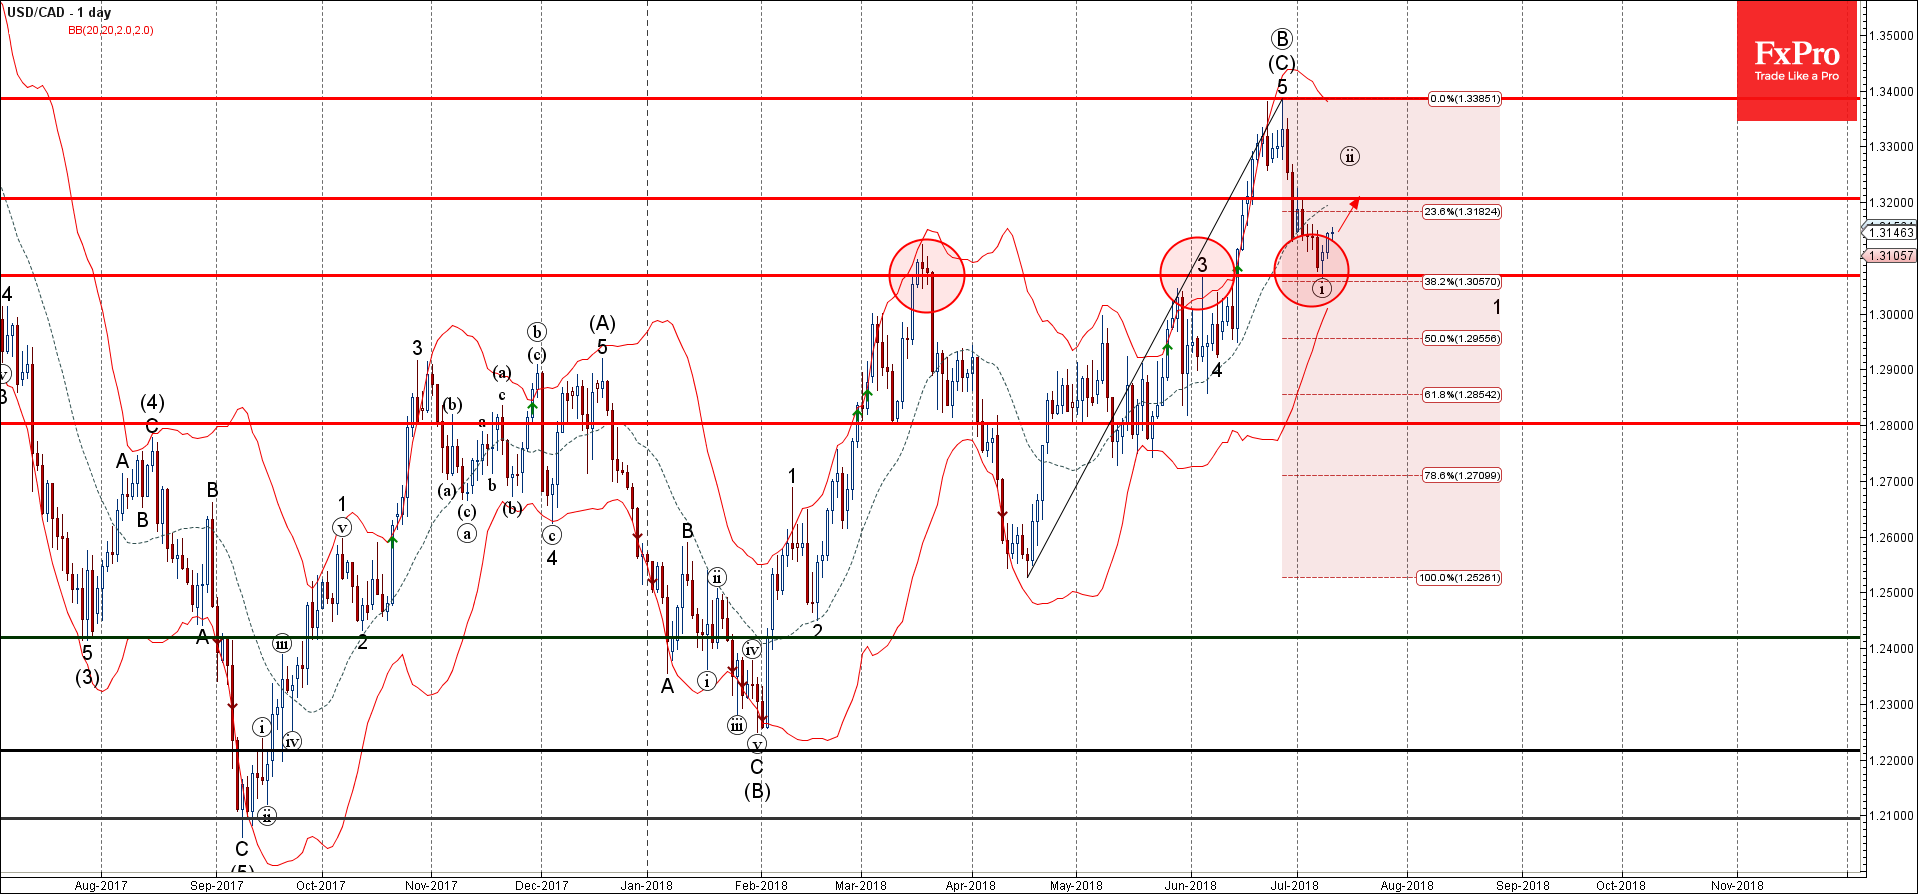
USDCAD reversed from support zone
Likely to rise further
USDCAD recently reversed up from the support zone lying between the powerful support level 1.3070 (former major resistance level which reversed the price sharply in March and June, as can be seen from the daily USDCAD chart below).
The upward reversal from this support zone created the daily Japanese candlesticks reversal pattern Morning Star – which started the active corrective wave (ii).
USDCAD is likely to rise further and re-test the next resistance level 1.3200 (which reversed the price at the start of July).
Forex Analysis: EURCAD
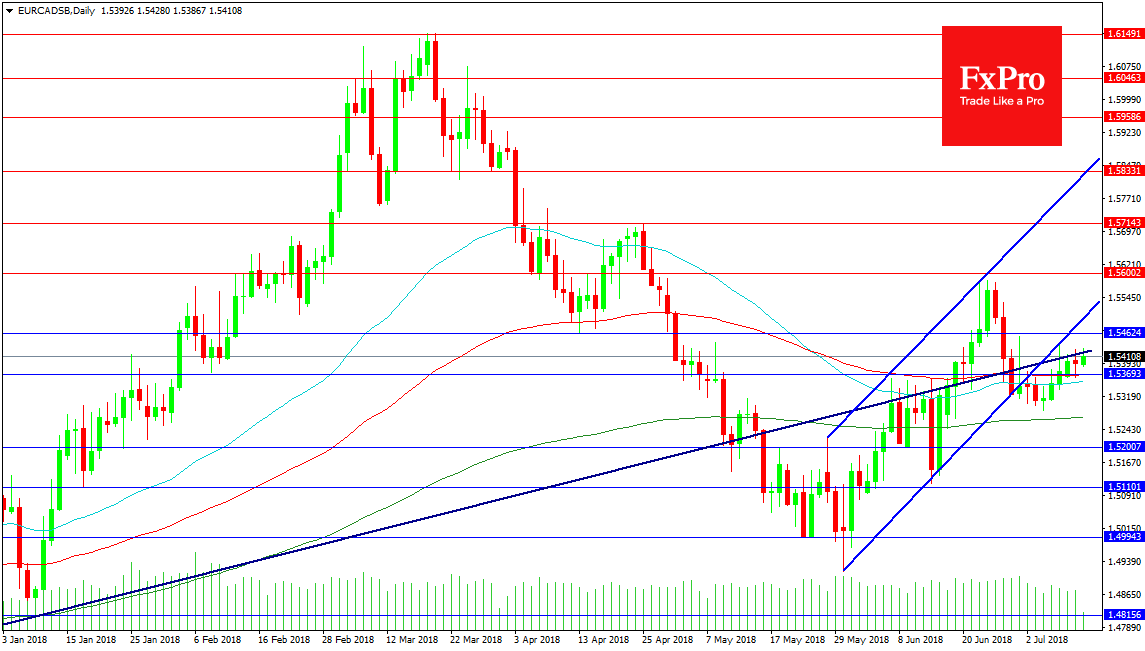
The EURCAD pair is in a precarious position at the moment with trading restricted by the resistance trend lines overhead and supported by moving averages underneath. The BOC rate decision will be released this evening and this can impact the pair substantially with these nearby technical levels weakened as a result. In this regard we need to broaden our view and look further out for technical levels. Support can be found at the 200 DMA at 1.52712 followed by the 1.52000 area. A break under here could move to test 1.51100 or the swing low at 1.51180. Below this area is the 1.50000 round number and the 1.49943 support area with the summer low at 1.49160.
Resistance at a previous swing low of 1.54624 can see price action today with the recent channel bottom acting at 1.54936. A break above that area would see 1.56000 tested followed by 1.57145 if the move is successful. This would lead to 1.58330 and the channel top at that level. A break higher over the coming weeks would lead to a retest of 1.59000 followed by 1.60000 and the 2018 high at 1.61500.
Forex Analysis: US 30 Index
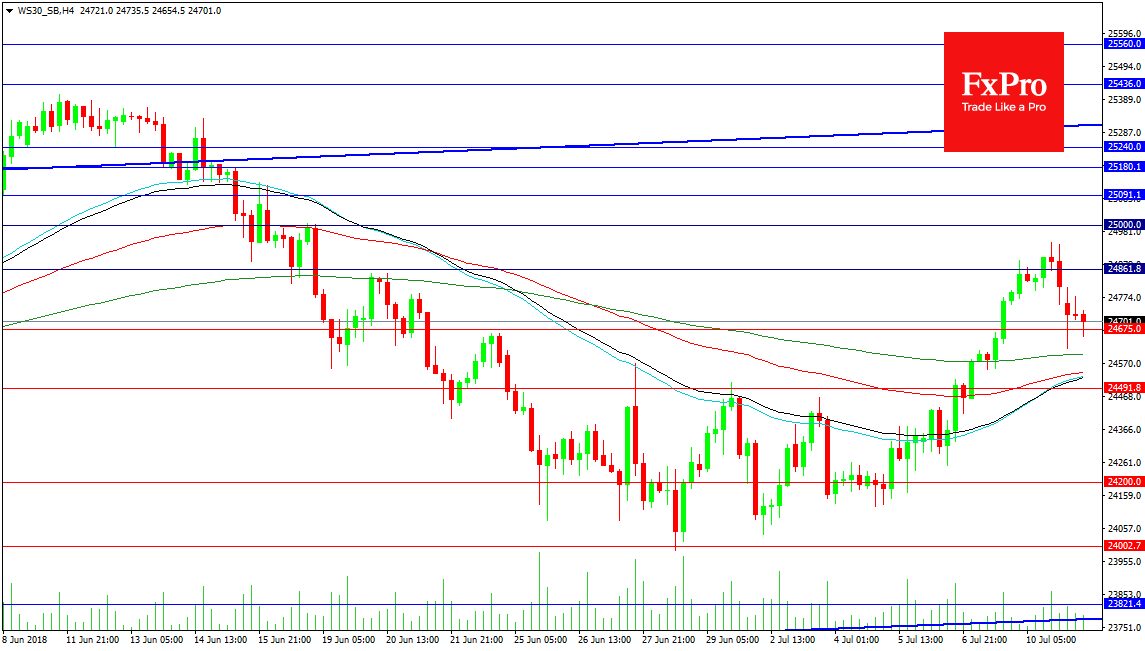
The Industrial index performed well on the back of Nonfarm payrolls on Friday but was hard hit by US President Trump’s announcement of an additional $200B in tariffs on China last night. This has ended the leg higher that was built from 24000.00 with price now testing down to the 200DMA at 24600.00. The 100 DMA comes in at 24540.00 with the 50 DMA at 24525.00 and a loss of this area could see a dip through 24500.00 to 24360.00. Further bearish price action can result in a fall to 24200.00 and the low at 24000.00. A break of the long term trend line support at 23770.00 can open the way for a deeper correction.
Earnings are kicking off at the moment with Friday an important day for financials. It is possible that good earnings can allay trade war fears and push price higher with yesterday’s high a key area to keep in mind at 24945.00. A break higher would see a test of 25000.00. This is a crucial level for traders which would confirm the base is intact providing a steady advance is maintained. The 25150.00 area is important in this regard with a move to the rising trend line resistance at 25300.00 and the recent highs at 25400.00 supported from this level.
Technical Analysis: Bitcoin And Ethereum
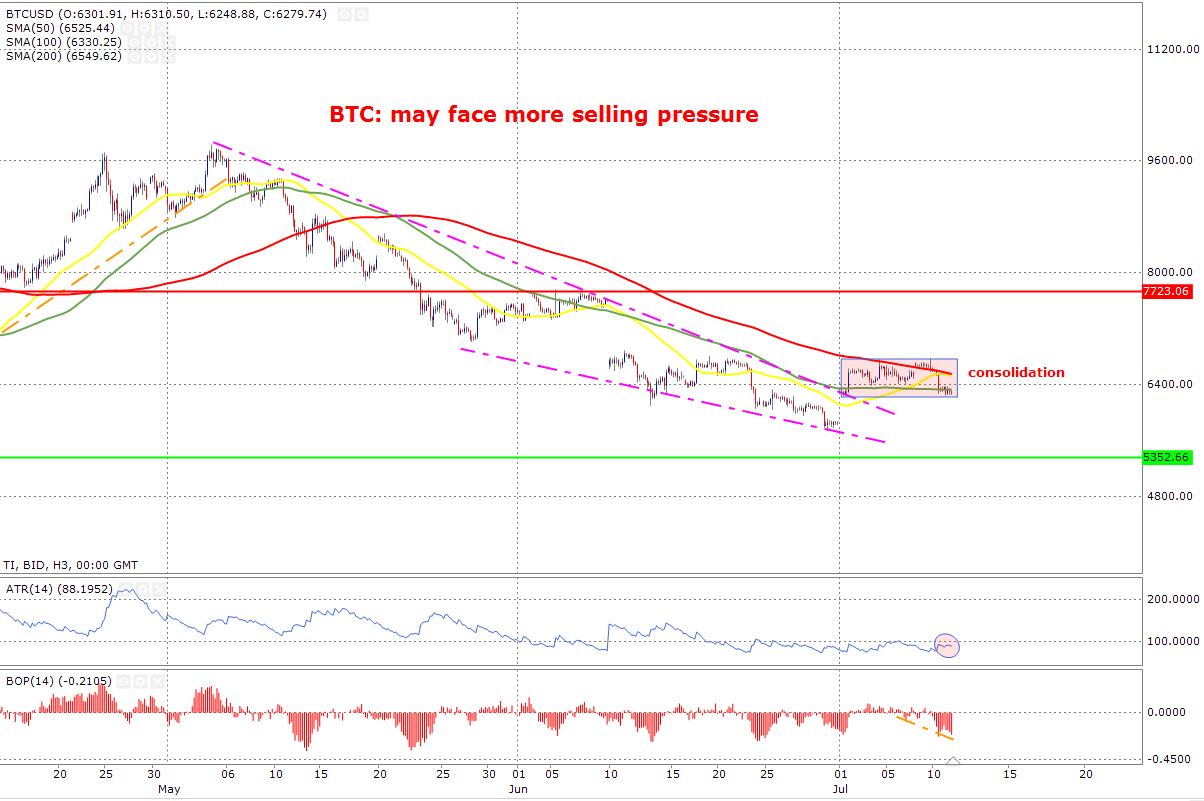
BTC: may face more selling pressure
Consolidation continues for BTC and the average true range has dropped to less than $100. The period line for the average true range is 14. This tells us that another major move is about to happen because the price is consolidating and the ATR is close enough to its bottom. The moving averages are telling us that the odds are stacked in favour of a downward move and the BOP confirms that argument.
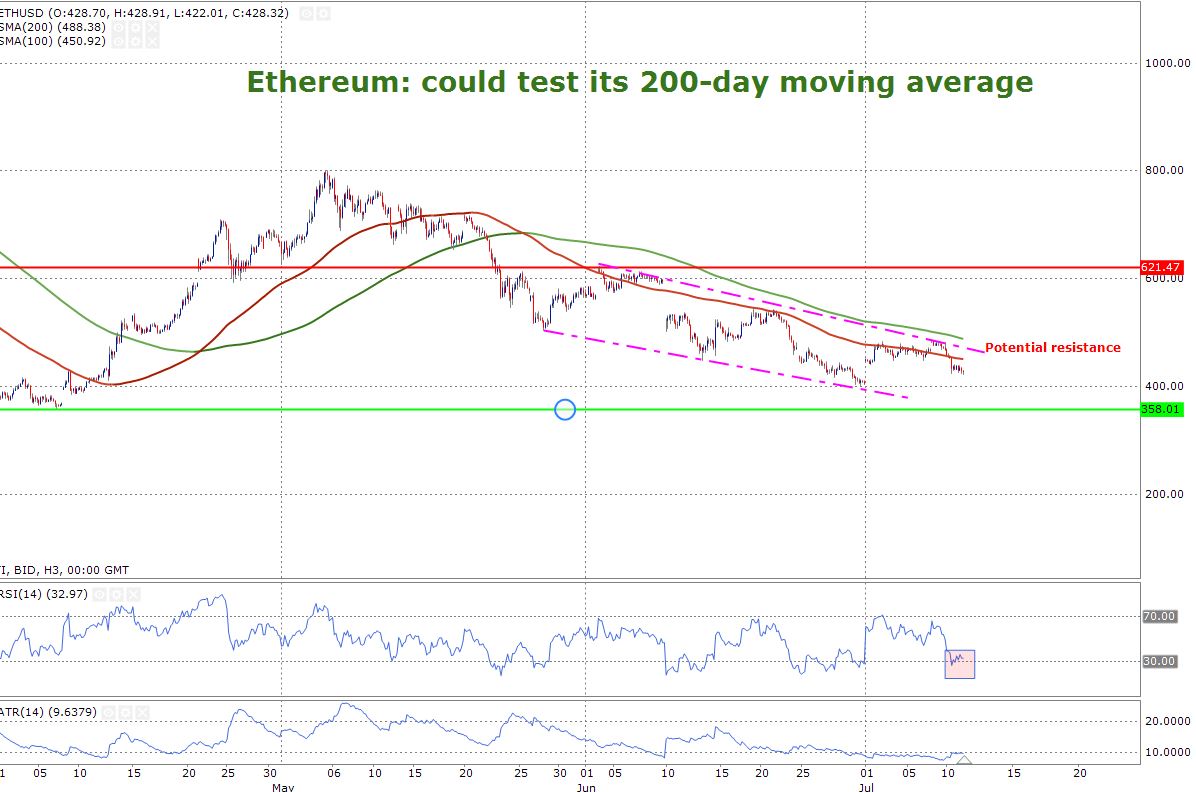
ETH: divergence in play, upward move may take place
The price is trading in a channel format- to some extent. While the price is firmly below the 100 and 200-day moving average, the RSI needs attention. The relative strength index is, an oscillator is giving an oversold reading. There is also a divergence between the price and the RSI. This confirms that we may see the price moving higher and test the strength of the moving averages.
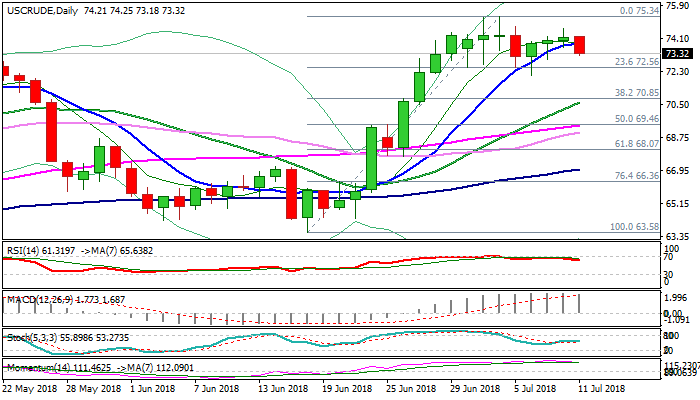
WTI Oil Outlook: Negative Sentiment On Trade War Fears/Libya Offsets Positive Impact From Strong Draw In Oil Inventories
WTI oil price moved lower on Wednesday on concerns that renewed trade war threats could depress demand, with negative sentiment being additionally boosted by news that oil exports from Libya would return to normal levels after being reduced in past couple of months.
Stronger than expected fall in US crude inventories (API report on Tuesday showed fall of 6.8 million barrels, well above 4.5 million barrels draw last week) did little to support oil prices.
Negative near-term outlook is supported by south-turned daily RSI and slow stochastic as today’s weakness retraced over a half of $72.13/$74.67 recovery leg.
Bears hit session low at $73.18 where base of thick hourly cloud offered footstep and break here and nearby Fibo support at $73.10 (Fibo 61.8% of $72.13/$74.67) would generate bearish signal and re-expose key near-term support at $72.13 (06 July trough).
Broken 10SMA offers resistance at $73.86 which is expected to cap and maintain fresh bearish bias.
Focus turns towards release of EIA weekly crude stocks report, due later today. Inventories are forecasted to fall by 4.48 million barrels, compared to last week’s 1.24 million barrels build.
Res: 73.86, 74.25, 74.78, 75.34
Sup: 73.18, 72.52, 72.13, 70.85
Global Markets Decline As The US Plans To Move Ahead With $200B Additional Tariffs On China
Notes/Observations
- Global Indices fall as the Trump administration moves ahead with plans to impose a further $200B in tariffs on China
- Fox increases bid for UK broadcaster Sky in battle with Comcast
Asia:
- Asian Indices traded sharply lower as the US announced proposed additional $200B in tariffs on Chinese goods, China reiterates it will take counter actions
- China Mofcom responded by saying it cannot accept the proposed tariff, noting it would harm China, the World and itself
- Japan May Machinery order beats forecasts falling less than expected
Europe:
- European Indices trade sharply lower across the board, Burberry, Microfocus, Indivior, Deutz among the worst performers.
- Fox raises bid for Sky to £14.00 share as it continues its bidding war with Comcast
Economic Data:
- (SE) Sweden May PES Unemployment Rate: 3.7% v 3.5% prior
- (RO) Romania June CPI M/M: 0.0% v 0.5% prior; Y/Y: 5.4% v 5.4% prior
- (MY) MALAYSIA CENTRAL BANK (BNM) LEAVES OVERNIGHT POLICY RATE UNCHANGED AT 3.25%; AS EXPECTED
- (CZ) Czech June CPI M/M: 0.4% v 0.3%e; Y/Y: 2.6% v 2.5%e
- (CN) China Jun auto sales at 1.87M, +2.3% y/y CAAM
Fixed Income Issuance:
- Italy Debt Agency (Tesoro) sells €6.0B vs. €6.0B indicated in 12-month Bills; Avg Yield: 0.337% v 0.55% prior; Bid-to-cover: 2.01x v 1.95x prior
SPEAKERS/FIXED INCOME/FX/COMMODITIES/ERRATUM
Equities
- Indices [Stoxx50 -1.1% at 3,437, FTSE -1.3% at 7,589, DAX -1.2% at 12,454, CAC-40 -1.0% at 5,377; IBEX-35 -1.1% at 9,782, FTSE MIB -1.5% at 21,727, SMI -1.1% at 8,670, S&P 500 Futures -0.8%]
- Market Focal Points/Key Themes: European indices opened lower across the board; trade concerns back in focus, impacting risk sentiment; focus on NATO meeting in Brussels; materials components most impacted; consumer discretionary supported; Sky receives raised offer from Fox; Burberry reported results, dragging on luxury stocks; earnings expected in the upcoming US session include MSC Direct, Fastenal and AngioDynamics
Equitie
- Consumer discretionary: Beneteau BEN.FR -13.7% (results), Beter Bed BBED.NL +8.4% (analyst action), Burberry BRBY.UK +1.2% (results), Lagardere MMB.FR +1.3% (analyst action), SKY SKY.UK -1.1% (Fox raised offer)
- Energy: Fred Olsen FOE.NO -9.5% (results), OMV OMV.AT -3.3%(production update), Spie SPIE.FR +2.0%(analyst action)
- Industrials: CNH Industrial CNHI.IT -3.7% (analyst action), Deutz DEZ.DE -4.7% (results), Jenoptik JEN.DE -2.8% (acquisition, outlook)
- Healthcare: Indivior INDV.UK -32.4%(outlook), Idorsia IDIA.CH -5.5% (share issue)
- Materials: Eramet ERA.FR -6.1% (extends MDL takeover period)
Speakers
- (US) President Trump: Germany is totally controlled by Russia; NATO deal is unfair to us; Because of me NATO has been raising money
- (CN) China Foreign Ministry spokesperson Hua Chunying: Reiterates it will take counter measures; says its war between strong power and rules
Currencies
- The Japanese yen rallied on trade-war concerns
- Yuan leads currency drop as Trump raises trade heat, offshore Yuan extending drop to as much as 0.74% at 6.6997 against the dollar.
Fixed Income
- (IT) Italy Debt Agency (Tesoro) sells €6.0B vs. €6.0B indicated in 12-month Bills; Avg Yield: 0.337% v 0.55% prior; Bid-to-cover: 2.01x v 1.95x prior
- Bund Futures trade 36 ticks higher at 162.74 following the move in Treasuries. Upside targets 163.25 followed by 163.85, while a return lower targets the 159.75 level.
- Gilt futures trade at 123.11 higher by 26 ticks as UK cabinet exits weigh on sterling. Support continues stands at 121.75 then 120.25, with upside resistance at 123.85 then 124.25.
- Wednesday's liquidity report showed Tuesday's excess liquidity fell from €1.878T to €1.868T. Use of the marginal lending facility rose from €26M to €31M.
- Corporate issuance saw no issuance
Looking Ahead
- 06:00 (PT) Portugal Jun Final CPI M/M: No est v 0.1% prelim; Y/Y: No est v 1.6% prelim, CPI EU Harmonized M/M: No est v 0.1% prelim; Y/Y: No est v 2.0% prelim
- 07:00 (US) MBA Mortgage Applications w/e July 6th: No est v % prior
- 07:00 (BR) Brazil July IGP-M Inflation (1st Preview): No est 1.5% prior
- 08:00 (RO) Romania Central Bank (NBR) Jun Minutes
- 08:05 (UK) Baltic Dry Bulk Index
- 08:30 (US) Jun PPI Final Demand M/M: 0.2%e v 0.5% prior; Y/Y: No est v 3.1% prior, PPI Ex Food and Energy M/M: 0.2%e v 0.3% prior; Y/Y: No est v 2.4% prior, PPI Ex Food, Energy, Trade M/M: No est v 0.1% prior; Y/Y: No est v 2.6% prior
- 10:00 (CA) Bank of Canada (BOC) Interest Rate Decision: Expected to raise Interest Rates by 25bps to 1.50%
- 10:00 (US) May Final Wholesale Inventories M/M: No est v 0.5% prelim, Wholesale Trade Sales M/M: No est v 0.8% prior
- 10:30 (US) Weekly DOE Crude Oil Inventories
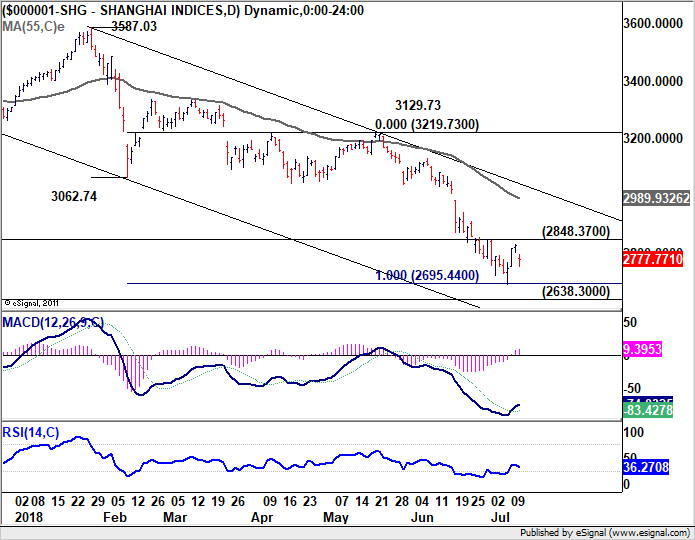
China Shanghai Composite down but not out, AUDUSD attempts down trend resumption
Following selloff in Asia, Major European indices are all trading in red in initial trading. At the time of writing, DAX is down -1.4%, CAC down -1.2%, FTSE down -1.3%. But they are kept well above last week's low, suggesting that selling is not too serious.
The China SSE composite closed down -49.85 pts, or -1.76% at 2777.77. While SSE lose 2800 handle again, it's kept well above last week's low at 2691.02. We've mentioned a number of times that 2638.30 - 2700 zone represents important support level. Judging from the fact that SSE close just slightly lower than open at 2780.70, there was no panic selling. We're holding on to the case that 2691.02 is at least a short term bottom and there should be another rise through 2848.37 to extend the corrective rebound.
In the currency markets, Australian Dollar remains the weakest one for today, with AUD/USD as the biggest loser.
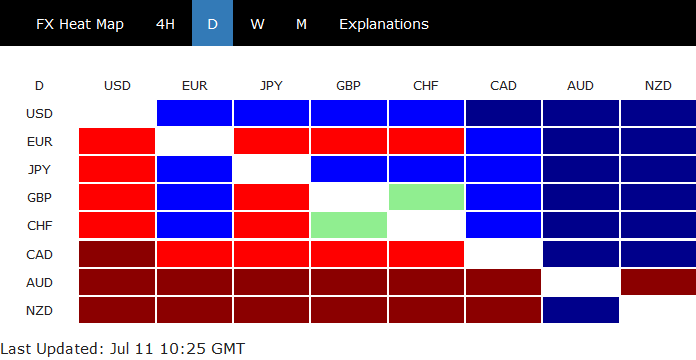
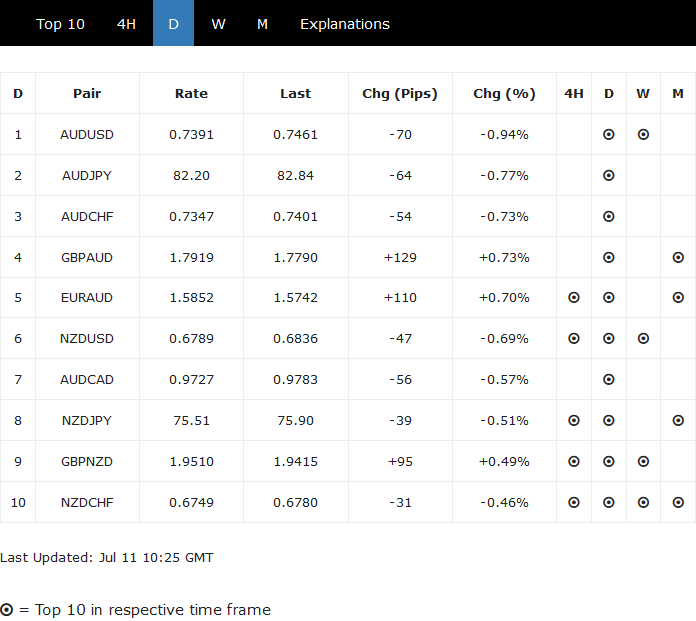
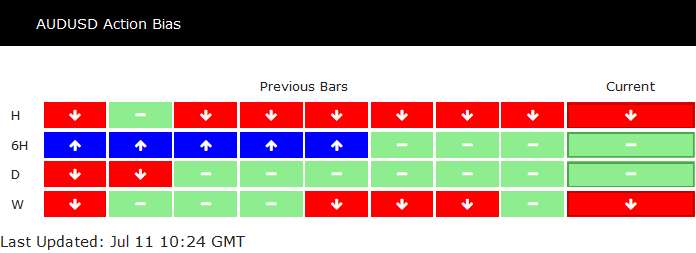
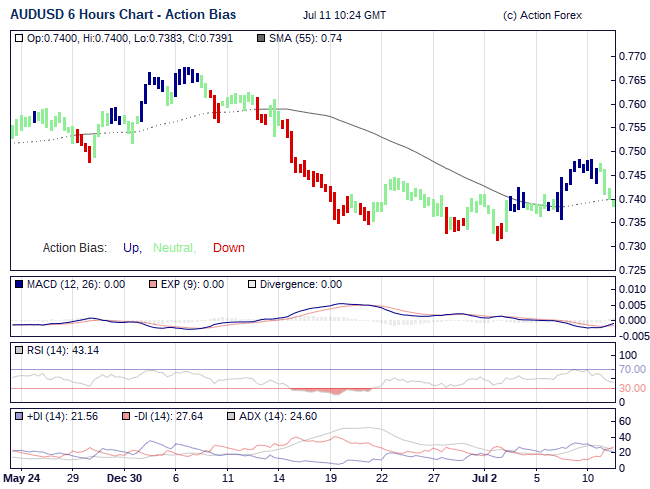
From Action Bias point of view, the string of downside red bar in H Action Bias is hinting at down trend resumption. The break of 0.7414 minor support today is another signal on it. But we'd wait for 6H Action Bias to turn red too to give us more confidence on it. After all, we see 0.7328 as an important medium term support that takes some determination to break.