Sample Category Title
Forex Technical Analysis: EUR/USD, USD/JPY, GBP/USD
EUR/USD
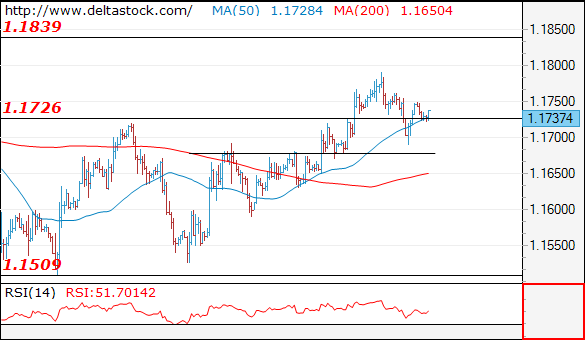
Current level - 1.1737
The support at 1.1680 managed to hold yesterday's downward pressure, but I don't think the slide is over, so expect another dip to 1.1630-1.1600 area.
| Resistance | Support | ||
| intraday | intraweek | intraday | intraweek |
| 1.1790 | 1.1830 | 1.1680 | 1.1510 |
| 1.1830 | 1.2050 | 1.1600 | 1.1300 |
USD/JPY
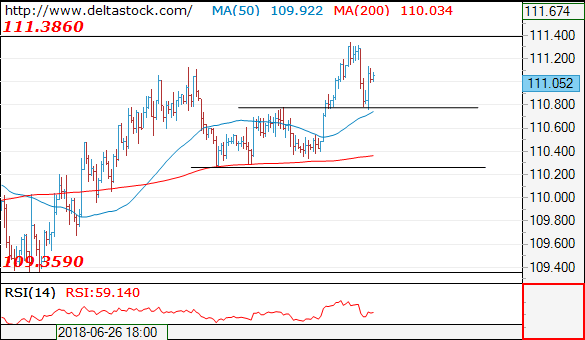
Current level - 111.05
The recent rise maneged to test 111.40 resiatnce and the pullback was limited above 110.80. My intraday outlook is neutral within the 110.80-111.40 range.
| Resistance | Support | ||
| intraday | intraweek | intraday | intraweek |
| 111.40 | 111.40 | 110.80 | 107.80 |
| 111.40 | 114.40 | 110.25 | 106.70 |
GBP/USD
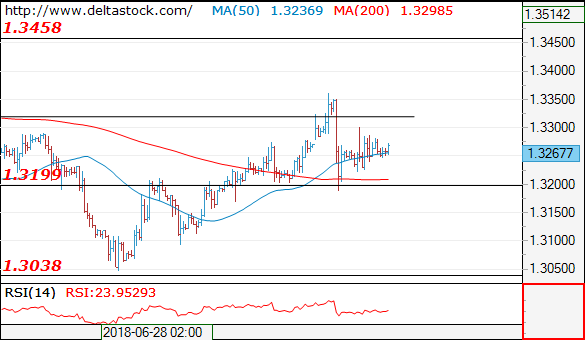
Current level - 1.3267
My outlook remains negative, for a break through 1.3200 area, towards 1.3100 zone.
| Resistance | Support | ||
| intraday | intraweek | intraday | intraweek |
| 1.3320 | 1.3618 | 1.3200 | 1.3040 |
| 1.3460 | 1.3990 | 1.3100 | 1.2770 |
Trade War Escalation Triggers Risk Aversion, Gold Prices Fall
A fresh wave of risk aversion swept across financial markets after the United States threatened to impose tariffs on an extra $200 billion worth of Chinese goods.
This unfavorable move comes just days after the two countries slapped tit-for-tat tariffs on $34 billion worth of each other’s imports. With Beijing describingthe latest tariff threats as “totally unacceptable” and vowing to fight back, concerns are likely to heighten over a full-scale trade war becoming a reality. With escalating trade tensions between the world’s two largest economies presenting a significant threat to global economic growth and stability, there are no winners. Investors are likely to maintain a cautious stance for the rest of the trading week with global sentiment expected to remain fragile.
This cautious toneisalready reflected in global equity markets this morning with Asian and European stocks tumbling lower. Wall Street could be poised to open lower this afternoon as the risk-off sentiment encourages investors to offload riskier assets for safe-haven investments.
Dollar Index stabilizes above 94.00
The Dollar was steady against a basket of major currencies on Wednesday morning with prices trading marginally above 94.20 as of writing.
With the fundamental drivers behind the Dollar’s appreciation still firmly intact, there is a suspicion that the post-NFP sell-off was based on profit taking. Market expectations over the Federal Reserve raising interest rates at least two more times this year are seen ascontinuing to heavily support the Dollar. With investors potentially rushing to the Dollar as a source of safety amid escalating trade tensions, further upside could be witnessed in the near term.
Focusing on the technical picture, the Dollar Index has scope to resume the uptrend if bulls are able to conquer 94.50. A decisive daily close above this level may encourage an incline towards 95.00.
Currency spotlight – EURUSD
The divergence in monetary policies between the United States and Europe has left the EURUSD fundamentally bearish.
While expectations remain elevated over the Federal Reserve raising rates two more times this year, the European Central Bank is expected to retain the zero-interest rate policy (ZIRP) until after Summer 2019.
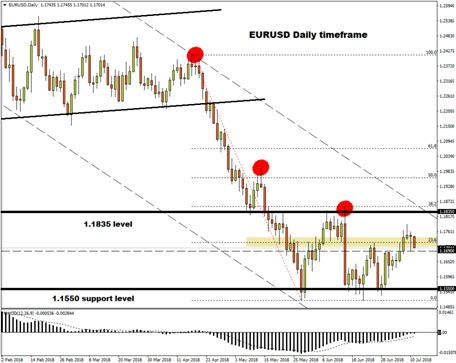
With regards to the technical picture, the EURUSD continues to fulfil the prerequisites of a bearish trend on the daily charts. There have been consistently lower lows and lower highs. A solid daily close below 1.1690 could trigger a decline towards 1.1630 and 1.1550, respectively. Daily bears remain in control as long as prices remain below 1.1850.
Commodity spotlight – Gold
Gold’s trajectory is likely to remain heavily influenced by the Dollar’s performance this week.
The volatile price action witnessed during the early parts of the trading week continues to highlight how the metal remains extremely sensitive to itsnegative correlation against the Dollar. With the outlook for the Dollar being bullish amid expectations of higher US interest rates this year, Gold could be set to weaken further.
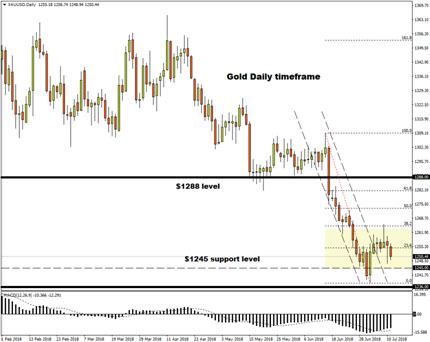
Focusing purely on the technical picture, the yellow metal is bearish on the daily charts. Sustained weakness below $1260may inspire bears to send Gold back towards $1245.
USDJPY Outlook: Maintains Bullish Tone But Caution On Fresh Risk Aversion
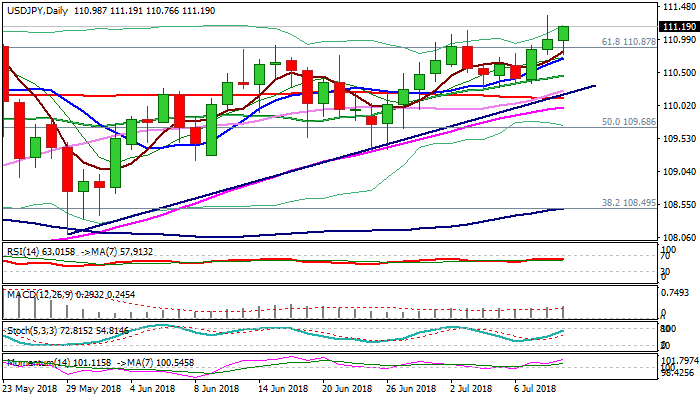
The pair holds positive tone on Wednesday but holding below previous day’s spike high at 111.35 for now.
Strong rejection on initial attempt at key barrier at 111.39 (21 May high) could be seen as hesitation which requires extended consolidation before final break higher.
Such scenario is supported by strong bullish setup of daily techs and double twist of weekly cloud, which usually attracts.
Also, Tuesday’s eventual close above important Fibo barrier at 110.87 (Fibo 61.8% of 114.73/104.63) following multiple failures in past three weeks, would add to positive signals for bullish continuation.
Firm break above 111.39 pivot would then open way towards 112.35 target (Fibo 76.4% of 114.73/104.63).
On the other side, fundamentals seem to be working against the dollar as renewed talks about further US tariffs on goods from China would spark fresh risk aversion and prompt traders into safe-haven yen.
Negative scenario needs initial signal on fall below higher base at 110.30 zone to spark further bearish acceleration and turn bias into negative mode.
Sustained break below 110.30 would risk extension towards 109.36 (25/26 June trough).
Res: 111.39, 112.00, 112.35, 112.78
Sup: 110.77, 110.46, 110.30, 110.00
AUDUSD Outlook: Aussie Fell In Asia On Talks Of New US Tariffs
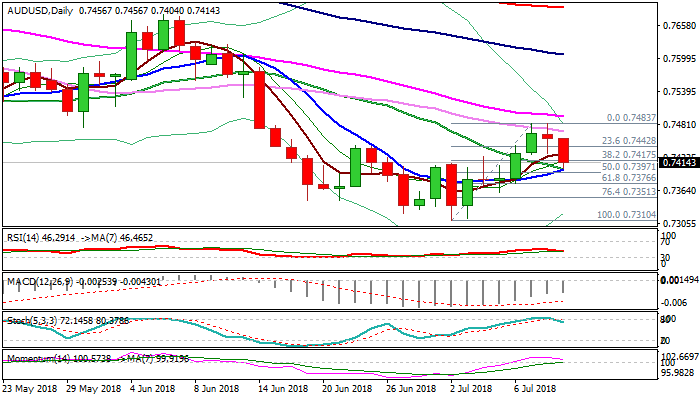
The Aussie dollar accelerated lower in Asian session on Wednesday, after the US said on Tuesday it would impose an extra tariff on Chinese goods. The Australian dollar is considered as a proxy for China-related trades and reacted negatively on the latest news, falling around 50 pips overnight. Fresh weakness cracked pivotal support at 0.7417 (Fibo 38.2% of 0.7310/0.7483 upleg and pressures another important point at 0.7400 (converged 10/20SMA's. Firm break here is needed to confirm double-top at 0.7483 (09/10July tops) and generate stronger bearish signal. Daily slow stochastic reversed from overbought territory and 14-d momentum turned south, pressuring the midline and its 7-d MA, in attempt to generate fresh bearish signal and further support renewed bears. Extension below 0.7400 handle would open next pivot at 0.7376 (Fibo 61.8% of 0.7310/0.7483, reinforced by thin daily cloud) break of which would confirm reversal. Broken 5SMA marks initial resistance at 0.7430, while falling 30SMA (0.7469), which repeatedly limited upside attempts, maintains pressure and is expected to cap stronger uptick.
Res: 0.7430, 0.7456, 0.7456, 0.7469
Sup: 0.7400, 0.7376, 0.7361, 0.7310
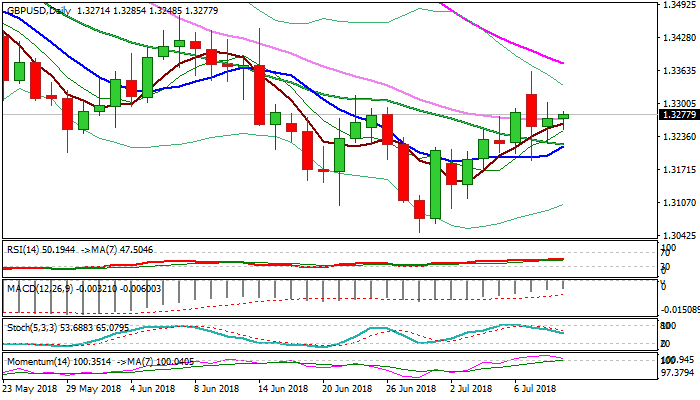
GBPUSD Outlook: Cable Looks For Direction Signal
Cable holds within tight range in early Wednesday's trading, with slight bullish bias following Tuesday's positive close and recent M&A news.
Immediate downside risk following political turmoil in the UK is sidelined for now, but risk aversion on renewed trade war concerns and bearishly aligned techs (thick daily cloud continues to weigh along with south-heading momentum and slow stochastic) may limit upside attempts.
Bullish signal could be expected on violation of upper pivots at 1.3380 (daily cloud base/falling 55SMA) while converged 10/20SMA's mark lower trigger at 1.3215, loss of which would be a bearish signal.
Res: 1.3301, 1.3362, 1.3380, 1.3446
Sup: 1.3248, 1.3215, 1.3189, 1.3114
EURUSD Outlook: Holds In Sideways Mode And Looks For Stronger Direction Signal
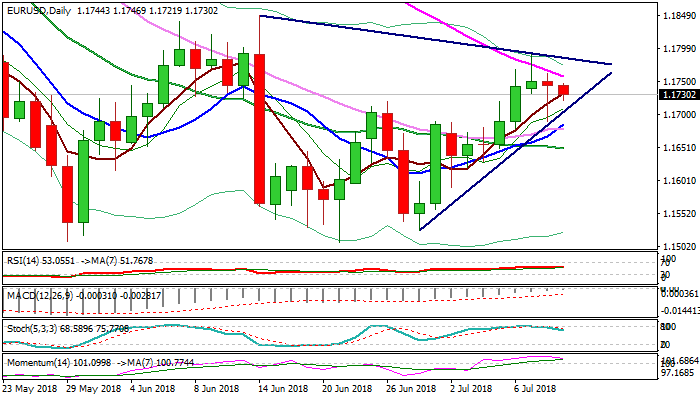
The Euro was mostly sidelined in Asia on Wednesday, but holding in daily cloud, following Tuesday's bounce and close above cloud base. Renewed concerns about trade war offered mild support, while today's comments from ECB's policymaker Villeroy that the first ECB rate rise could be expected earliest in summer 2019, could have negative impact, but double-Doji in past two days warns of strong indecision. Falling 55SMA (currently at 1.1758) continues to cap for the third straight day and sustained break higher is needed to generate bullish signal and turn near-term focus higher. Daily cloud base (1.1713) holds today's action for now and marks initial support, while stronger bearish signal could be expected on break below Tuesday's low at 1.1690, reinforced by 10/30SMA bull-cross. Mixed configuration of daily MA's supports sideways mode for now, but south-heading slow stochastic and momentum maintain pressure. Look for direction signal on break of either side.
Res: 1.1746, 1.1758, 1.1790, 1.1840
Sup: 1.1713, 1.1690, 1.1658, 1.1658
Trade Tension Frightens Investors
Risk aversion spreads amid renewed trade tension
Asian equities fell across the board on Wednesday after Donald Trump announced tariffs on a further $200bn in imports from China. The Nikkei 225 gave up 1.19% to 21,932 points, while Chinese stocks bore the brunt of the sell-off. The Shanghai Composite fell 1.76%, while the tech-heavy Shenzhen Composite slid 1.96%. European equities followed the lead and moved in negative territory. The German DAX already gave up more than 1%, the Eurostoxx 50 fell 0.85% while the SMI erased 1%.
The Trump administration unveiled a new list - which includes a broad range of products ranging from electric vehicle batteries to air conditioning machines - of Chinese products that will be hit with a 10% tariff. The list is not definitive yet and is expected to come into effect in September. China already declared the new tariff were “totally unacceptable” and promised it will retaliate dollar-for-dollar.
In the FX market, the announcement triggered a risk-off reaction, which translated into a sell-off in emerging market currencies, and a broad US dollar appreciation. Safe-haven currencies such as the Swiss franc and the Japanese saw limited but were at least able to hold ground. In the EM complex, the Russian ruble and the Turkish lira suffered the most as they both fell 0.50%. The Chinese yuan slid 0.48% with USD/CNH rising to 6.6815. Finally, the currencies of export-oriented countries also felt the pain. The Australian dollar fell the most within the G10 complex as it erased 0.65% to $0.7410.
Canadian conundrum
The Canadian economy is in good shape. Governor of the Bank of Canada (BoC), Stephen Poloz, is therefore in a difficult situation. With favourable economic data on one side and a potential trade war with its largest commercial partner on the other, economic policy lies in the grey zone. With inflation above BoC’s 2% target, wage growth largely exceeding consumer price indices, unemployment at a decade low and, most importantly, an economic expansion above the 2.2% projections from the Canadian monetary authority, the odds would most certainly support further monetary policy tightening.
However, uncertainties regarding further trade sanctions from the US remain. The North American Free Trade Agreement (NAFTA) renegotiations, started nearly a year ago, keep dragging and tariffs are looming on lumber, steel, aluminium and possibly autos and automotive parts. Since Canadian interest rates remain among the lowest and the loonie continues to weaken, we see no reason not to hike. Now at 1.25%, the BoC’s policy interest rate will be increasing by a quarter percent to 1.50%. USD/CAD is up 4.7% in 2018: we would therefore expect the pair to head to 1.3170 after the BoC’s announcement.
WTI Inverted Head And Shoulders At Weekly Support
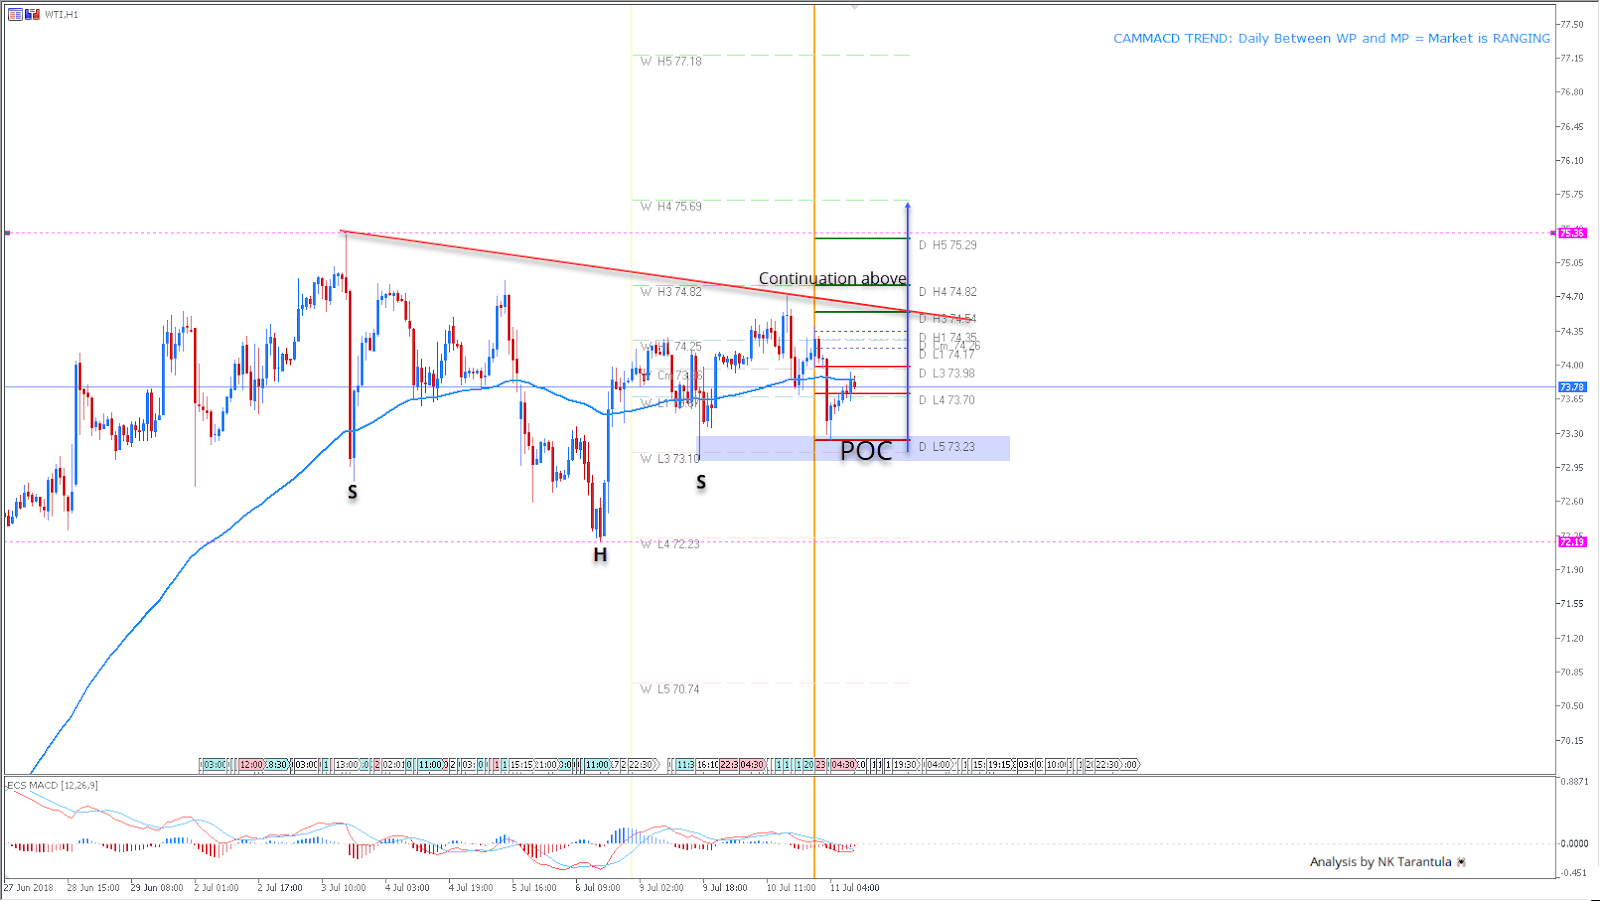
The WTI is currently bouncing from the D L5/W L3 confluence zone. 73.10-25 is the POC and this is where the fresh buyers are positioned. 74.82 could be the next target and only if the price breaks it, the WTI might continue further north towards 75.29-69. A drop below 73.00 might temporarily negate this scenario as bullish momentum will be lost.
W L3 - Weekly Camarilla Pivot (Weekly Interim Support)
W H3 - Weekly Camarilla Pivot (Weekly Interim Resistance)
W H4 - Weekly Camarilla Pivot (Strong Weekly Resistance)
D H4 - Daily Camarilla Pivot (Very Strong Daily Resistance)
D L3 – Daily Camarilla Pivot (Daily Support)
D L4 – Daily H4 Camarilla (Very Strong Daily Support)
POC - Point Of Confluence (The zone where we expect price to react aka entry zone)
AUDUSD Dives Sharply In Near Term, Next Level To Watch 18-Month Low Of 0.7310
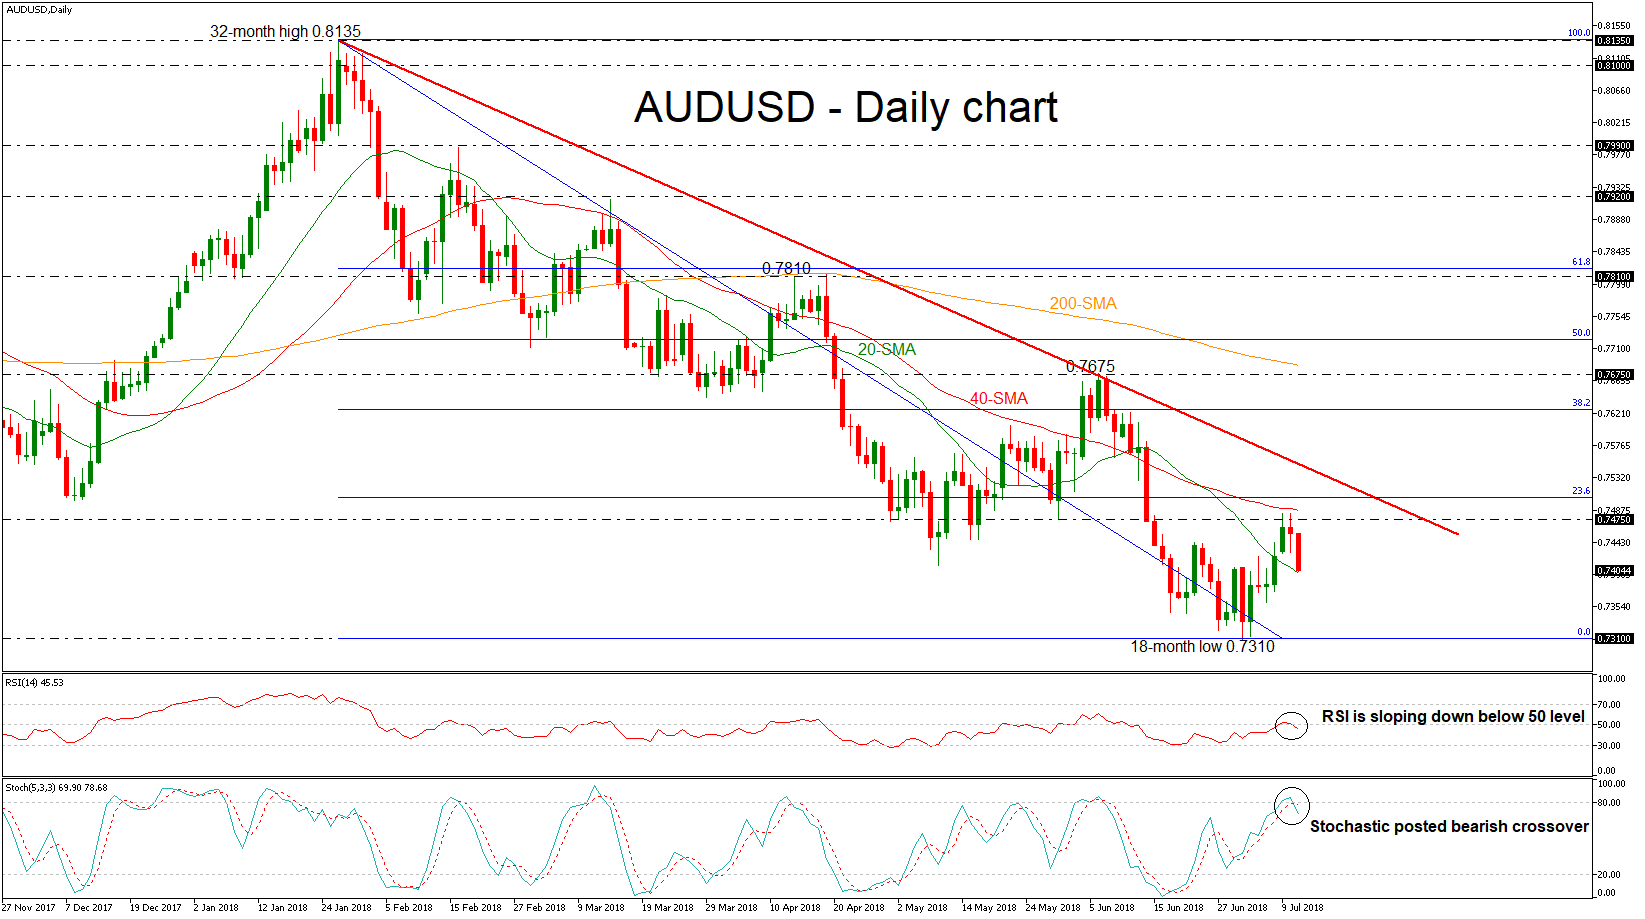
AUDUSD retreated after the pullback on the 0.7475 resistance level on Tuesday which is slightly below the 40-simple moving average (SMA) in the daily timeframe. The short-term technical indicators are bearish and point to more weakness in the market.
Currently, the price touched the 20-day SMA, which acts as a strong support level for the bulls. However, the RSI indicator is sloping downwards and stands below the threshold of 50, while the %K line of the stochastic oscillator completed a bearish crossover with the %D line in the overbought territory, suggesting a downward correction of the latest positive move is underway.
Should prices drop further lower, this could open the way towards the 0.7160 hurdle, identified by the trough on December 2016. There are no significant support obstacles before that level.
In case of further gains, the first resistance for investors to have in mind is the 0.7475 barrier, taken from the bottom on May 31. If there is a jump above this level, the price could challenge the 23.6% Fibonacci retracement level of 0.7505 of the downleg from 0.8135 to 0.7310. Above this region, if there is a break of the descending trend line, the focus shifts to the upside until the 38.2% Fibonacci of 0.7625.
To conclude, AUDUSD has been developing within a descending move since January 26 and is in progress to hit again the 18-month low of 0.7310 in the near term.
EURJPY Advances Above SMAs But Trades Below 7-Week High
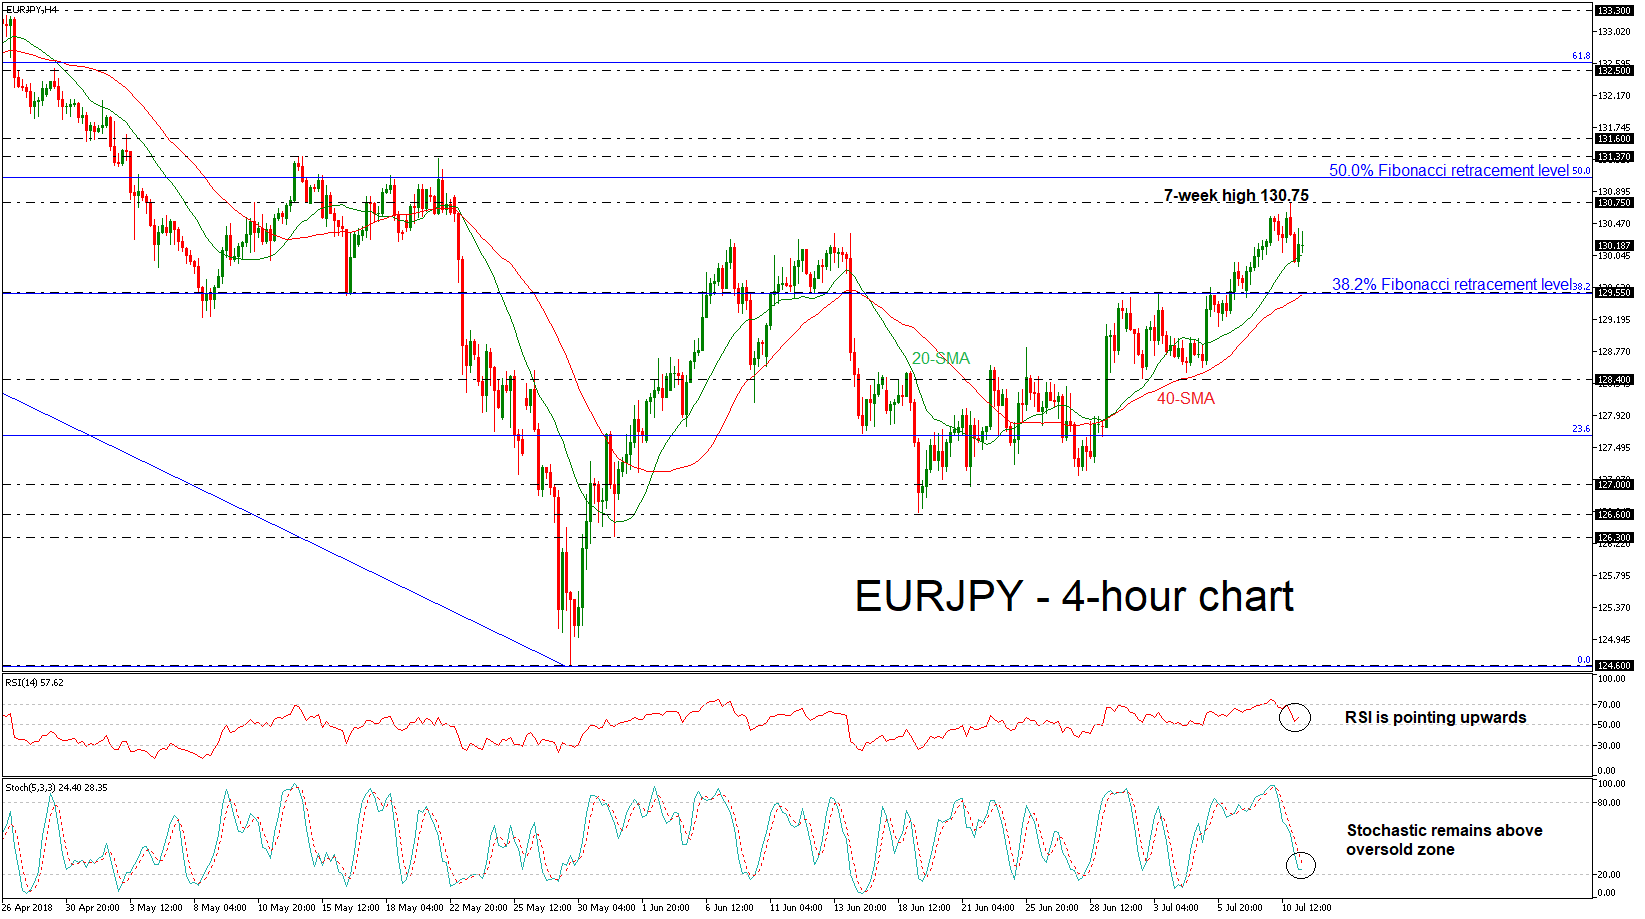
EURJPY has advanced considerably over the last three weeks after the rebound on the 126.60 support level. During yesterday’s trading session, the pair hit a fresh seven-week high of 130.75 and then plummeted until the 20-simple moving average (SMA) in the 4-hour chart. Currently, the market is trying to erase earlier losses as it is set to create the second bullish session in a row.
From the technical point of view, in the 4-hour chart, the indicators are currently supporting that the positive momentum is likely to strengthen in the short-term. Specifically, the RSI is picking up speed to the upside and the stochastic oscillator is turning to the upside.
Should the price close decisively above the 130.75 hurdle, the next resistance to have in mind is the 50.0% Fibonacci retracement level of the downleg from 137.50 to 124.60, around 131.10. Further advances above this level could then target the area around the 131.37 – 131.60 zone.
On the downside, a decline could meet the 40-SMA, which overlaps with the 128.55 support, also the 38.2% Fibonacci. A slip below this level, the price could retest the 128.40 barrier, taken from the low on July 2.
Overall, EURJPY shifted the bearish outlook to bullish as it jumped above the moving averages. It is worth mentioning that in the daily timeframe the 20-SMA is ready for an upward crossover with the 40-SMA.