Sample Category Title
XAUUSD Intraday Analysis
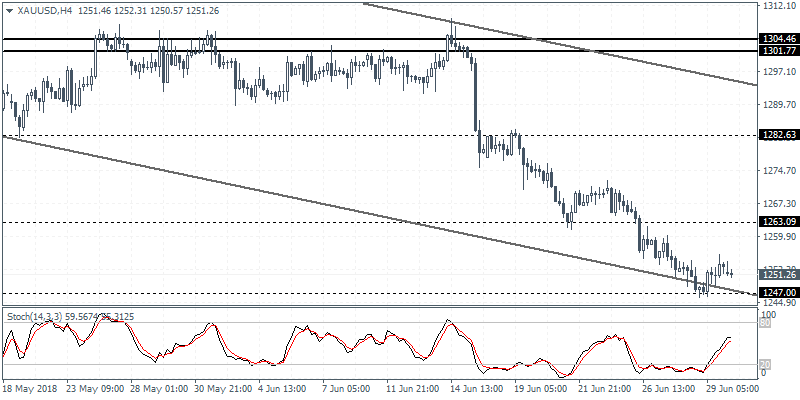
XAUUSD (1251.26): Gold prices were seen posting a rebound after price action was seen consolidating near the lower trend line of the falling price channel. Still, the overall momentum remains weak and biased to the downside. The immediate resistance level near 1263 region is unlikely to be tested in the near term but remains a possibility. For the short term, a temporary bottom has been formed near the 1247 region. As long as prices hold above this level we expect to see gold prices moving in a sideways range.
USDJPY Intraday Analysis
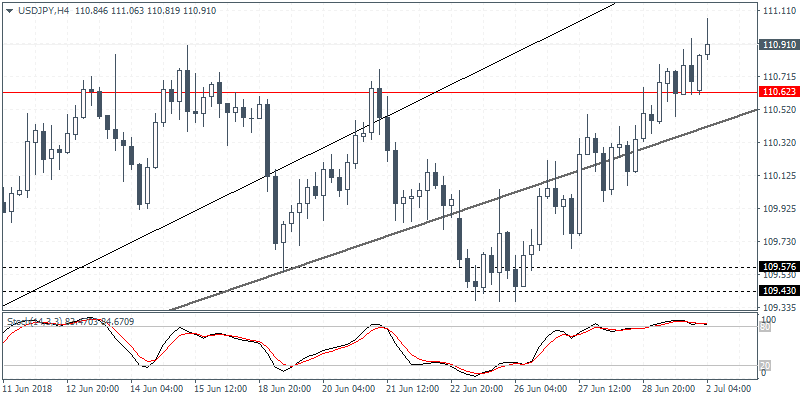
USDJPY (110.91): The USDJPY currency pair managed to seek out some gains as price action briefly broke past the resistance level of 110.62. Still, the fact that the breakout above level was not triggered by strong price action leaves the risk of a correction in prices. The 4-hour Stochastics remains in the overbought level which also validates this view. In the event of a correction, the USDJPY currency pair could be seen holding the declines onto the rising trend line once again
EURUSD Intraday Analysis
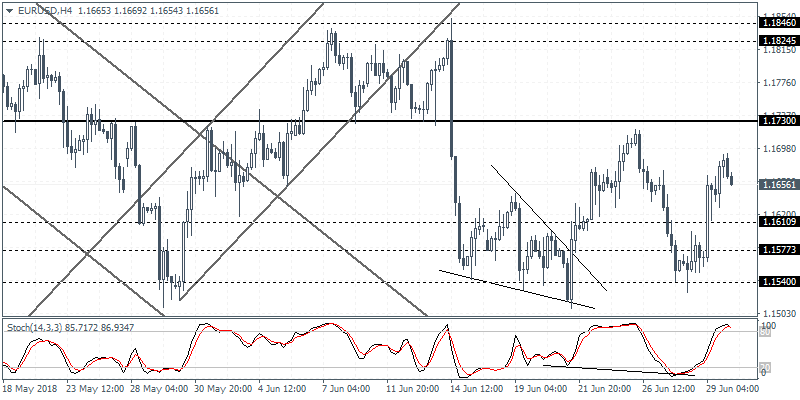
EURUSD (1.1656): The EURUSD currency pair was seen posting strong gains on the day on Friday. With the strong momentum led breakout, price action is expected to eventually reach the resistance level of 1.1730. A retest of this level which failed to hold as support could keep the gains in check. However, a breakout above 1.1730 could potentially push the euro currency towards testing the minor resistance level of 1.1846 - 1.1824 region. This could potentially establish the 1.1730 level as support forming a new higher corridor for the currency pair in the short term.
Markets Open A New Trading Month
The euro currency was seen posting strong gains from the start on Friday. The gains came as news outlets reported that the EU summit saw the region's leaders agreeing to solutions on the European migrant crisis.
The common currency also held its ground as economic data later in the day showed that headline consumer prices increased 2.0% on the year ending June 2018. This was broadly in line with the median estimates. Core CPI which strips the volatile food and energy prices were seen rising at a slightly slower pace of 1.0% on the year ending June. The month before, core CPI increased 1.1%.
Elsewhere, the UK's GDP data showed a slightly higher revision. Data from the ONS showed that the GDP advanced 0.2% in the three months ending March 2018. This was a higher revision compared to the 0.1% increase that was reported in the previous two initial estimates.
Looking ahead, the economic calendar for the day will see the release of the manufacturing PMI reports from Spain, France and Italy. In the UK, the monthly manufacturing PMI data is expected to dip slightly to 54.1 down from 54.4 from May.
The U.S. trading session will see the release of the ISM's manufacturing PMI data. Median estimates forecast that manufacturing activity eased to 58.2, down from 58.7 from the month before.
Gold Holds Near Return Line Of Downward Sloping Channel, Posted 6-Month Low
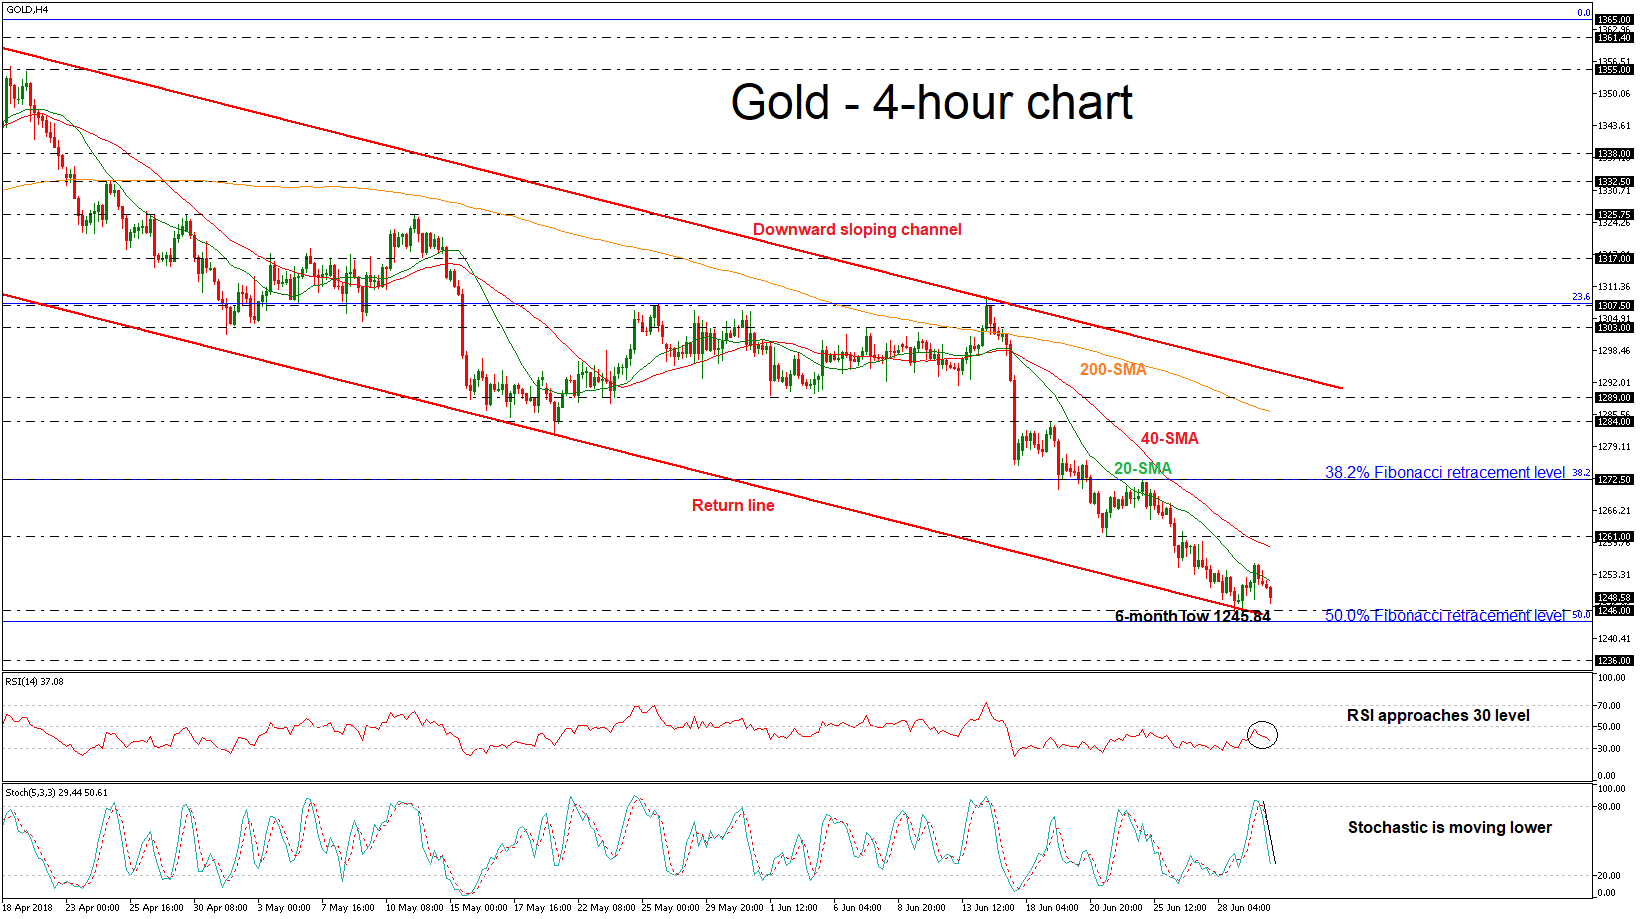
Gold started an aggressive bearish roller coaster over the previous three weeks, creating a fresh six-month low of 1245.84 last Thursday. The price is developing near the aforementioned low and the short-term technical indicators are pointing to more weakness in the market.
Looking at the at the 4-hour chart, gold prices are looking capped by the 20 and 40-simple moving averages (SMAs) which are negatively aligned after a bearish crossover that took place on June 15. The Relative Strength Index (RSI) is heading lower towards the threshold of 30, while the stochastic oscillator is moving lower.
Should prices continue the bearish movement, immediate support could come at the 50.0% Fibonacci retracement level of 1243.8 of the upleg from 1122 to 1366, which stands near the return line of the descending channel. A drop below this area would take the yellow metal to the 1236 support, taken from the low on December 2017.
To the downside, there is resistance just below the 1261, where the 40-SMAs stands at 1258.8, while above that, the next major resistance to watch is the 1272.5, which coincides with the 38.2% Fibonacci level.
Overall, the yellow metal has been developing within a downward sloping channel since April 11, indicating that the price remains in bearish mode in the long term.
USD/JPY Flat Top Ascending Triangle Hints Bullish Continuation
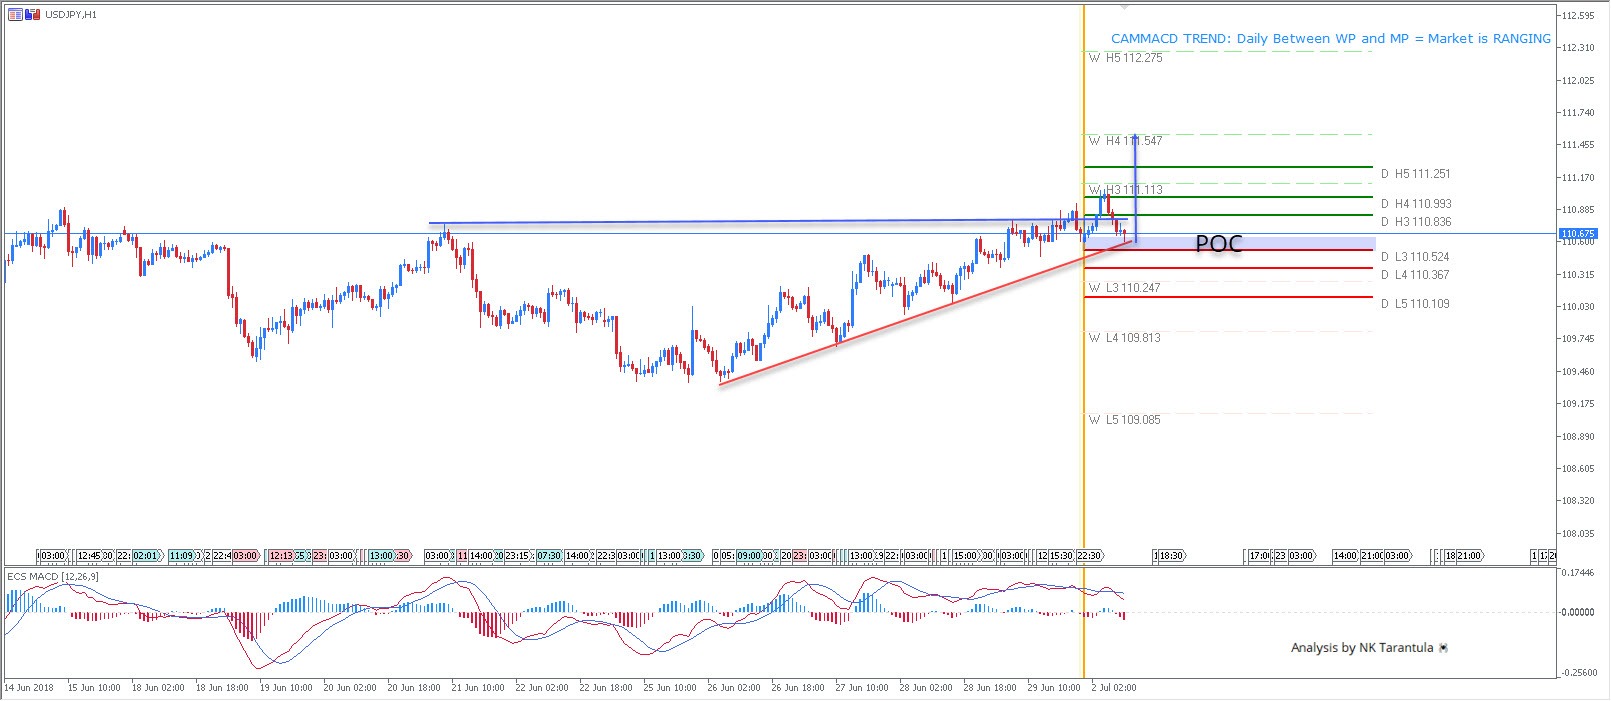
The USD/JPY has formed a flat top ascending triangle pattern. Although, the pattern is still running (no vortex has been formed), this is a bullish configuration. The price has already broken above the upper flat trend line and we might see a continuation above 111.00. In the case of a retracement 110.50-60 is the POC zone for a possible bounce. Targets are 111.00 and 111.54. Ideally the price should stay above 110.20, else we might see a bearish momentum.
W L3 - Weekly Camarilla Pivot (Weekly Interim Support)
W H3 - Weekly Camarilla Pivot (Weekly Interim Resistance)
W H4 - Weekly Camarilla Pivot (Strong Weekly Resistance)
D H4 - Daily Camarilla Pivot (Very Strong Daily Resistance)
D L3 – Daily Camarilla Pivot (Daily Support)
D L4 – Daily H4 Camarilla (Very Strong Daily Support)
POC - Point Of Confluence (The zone where we expect price to react aka entry zone)
Euro Pares Gains As German Political Turbulence Persists, Dollar Eyes ISM Manufacturing PMI
Here are the latest developments in global markets:
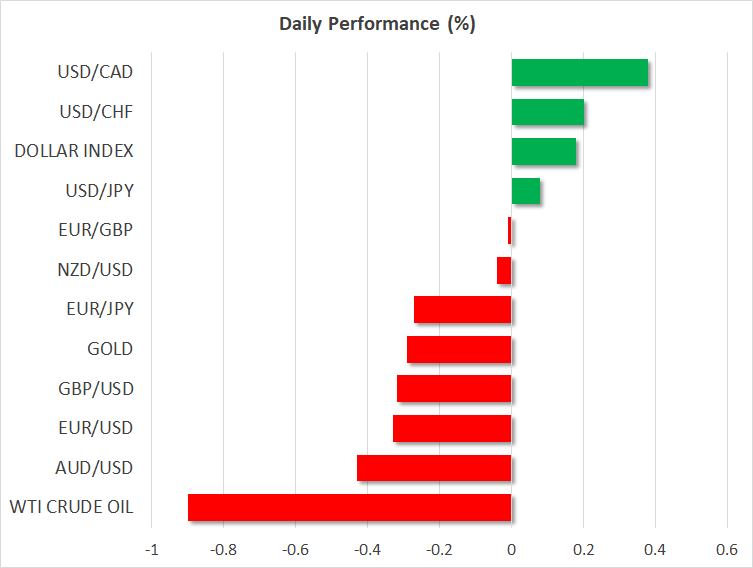
FOREX: The US dollar index – which tracks the greenback's performance against a basket of six major currencies – was higher by 0.2% on Monday. The euro was a touch softer as German political uncertainties remained a key theme. The loonie was also on the defensive amid a drop in oil prices, giving back some of the gains it posted on Friday following strong data releases.
STOCKS: US markets closed higher on Friday, albeit not significantly so. The Dow Jones gained the most (+0.23%), while the Nasdaq Composite (+0.09%) and S&P 500 (+0.08%) lagged. However, risk appetite seems to have turned sour, as futures tracking the S&P, Nasdaq 100, and Dow, are all in negative territory, pointing to a notably lower open today. The risk-off move may be owed to lingering concerns on trade, as well as reports suggesting a potential reescalation in the North Korea conflict. Reflecting this, Asia was a sea of red on Monday. Japan's Nikkei 225 and Topix plunged by 2.21% and 2.06% respectively, while in South Korea, the Kospi 200 was down 2.25%. Major European indices are also set to open with large gaps to the downside according to futures, amid continued political turbulence in Germany.
COMMODITIES: Oil prices opened lower on Monday, with WTI and Brent crude being down 0.9% and 1.1% respectively. The drop followed a tweet from US President Trump on Saturday stating that Saudi Arabia's King Salman had agreed to raise his nation's oil production. While this was quickly watered down by the White House – which said Saudi Arabia “could” raise production “if needed” – investors still took the opportunity to lock some profits on prior long-oil positions. Overall though, prices remain elevated near multi-year highs, which suggests that while this story may be taking some wind out of oil's sails, the broader narrative is still one of higher prices and constrained supply. In precious metals, gold was down 0.3% on Monday, hovering just above the $1248/troy ounce level, and continuing to mimic the US dollar's movements in inverse fashion.
Major movers: German politics keeping euro in check; loonie whipsaws
The euro is trading on a softer note on Monday, down by 0.35% against the dollar, following German political news over the weekend. The migration deal that German Chancellor Merkel brokered at last week's EU summit was apparently not enough to appease her coalition partners, as Interior Minister Seehofer offered to resign from her cabinet after his CSU party rejected the deal.
The two sides are expected to continue negotiations today in hopes of reaching an agreement. Hence, the common currency will probably remain sensitive to news flow. A potential accord would dispel some political uncertainty, diminish the likelihood for early elections in Europe's largest economy and likely help the euro to recover. Conversely, a no-compromise scenario could bring the single currency under renewed selling pressure.
On the trade front, the EU Commission reportedly warned the US that tariffs on imported cars would hurt the American economy, and could provoke counter-tariffs from the major US trading partners amounting to $300bn worth of US goods. This week will likely be very interesting, as on Friday, both the US and China are due to implement the $34bn of tariffs they previously announced. As usual, any fresh escalation has the capacity to weigh on risk appetite, triggering a flight into safety and out of riskier assets, such as equities.
Also potentially keeping a lid on risk sentiment, are reports that North Korea may have increased its production of fuel for nuclear weapons. If confirmed, this could trigger a fresh deterioration between US-North Korea relationships, providing another reason for havens like the Japanese yen to stay in demand.
Elsewhere, the loonie surged on Friday, following stronger-than-anticipated Canadian GDP data for April and the BoC's quarterly business outlook survey, which was upbeat on most fronts, stoking speculation for a rate hike at the upcoming July 11 meeting – a prospect now priced in with a 79% probability. Although dollar/loonie rebounded on Monday, trading 0.4% higher, this move appears to be owed mainly to the tumble in oil prices – Canada being a major oil exporting economy.
Day ahead: US, Eurozone, and UK deliver PMI figures; German political conditions in focus
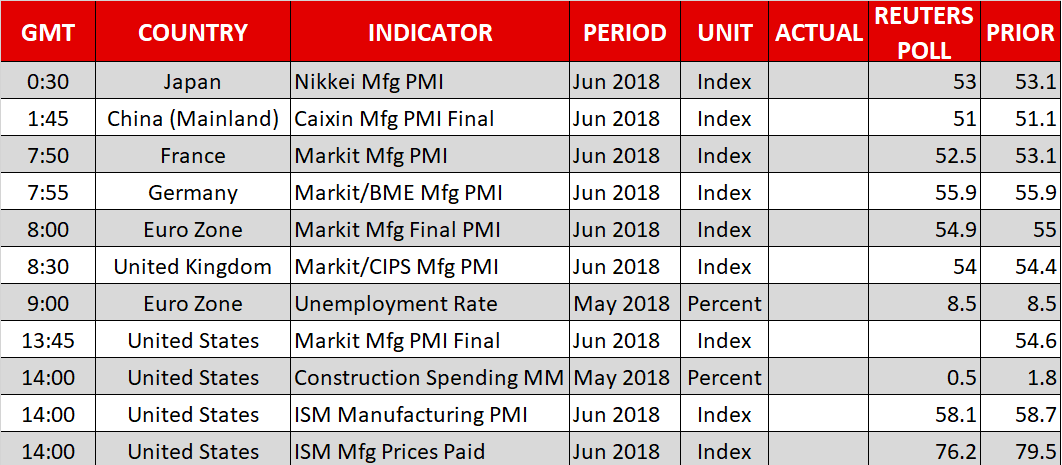
Moving into the second half of year, the trade turmoil and political risks in the Eurozone will continue to weigh on the markets, potentially keeping investors in safe-haven waters for now. But in the absence of any trade or political news, investors will look at the economic calendar for direction on Monday, as Purchasing Managers Index (PMI) readings out of the US, the UK, and the Eurozone are scheduled to give evidence on business activities in the aforementioned regions.
At 0800 GMT, Eurozone's final Markit Manufacturing PMI for the month of June is expected to come at 55 as was initially estimated, unchanged from May's mark and below December's multiyear-high of 60.6. Still, any print above 50 indicates growth in the industry. An hour later, at 0900 GMT, Eurostat will update Eurozone's unemployment rate, with analysts projecting the measure to stand flat at 8.5% in May, at the lowest since 2009. While an upward surprise in the data could help the euro to recover some gains, the migration puzzle in Germany could refrain investors from taking a position on the common currency, despite the two-day EU summit ending on Friday indicating that EU leaders are broadly on the same side on the topic. Particularly, the issue came back to the surface after news that the German interior minister, head of the coalition CSU party, offered to step down from all offices, complaining that his conversation with German Chancellor Merkel over migration on Sunday had no effect, and that the solution secured with the EU leaders was “ineffective”. Should the dispute remain in place, the euro could find it hard to rebound.
Meanwhile, in the UK, June's Markit/CIPS Manufacturing PMI due at 0830 GMT is anticipated to ease to 54.0 from 54.4 in May. The report follows Friday's upward revision of Britain's GDP growth for the first quarter, which boosted speculation that the BoE will likely push interest rates higher in August. However, Brexit risks could hold traders cautious as the UK Prime Minister, Theresa May, who left the EU summit a day earlier, was unable to give a detailed description on her Brexit plans due to existing divisions in her Conservative party.
In the US, the ISM Manufacturing PMI will attract the most attention in terms of data ahead of the FOMC meeting minutes on Wednesday and the all-important nonfarm payrolls employment report on Friday. The numbers released at 1400 GMT are projected to show that the business index has lost 0.6 points to touch 58.1 in June. If the ISM manufacturing PMI beats forecasts, highlighting the strength of the US business community even in the face of trade woes, the dollar could pare today's losses.
Technical Analysis: USDJPY hits six-week highs; momentum indicators lose steam
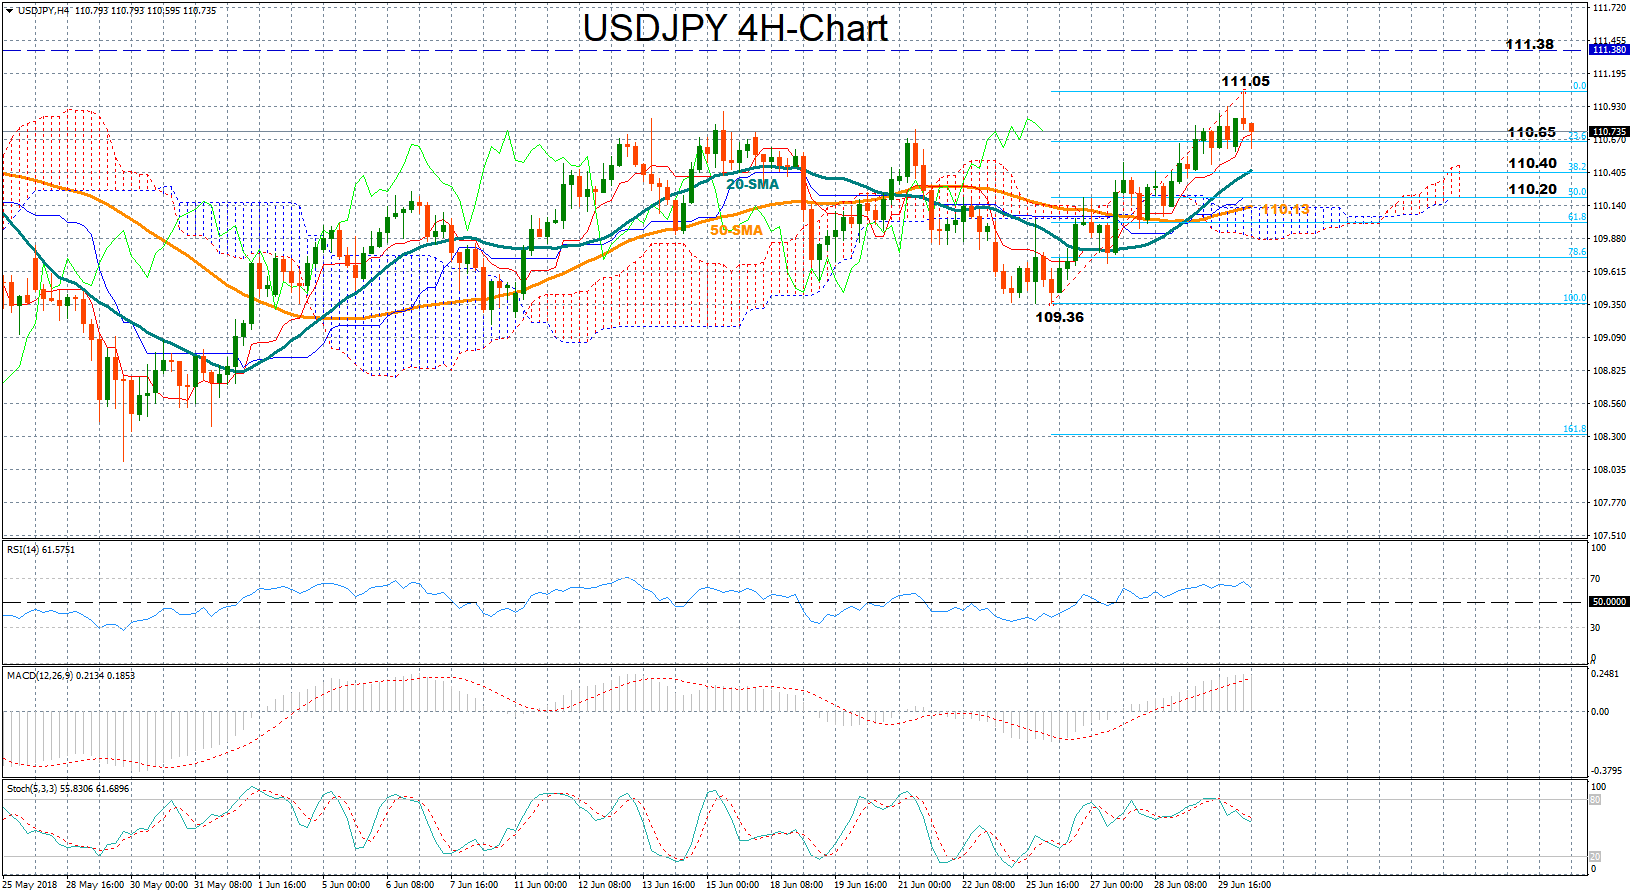
USDJPY managed to peak slightly above the 111-key level today to touch six-week highs, though the gains were not sustainable, and the pair returned down to the 110 handle as the RSI and the Stochastics signaled overbought in the four-hour chart. While the market continues to trade in an uptrend since June 26, momentum indicators suggest that the price might pause its uptrend in the short-term as the RSI and the MACD have slowed down, while the red Tenkan-sen line has also flattened above the blue Kijun-sen line.
Should the US ISM Manufacturing PMI or trade news disappoint, the market could move lower to meet the 23.6% Fibonacci of 110.65 of the upleg from 109.36 to 111.05. Even lower the 38.2% Fibonacci of 110.40, which overlaps with the 20-period simple moving average at the moment, could also act as a barrier given that the area caped upside movements last week. However, if this level fails to hold as well, then the focus could turn to the area between the 50% Fibonacci of 110.20 and the 50-period SMA at 110.13.
Alternatively, encouraging news out of the US could send the price back above the 111 key-level, with the bulls potentially aiming for a retest of May's peak at 111.38.
Crude Oil Key Resistance At 74.00
Pivot (invalidation): 74.00
Our preference Short positions below 74.00 with targets at 72.20 & 71.70 in extension.
Alternative scenario Above 74.00 look for further upside with 74.50 & 75.20 as targets.
Comment The RSI advocates for further decline.
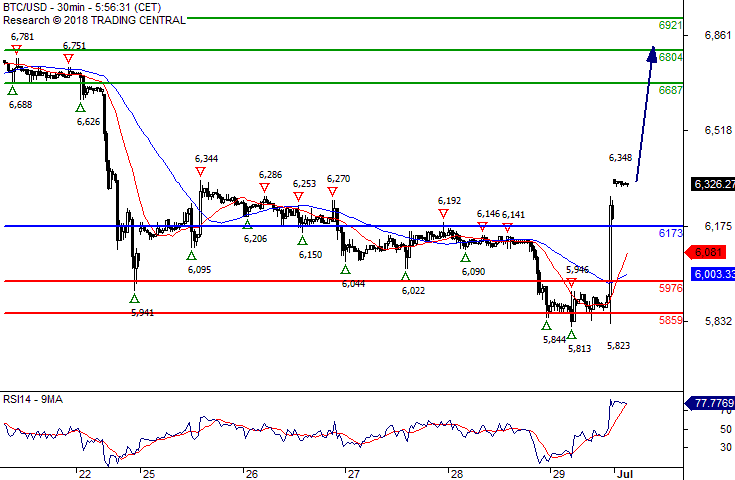
Silver Spot Turning Down
Pivot (invalidation): 16.1600
Our preference Short positions below 16.1600 with targets at 15.9500 & 15.9000 in extension.
Alternative scenario Above 16.1600 look for further upside with 16.2500 & 16.3300 as targets.
Comment The RSI is mixed to bearish.
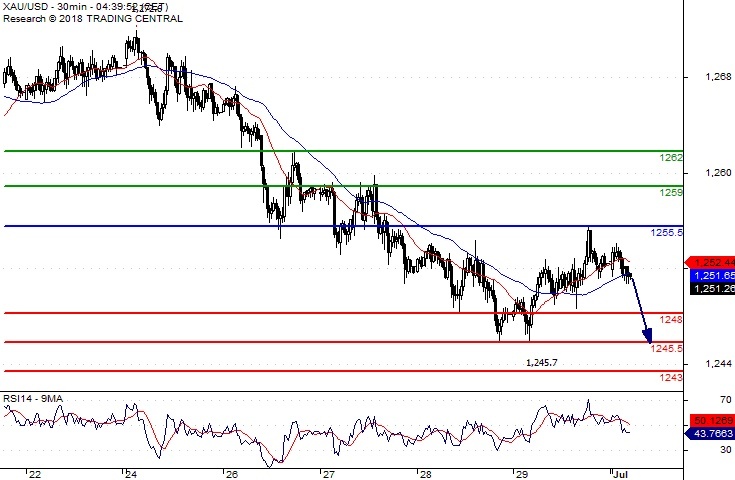
Gold Spot Turning Down
Pivot (invalidation): 1255.50
Our preference Short positions below 1255.50 with targets at 1248.00 & 1245.50 in extension.
Alternative scenario Above 1255.50 look for further upside with 1259.00 & 1262.00 as targets.
Comment The RSI is mixed to bearish.