Sample Category Title
EUR/USD Tests Key Fibonacci Levels At 1.16-1.1650
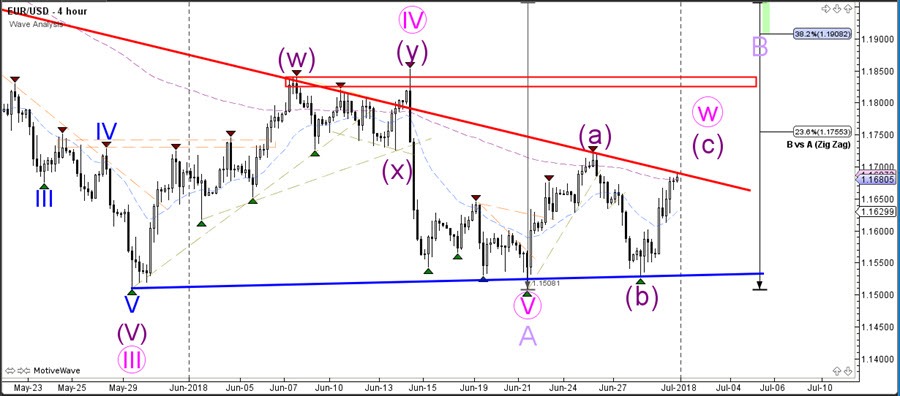
The EUR/USD is approaching multiple key resistance zones, which are decisive bounce or break spots. A bearish bounce could send price back to support whereas a bullish breakout could indicate one more push higher.
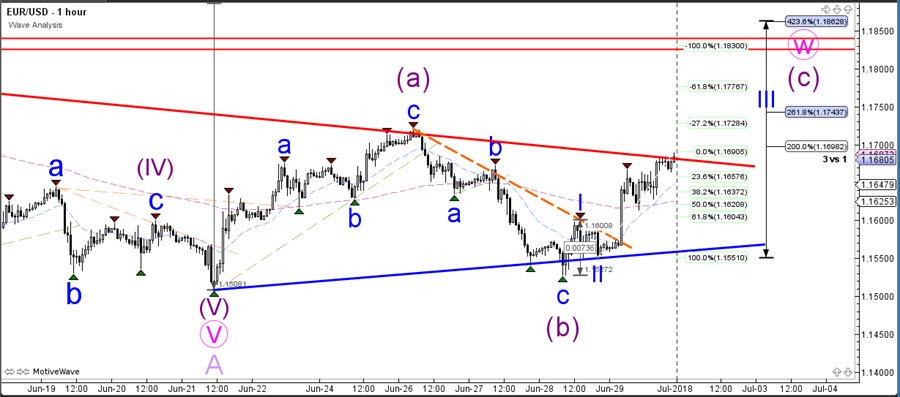
The EUR/USD could also be in wave 4 (pink) if price manages to break below the support trend line (blue). For the moment price is probably completing a bullish wave C (purple) within wave W (pink), which indicates that a bearish retracement could be part of a wave X.
The EUR/USD might not have completed the wave C (purple) if price is indeed in a wave 3 (blue) at the moment. To confirm a wave 4, the EUR/USD needs to bounce at the Fibonacci levels. A break below the 61.8% Fib at 1.16 invalidates this particular wave pattern.
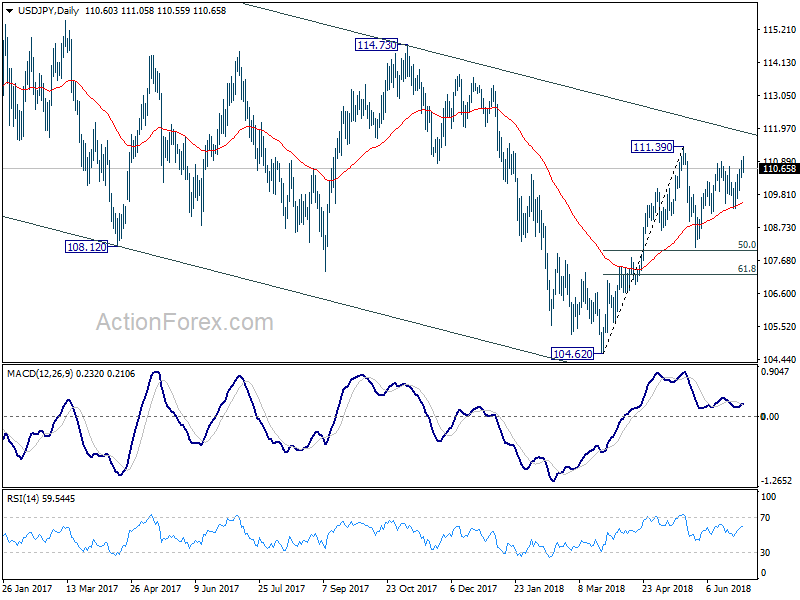
USD/JPY Daily Outlook
Daily Pivots: (S1) 110.39; (P) 110.67; (R1) 110.96; More...
Intraday bias in USD/JPY remains mildly on the upside as rebound from 108.10 is extending. Further rise would be seen for 111.39 high. Break there will also resume the rise from 104.62 and target 114.73 key resistance. However, below 110.05 will turn bias to the downside for 109.36 to extend the corrective pattern from 111.39.
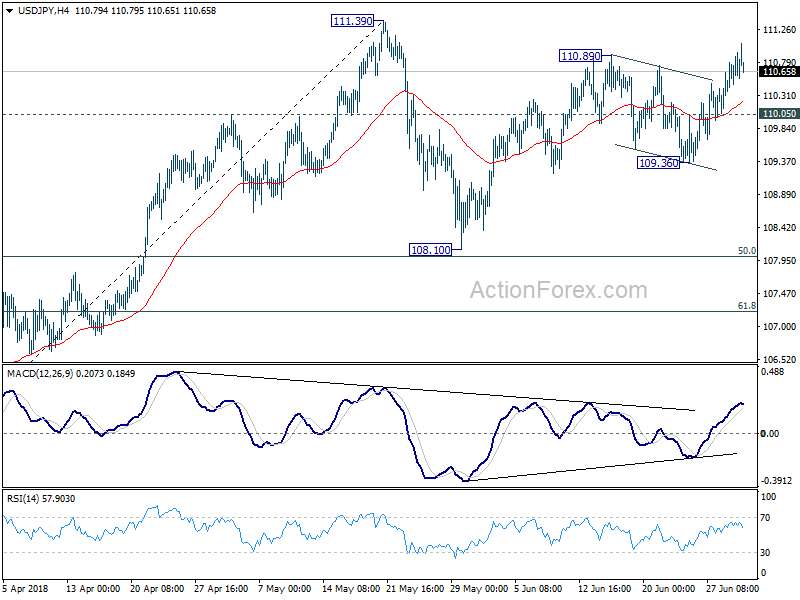
In the bigger picture, at this point, we're slightly favoring the case that corrective decline from 118.65 (2016 high) has completed with three waves down to 104.62. Above 111.39 will affirm this view and target 114.73 for confirmation. However, it should be noted that USD/JPY is bounded in medium term falling channel from 118.65 (2016 high). Sustained break of 61.8% retracement of 104.62 to 111.39 at 107.20 will likely resume the fall from 118.65 through 104.62 low.
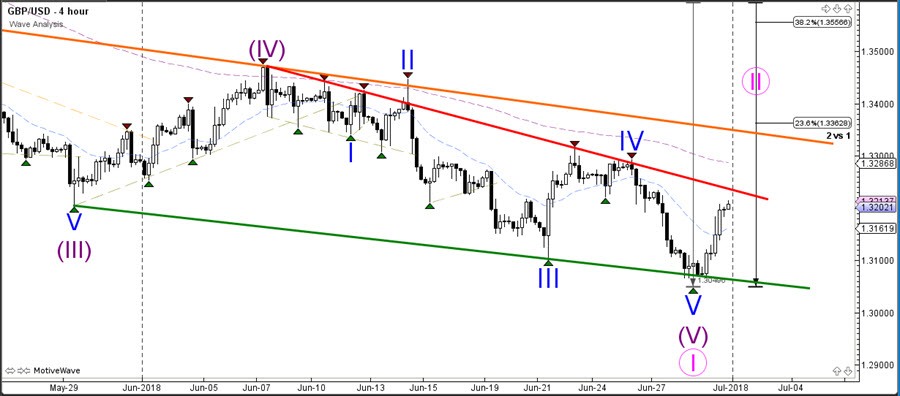
GBP/USD Falling Wedge Pattern Indicates End Of Downtrend?
The GBP/USD reversed at the support trend line (green) with strong bullish momentum. Due to the impulsive price action and falling wedge chart pattern (red-green lines), this chart is indicating the potential for a larger wave 2 (pink) correction.
The GBP/USD however remains in a downtrend and the bullish price action could just be a retracement. For a bearish continuation to be more likely, price would need to show bearish momentum followed by a break of a bear flag chart pattern.
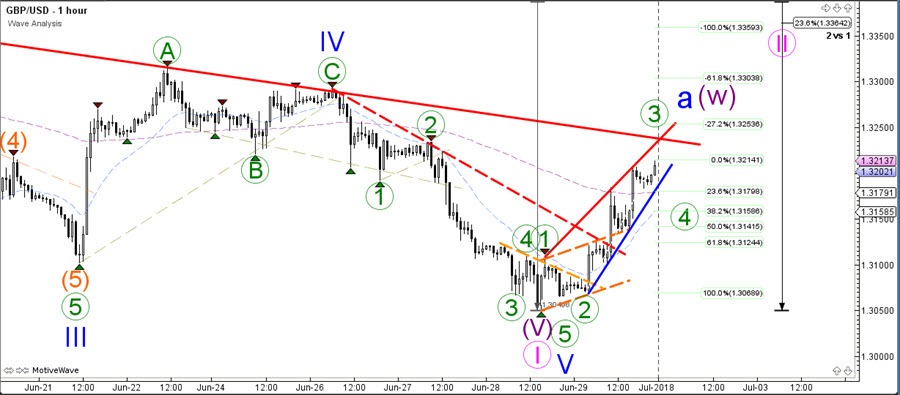
If the GBP/USD is building a larger bullish correction, then it could be doing that via an ABC zigzag. The current bullish impulse could be a wave 3 (green) if price respects the Fibonacci levels of wave 4 (green). Waves 4 usually respect shallow Fibs like the 23.6, 38.2, 50% Fibs but a break below the 61.8% Fib invalidates this wave pattern.
USD/CHF Daily Outlook
Daily Pivots: (S1) 0.9869; (P) 0.9928; (R1) 0.9963; More...
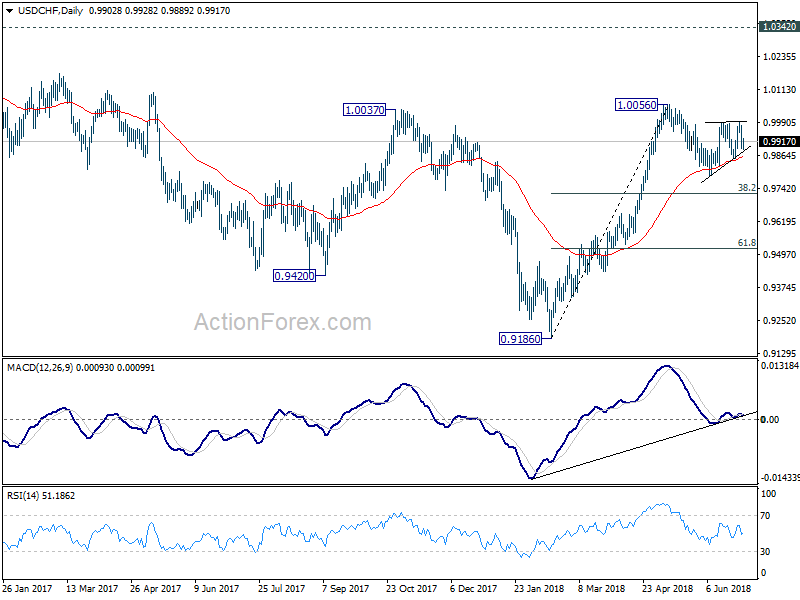
Intraday bias in USD/CHF remains neutral for the moment. The corrective structure of price actions from 0.9787 suggests that fall from 1.0056 is not completed yet. . On the downside, break of 0.9855 will turn bias to the downside for 0.9787 and below. Nonetheless, we'd expect strong support from 0.9722/4 cluster support (38.2% retracement of 0.9186 to 1.0056 at 0.9724, 100% projection of 1.0056 to 0.9787 from 0.9991 at 0.9722) to bring rebound. On the upside, firm break of 0.9991 will target a test on 1.0056 high.
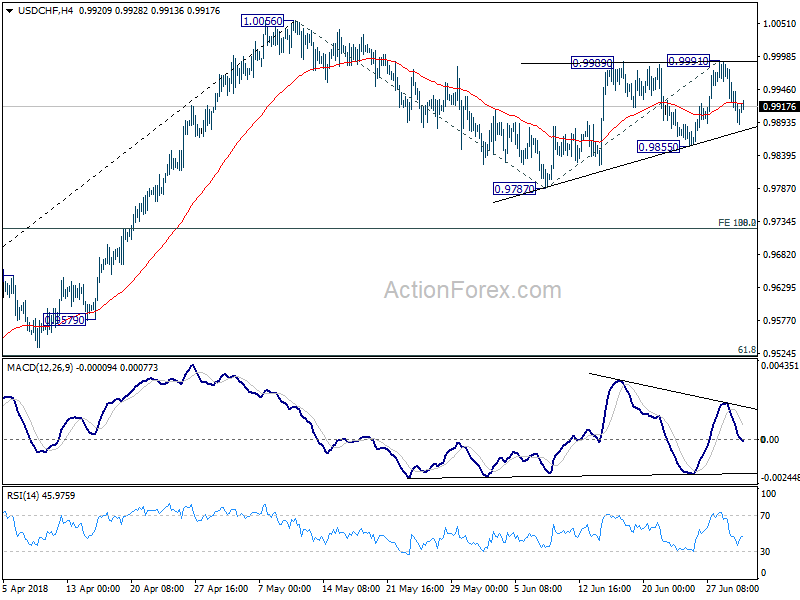
In the bigger picture, rise from 0.9186 is seen as a leg inside the long term range pattern. For now, further rise is expected as long as 38.2% retracement of 0.9186 to 1.0056 at 0.9724 holds. Above 1.0056 will target 1.0342 (2016 high). In that case, we'd be cautious on strong resistance from 1.0342 to limit upside. However, sustained break of 0.9724 will dampen this bullish view and would at least bring deeper fall to 61.8% retracement at 0.9518.
Recession Fears Escalate As Trade War Heats Up
It has been an interesting first half for 2018. Economic fundamentals and politics took center stage as both fought for market influence. The Federal Reserve is in tightening mode as growth and inflation trended higher, while the trade war between the U.S. and the rest of the world particularly with China and the E.U. intensified further. In parallel to these events the U.S. administration provided massive stimulus to an economy that is already near full employment which led to further strengthening ofthe U.S. dollar.
Looking at the big picture, strong economic growth in the U.S., despite signs of softening elsewhere,provided support for equities. However, geopolitical uncertainty and protectionism remained the key downside risk. We think that we’re in the late stage of the current economic cycle, but there are no signs of a recession yet. In such economic conditionsequity investors should be more cautious when investing. A more selective approach is needed as valuations are likely to be further challenged in the months ahead as volatility is further elevated.
Given that inflation will be a key factor driving monetary policies in thesecond half of 2018, investors need to keep a close eye on Oil prices. The decision by OPEC and non-OPEC members to raise crude supplies by about one million barrels starting from 1 July was considered a negative factor for Oil prices. However, the rise in supply from some OPEC and non-OPEC members will be met by a decline from others; doing the math here will be complicated for investors betting on the direction of prices.
Iran currently faces the re-imposition of US sanctions on its Oil exports after the Trump administration’s withdrawal from the nuclear deal. Venezuela is also on investors’ radars as there are further signs that its Oil industry is entering a dangerous new phase. Meanwhile, Libyan Oil supply is also at risk with the current political mess. These three countries together may contribute to a fall of more than two million barrels a day by the end of 2018, which is likely to keep Oil prices elevated in the second half of 2018.
Investors and traders should also keep a close eye on the U.S. Treasury yields. The gap between short- and long-term U.S. bond yields fell to itsnarrowest levels since 2007, and as we get closer to the inversion, the probability of a recession becomes higher.
Euro-Zone’s Trading Lower In The Asian Session
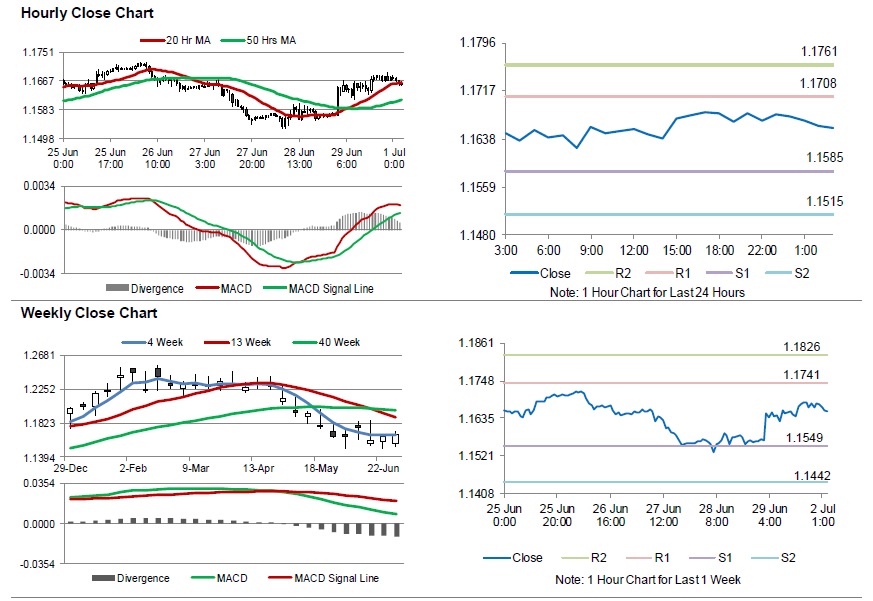
For the 24 hours to 23:00 GMT, the EUR rose 1.00% against the USD and closed at 1.1680 on Friday.
In the economic news, the Euro-zone's preliminary consumer price index climbed 2.0% on an annual basis in June, at par with market expectations. The index had risen by 1.9% in the prior month.
Further, Germany's retail sales data unexpectedly dropped 1.6% on an annual basis in May, defying market expectations for a rise of 1.8%. In the previous month, retail sales had increased by a revised 1.0%. Meanwhile, the nation's unemployment rate remained steady at 5.2% in June, meeting market expectations.
In the US, data released showed that, personal spending rose 0.2% on a monthly basis in May, falling short of market anticipation for an increase of 0.4%. Personal spending had advanced by a revised 0.5% in the previous month. Meanwhile, personal income rose 0.4% on a monthly basis in May, in line with market expectations and compared to a revised gain of 0.2% in the prior month.
Moreover, the nation's Chicago Fed purchasing managers index unexpectedly jumped to a 6-month high level of 64.1 in the US, cofounding market expectations for a fall to 60.0. The index had recorded a level of 62.7 in the preceding month.
Additionally, the US final Reuters/Michigan consumer sentiment index climbed to 98.2 in June, less-than-market expectations for an advance to 99.0. In the previous month, the index had registered a reading of 98.0 and the preliminary figures had indicated a rise to 99.3.
In the Asian session, at GMT0300, the pair is trading at 1.1656, with the EUR trading 0.21% lower against the USD from Friday's close.
The pair is expected to find support at 1.1585, and a fall through could take it to the next support level of 1.1515. The pair is expected to find its first resistance at 1.1708, and a rise through could take it to the next resistance level of 1.1761.
Moving ahead, investors would closely monitor the flash Markit manufacturing PMI for June, slated to release across the euro bloc in a few hours. Also, Euro-zone's producer price index and unemployment rate, both for May, due to release in a few hours will keep the investors on their toes. Later in the day, the US Markit manufacturing PMI for June and construction spending data for May, would pique significant amount of investor attention.
The currency pair is showing convergence with its 20 Hr moving average and trading above its 50 Hr moving average.
UK First Quarter GDP Growth Revised Up
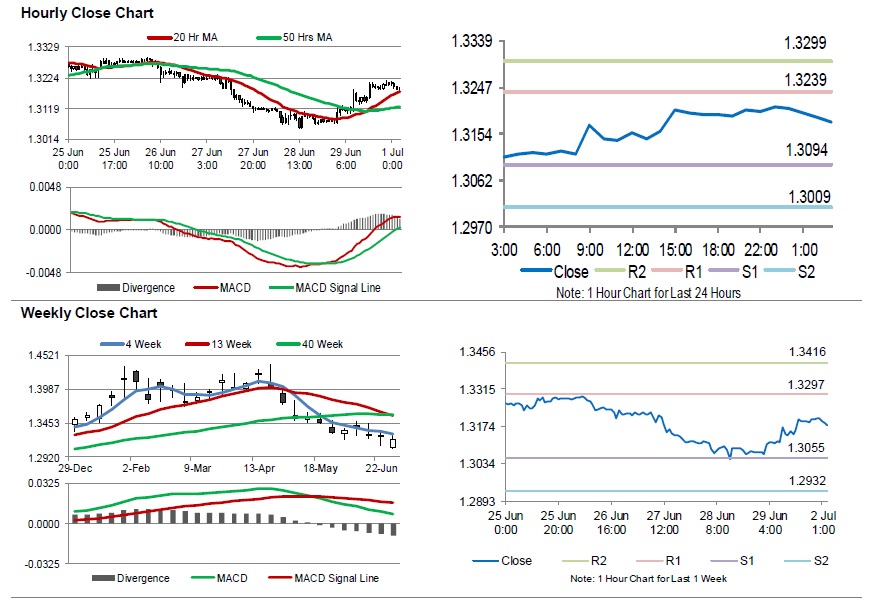
For the 24 hours to 23:00 GMT, the GBP rose 0.96% against the USD and closed at 1.3202 on Friday, after UK’s economic growth was revised higher in the first quarter of 2018.
Data showed that the nation’s final gross domestic product (GDP) advanced 0.2% on a quarterly basis in the first three months of 2018, higher than market expectations. GDP had recorded a rise of 0.4% in the previous quarter. The preliminary figures had indicated an advance of 0.1%. Meanwhile, the nation’s net consumer credit expanded by £1.4 billion in May, falling short of market expectations for a gain of £1.5 billion. In the previous month, net consumer credit had advanced £1.8 billion.
Moreover, number of mortgage approvals for house purchases surprisingly jumped to a 4-month high level of 64.5K, compared to market expectations of a fall to a level of 62.3K. In the previous month, number of mortgage approvals had registered a revised level of 62.9K. Britain’s final total business investment rose of 2.0% on yearly basis in 1Q, in line with market expectations. In the prior quarter, total business investment had climbed by 2.6%.
In the Asian session, at GMT0300, the pair is trading at 1.3179, with the GBP trading 0.17% lower against the USD from Friday’s close.
The pair is expected to find support at 1.3094, and a fall through could take it to the next support level of 1.3009. The pair is expected to find its first resistance at 1.3239, and a rise through could take it to the next resistance level of 1.3299.
Looking forward, traders will await the release of UK’s Markit manufacturing PMI for June, scheduled to release in a few hours.
The currency pair is showing convergence with its 20 Hr moving average and trading above its 50 Hr moving average.
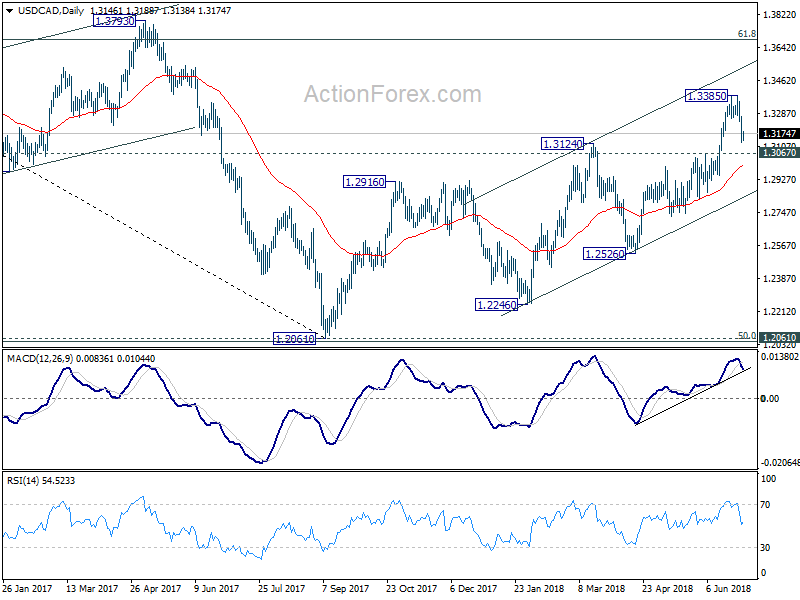
USD/CAD Daily Outlook
Daily Pivots: (S1) 1.3079; (P) 1.3178; (R1) 1.3233; More...
With 1.3258 minor resistance intact, pull back from 1.3385 short term top could extend lower. But for now, , we'd expect downside to be contained there to bring rebound. On the upside, above 1.3258 minor resistance will bring retest of 1.3385. However, firm break of 1.3067will bring deeper decline to channel support (now at 1.2831).
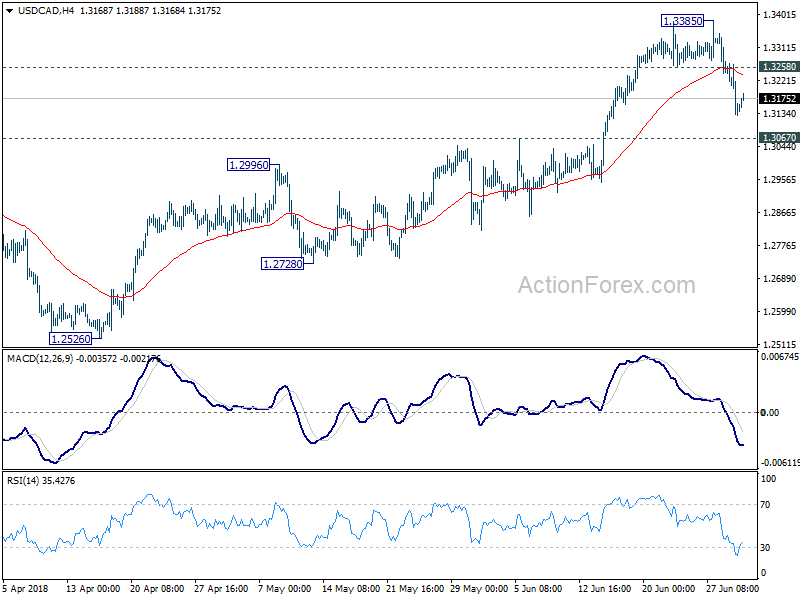
In the bigger picture, as long as channel support (now at 1.2825) holds, we'll holding to the bullish view. That is, fall from 1.4689 (2015 high) has completed at 1.2061, ahead of 50% retracement of 0.9406 (2011 low) to 1.4689 (2015 high) at 1.2048. Further rally should be seen for 61.8% retracement of 1.4689 to 1.2061 at 1.3685 and above.
Japanese Yen Trading On A Stronger Footing This Morning
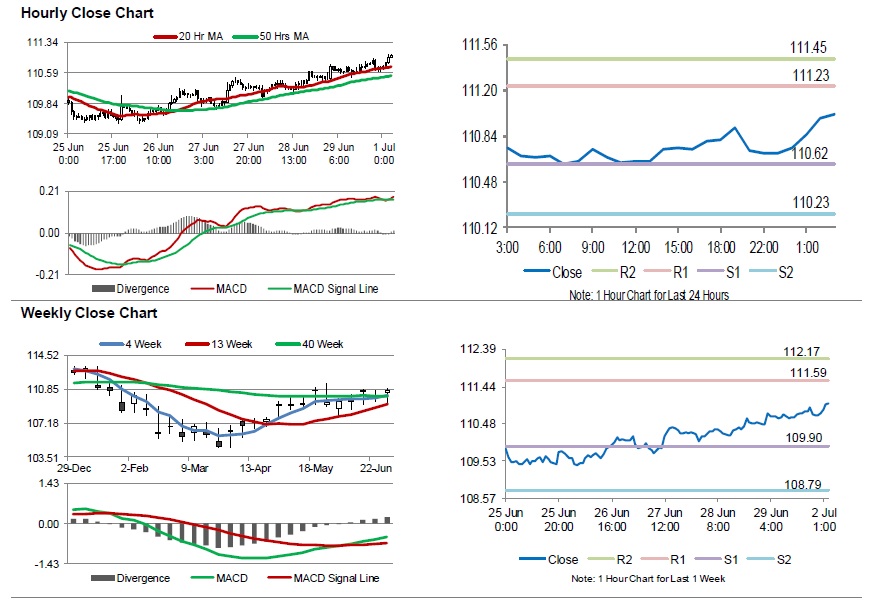
For the 24 hours to 23:00 GMT, the USD rose 0.19% against the JPY and closed at 110.72 on Friday.
On Friday, data showed that Japan’s housing starts unexpectedly rose 1.3% on an annual basis in June, beating market expectations for a drop of 5.7%. Housing starts had recorded a gain of 0.3% in the prior month.
Separately, the nation’s consumer confidence index unexpectedly dropped to a level of 43.7 in June, defying market expectations for a steady reading. In the preceding month, the index had recorded a reading of 43.8.
In the Asian session, at GMT0300, the pair is trading at 111.01, with the USD trading 0.26% higher against the JPY from Friday’s close.
Overnight data showed that Japan’s Nikkei final manufacturing PMI climbed to a level of 53.0 in June, following a reading of 52.8 in the previous month. The preliminary figures had indicated an advance to 53.1.
The pair is expected to find support at 110.62, and a fall through could take it to the next support level of 110.23. The pair is expected to find its first resistance at 111.23, and a rise through could take it to the next resistance level of 111.45.
Amid lack of key economic releases in Japan today, investor sentiment will be determined by global macroeconomic releases.
The currency pair is trading above its 20 Hr and 50 Hr moving averages.
Switzerland’s KOF Leading Indicator Raised To A 3-Month-High Level In June
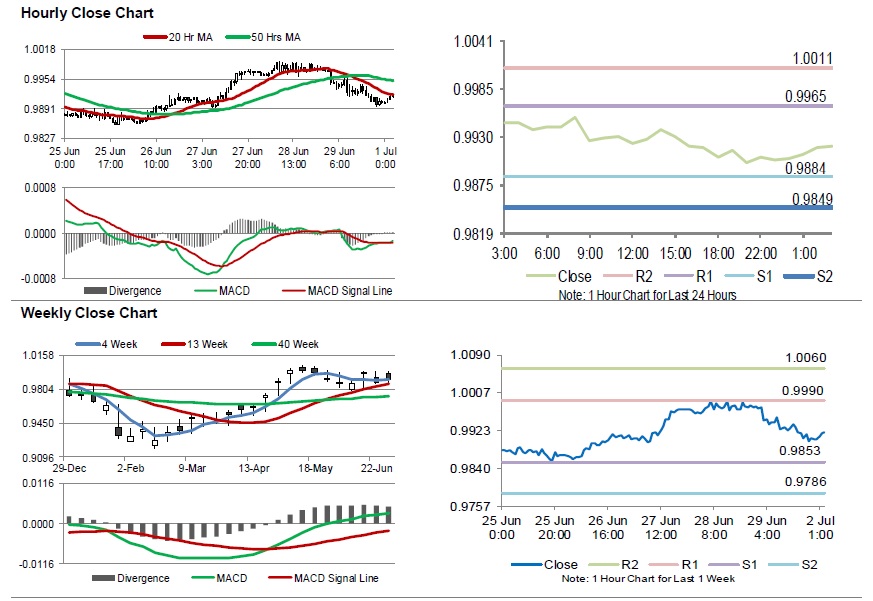
For the 24 hours to 23:00 GMT, the USD declined 0.75% against the CHF and closed at 0.9900 on Friday.
The Swiss Franc gained ground against the USD on Friday, after KOF economic barometer advanced above expectations to a 3-month-high level of 101.7 in June, defying market expectations of a drop to a level of 99.8. The barometer had recorded a level of 100.0 in the previous month.
In the Asian session, at GMT0300, the pair is trading at 0.9920, with the USD trading 0.20% higher against the CHF from Friday's close.
The pair is expected to find support at 0.9884, and a fall through could take it to the next support level of 0.9849. The pair is expected to find its first resistance at 0.9965, and a rise through could take it to the next resistance level of 1.0011.
Trading trend in the Swiss franc will be determined by retail sales real data for May and manufacturing PMI for June slated to release in a while.
The currency pair is showing convergence with its 20 Hr moving average and trading below its 50 Hr moving averages.