Sample Category Title
Traders Increased Bets for Higher Oil Prices after Uneventful OPEC Deal
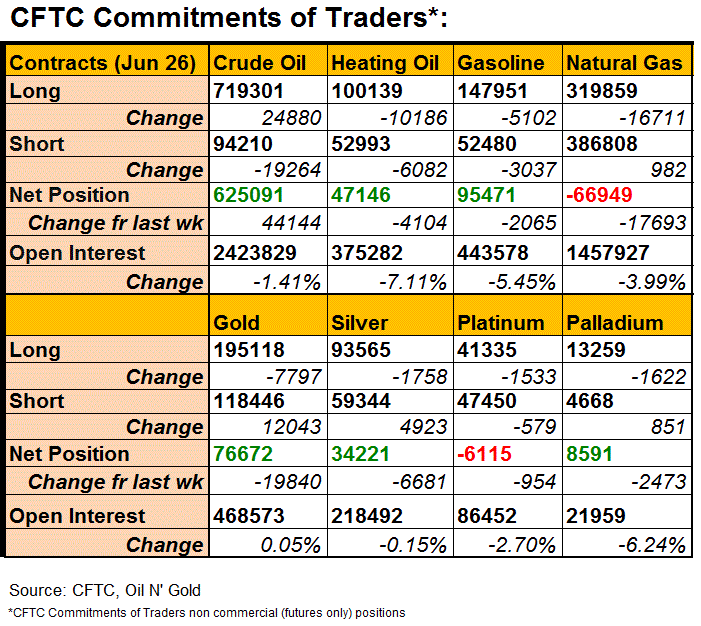
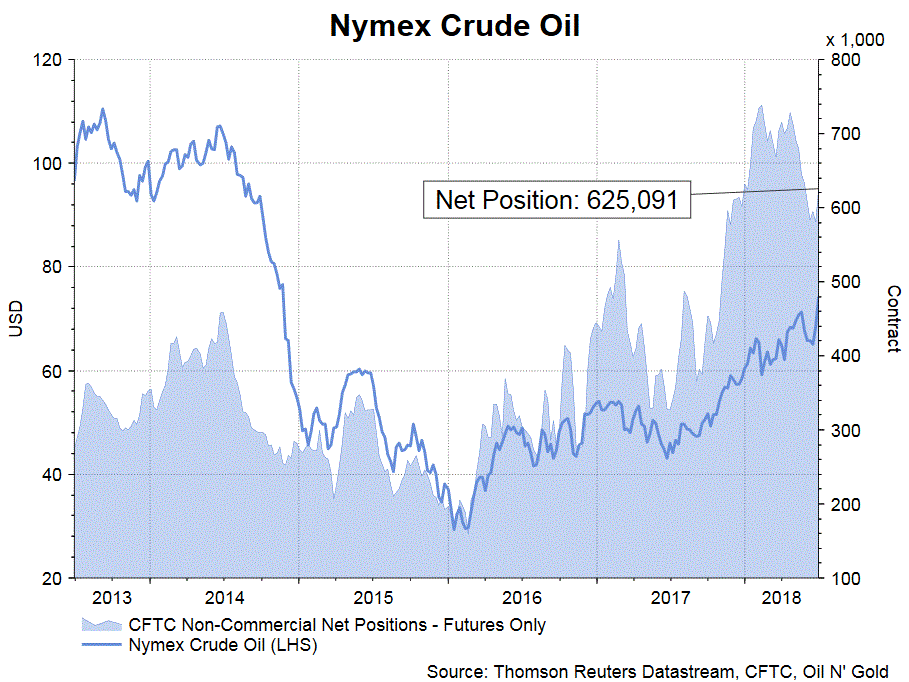
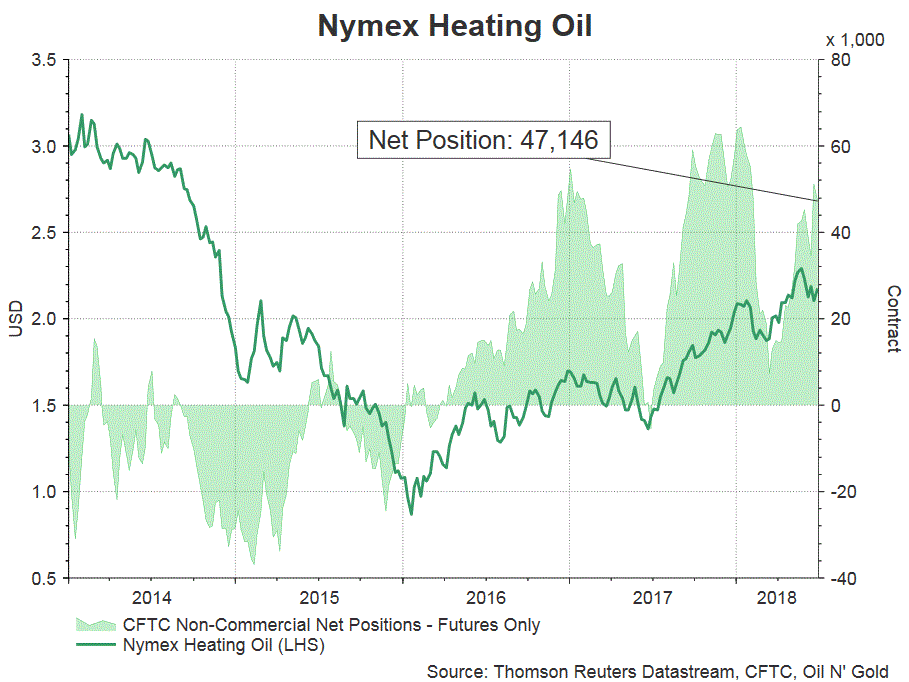
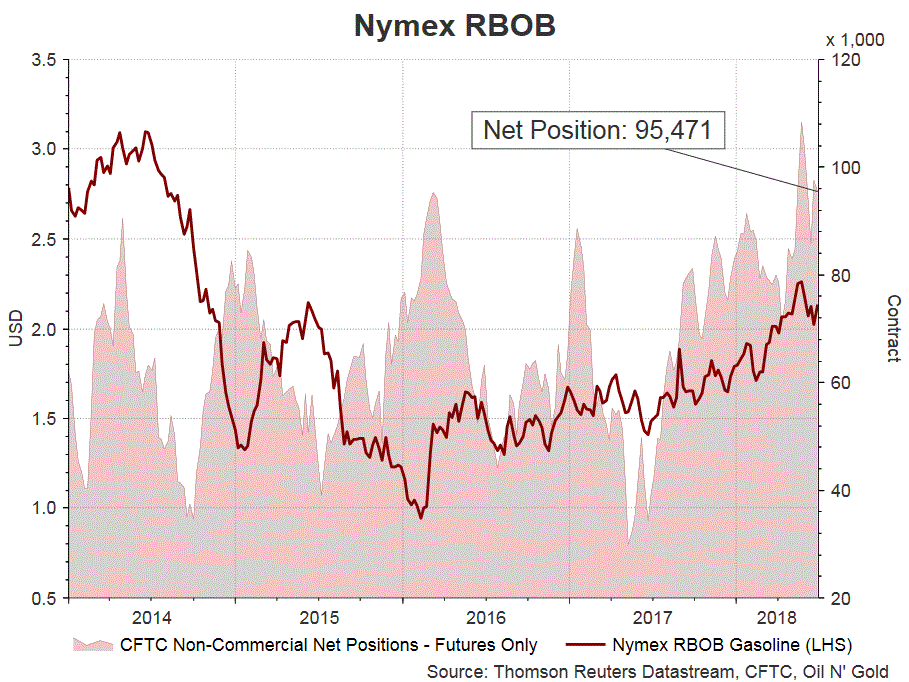
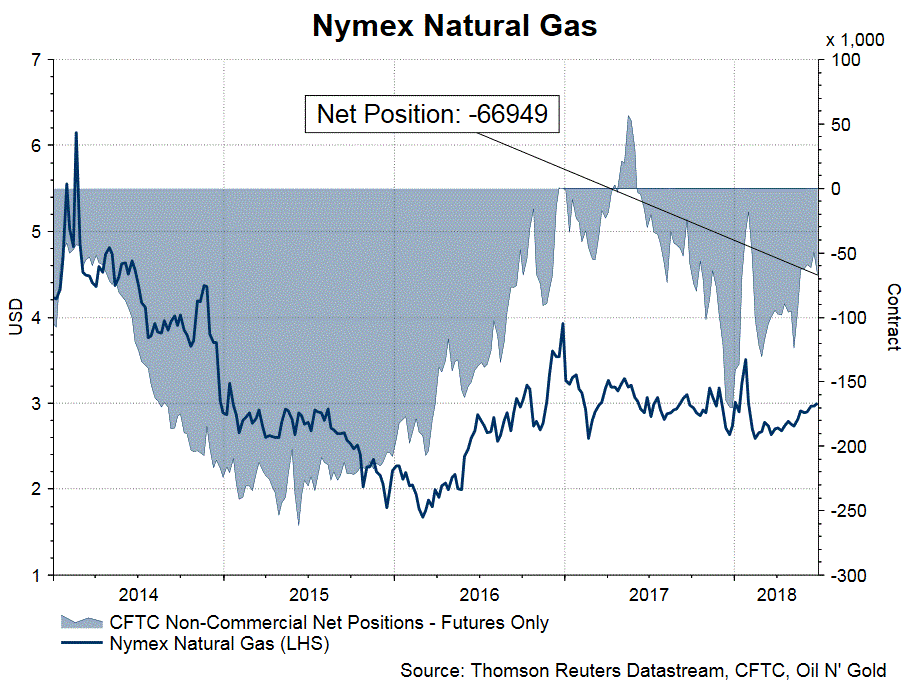
According to the CFTC Commitments of Traders report for the week ended Jun 26, net LENGTH for crude oil futures jumped +44 144 contracts to 625 091. Net LENGTH for heating oil futures dropped -4 104 contracts to 47 146 while that for gasoline fell -2 065 contracts to 95 471. Net SHORT for natural gas increased +17 693 contracts to 66 949 for the week. During the week, the front-month WTI crude oil contract jumped +8.4% while the Brent contract added +1.64%. For refined oil products, the Nymex heating oil and RBOB gasoline contracts added +0.34% and +1.8% respectively. The Nymex natural gas contract gained +1.34% for the week.
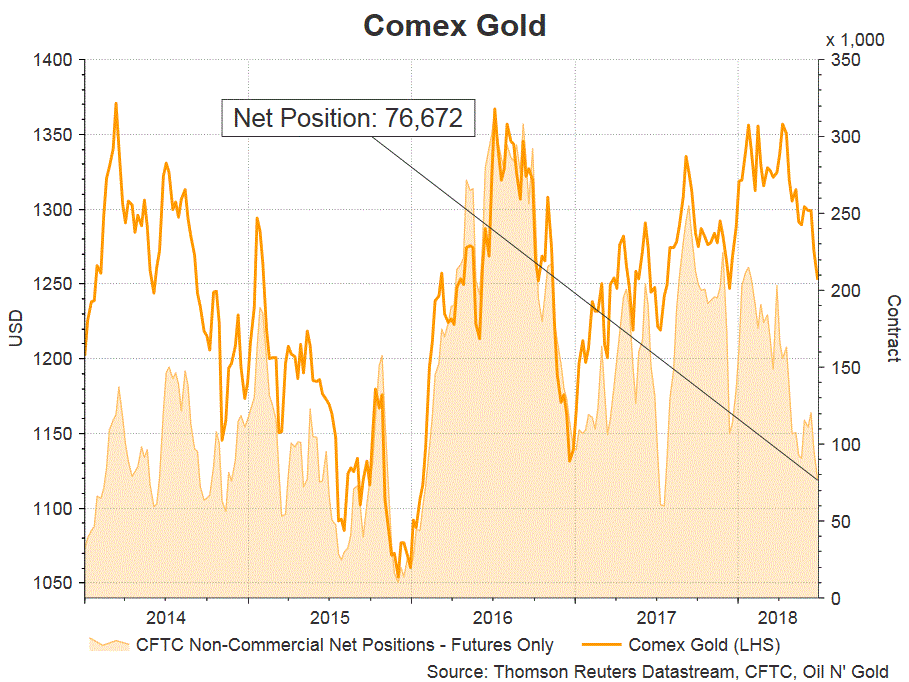
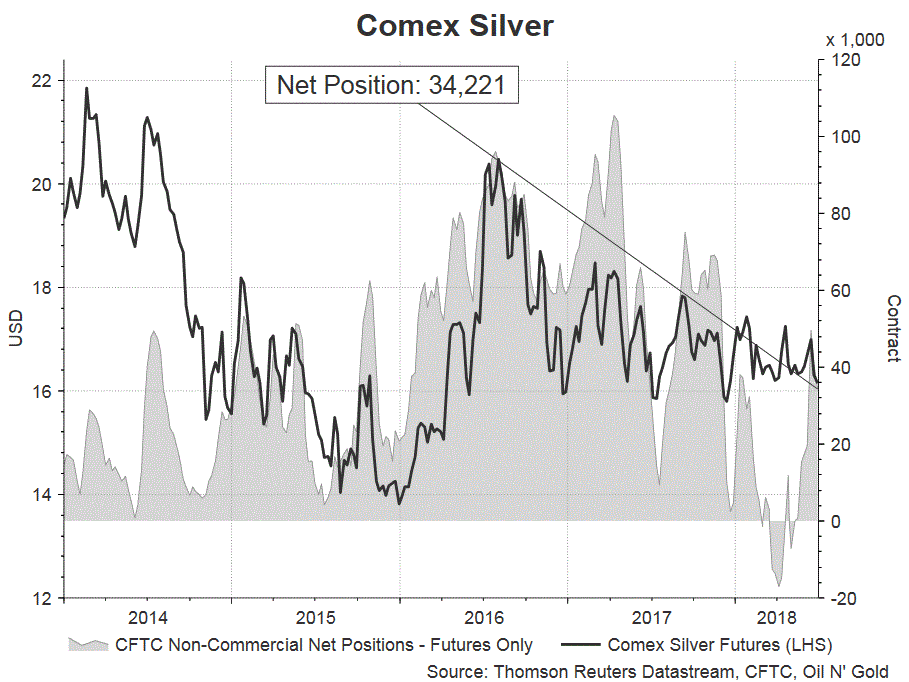
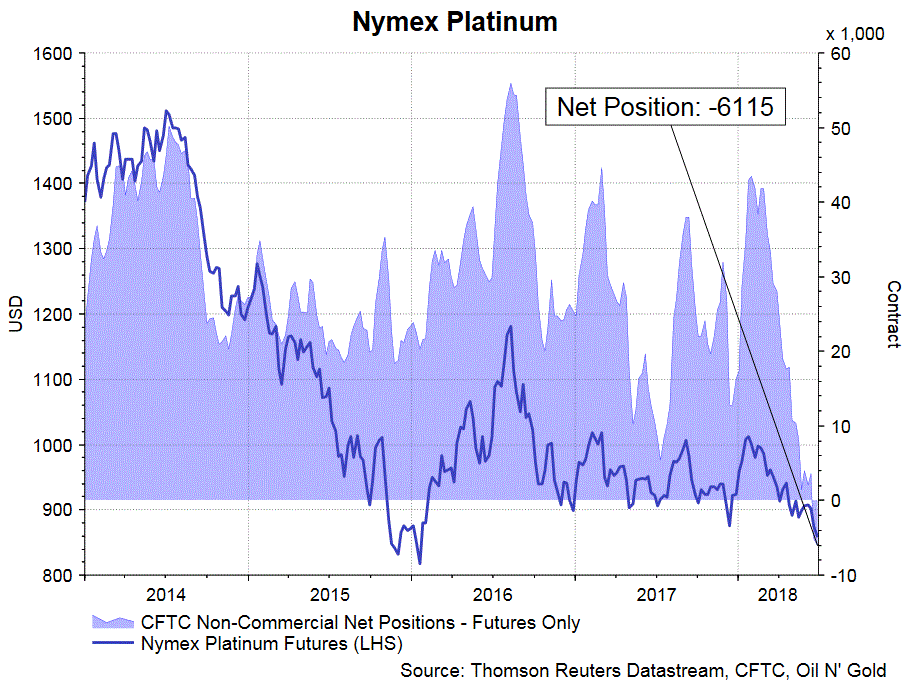
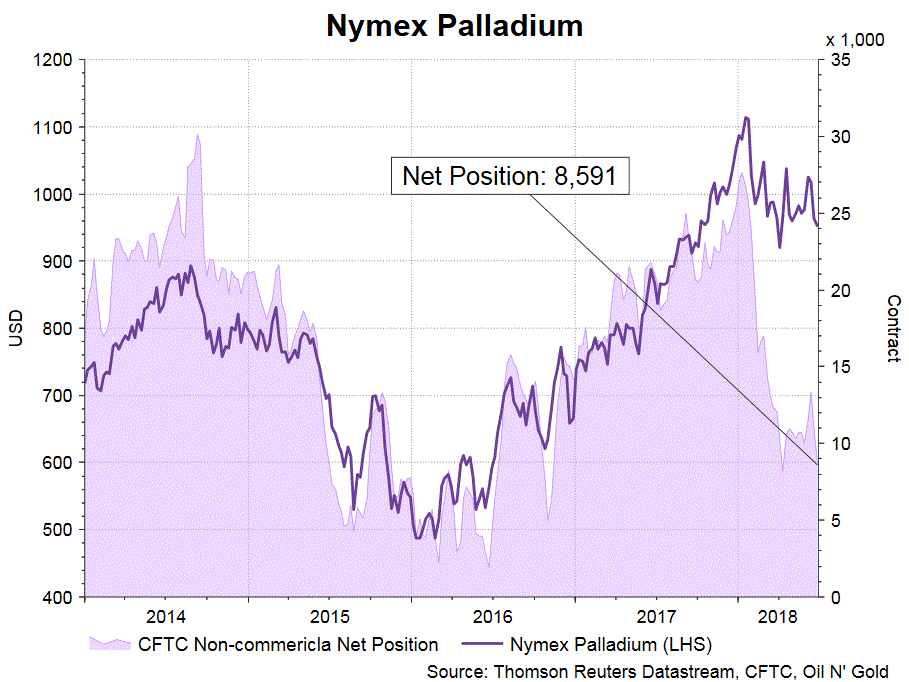
Traders turned either less bullish or more bearish over the precious metal complex. Net LENGTH for the gold futures declined -19 840 contracts to 76 672 while that for silver fell -6 681 contracts to 34 221 for the week. For PGMs, NET SHORT of platinum rose 954 contracts to 6 115 while that for palladium declined -2 473 contracts to 8 591. The benchmark Comex gold and silver contract declined -1.49% and -0.4% respectively. For PGMs, while the Nymex platinum contract climbed +0.74% higher, the corresponding palladium contract was down -0.59%.
Market Morning Briefing: Dollar Yen Has Broken Above Crucial Resistance Level Near 110.75
STOCKS
Dow (24271.41, +0.23%) has risen and while the daily trend support near 24000 holds, the index could move up towards 25000. Near term looks bullish.
Dax (12306, +1.06%) is stable and is stuck in the broad 12400-12100 region just now. Break below 12100 support could take it lower towards weekly support near 11800 as mentioned last week. Watch price action near 12100.
Nikkei (22288.67, -0.071%) is stable while above 22000 and could gradually try to move back towards 22600-22800 levels. Overall broad movement in the 22000-22800 region looks likely in the medium term.
Shanghai (2823.43, -0.84%) bounced back to trade slightly higher. While above 2750, there is chance that the index could trade sideways for sometime within 2750-2850 levels. But a break below 2750 in the medium term could open up further downside of 2700 in the longer run.
Nifty (10714.30, +1.18%) rose back sharply from levels near 10550 and is again set to test resistance near 10850. A break above 10850 would be indicative of bullishness in the longer run, negating a sharp correction from here.
COMMODITIES
3-day resistance on Nymex WTI (73.22) seem to be holding well for now and while that holds, the price could come down further to test 72. Brent (78.19) on the other hand may have some space on the upside towards 82 which may be tested before the price comes down.
Gold (1252.40) is trading slightly higher and has support near 1240. While above 1240, the Gold price could trade sideways in the 1270-1240 region for some time before attempting higher levels in the longer run.
Copper (2.9705) may try to move up as the 2.90-2.95 is a support zone and it would be difficult to break that on the downside. While above the support zone, Copper may try to move up in the near term.
FOREX
Euro (1.1656): A migration deal between EU leaders has strengthened the Euro (against our expectation). It has already tested resistance near 1.169-1.170 on daily candles. While below 1.17, it could again dip back towards 1.155. However a breach above 1.17 could make it bullish towards 1.183-1.185 in the near term.
Dollar Index (94.71): Euro's bullishness has led to the Dollar Index falling to test support near 94.5 on daily and 3 day candles. 94.2 is also an important support level which could restrict the current downmove for the Dollar Index. A break below 94.2 would be bearish in the near term.
Dollar Yen (111.00): Dollar Yen has broken above crucial resistance level near 110.75 on daily and 3 day candles to test a high near 111. Its previous high (in May) of 111.40 is a crucial level now, whose breach would make Dollar Yen bullish. We have been preferring bearishness in Dollar Yen from here; but we might have to change that view if 111.40 is breached.
Euro Yen (129.40): Euro Yen is testing resistance on daily candles and could move up towards higher resistance near 130 in the next couple of sessions. A breach above 130.30 (21 weeks MA) would be bullish and might just correspond with a breach of 1.17 and 111.40 by Euro and Dollar Yen respectively.
Pound (1.3180): Weakness in the Dollar could be reflected against Pound as well in this week. Pound could move up towards resistance on daily and 3 day candles near 1.33, whose breach would be bullish in the coming weeks. We have been saying that 1.30 is a crucial level for the Pound – if it breaks lower, then medium term could be bearish; if it stays above it, it could breach 1.33 and thereby turn bullish.
Dollar Rupee (68.47): If and while the Support at 68.30 holds, we might see a fresh rise towards 68.70-80 this week.
INTEREST RATES
The risk aversion sentiment in global markets continues to sustain. A continuation of the same could lead to a further fall in bond yields over the coming weeks.
German 10 year bond yield (0.30%) is testing support near 0.3% and could possibly rise back towards 0.5% over the next 1-2 weeks while it stays above 0.3%. However, a break of 0.3% will take it lower to previous lows near 0.18%.
US 10 year (2.86%), 30 Year (2.99%), 5 Year (2.74%), 2 Year (2.53%) : The US 10-2 Year yield spread has dipped even lower to 0.33%. As the spread dips lower, the murmurs of an impending US recession would grow stronger.
The US 10 Year yield's gradual downtrend could target support near 2.70%-2.65% on medium term chart in the coming weeks.
Similarly, the 30 Year yield also looks like it could move towards 2.90%.
EU warned auto tariffs could cost USD13-14B in US GDP
According to a report by POLITICO, European Commission sent a 11-page document to the US Commerce Department's Bureau of Industry and Security on Friday. It warned that tariffs on European cars will be "harmful first and foremost for the US economy." And, the impact of such tariffs on US GDP would be "in the order of 13-14 billion USD." Additionally, the "current account balance of the US would be not affected positively."
The document also pointed out that European carmakers contributed to production of 2.9m cars in 2017, around 26% of US production. And, production of EU-owned American car companies amounts to 16% of national production, or 1.8m vehicles. In addition to that, "EU companies based in the US export a significant part of their production, thus contributing substantially to improving the US trade balance, which is a priority of the administration."
Also, "around 60 percent of automobiles produced in the US by companies with exclusive EU ownership are exported to third countries, including the EU. Measures harming these companies would be self-defeating and would weaken the US economy."
EUR/USD Trading In Bullish Zone Above 1.1600
Key Highlights
- The Euro formed a solid support above 1.1510 and bounced back against the US Dollar.
- There was a break above a connecting bearish trend line with resistance at 1.1650 on the 4-hours chart of EUR/USD.
- The Euro Zone CPI in June 2018 increased 2% (YoY), more than the last reading of +1.9%.
- Today in the US, the ISM Manufacturing PMI for June 2018 will be released, which is forecasted to decline from 58.7 to 58.3.
EURUSD Technical Analysis
The Euro was rejected multiple times around the 1.1510-1.1520 support area against the US Dollar. As a result, the EUR/USD pair bounced back sharply and traded above the 1.1600 resistance.
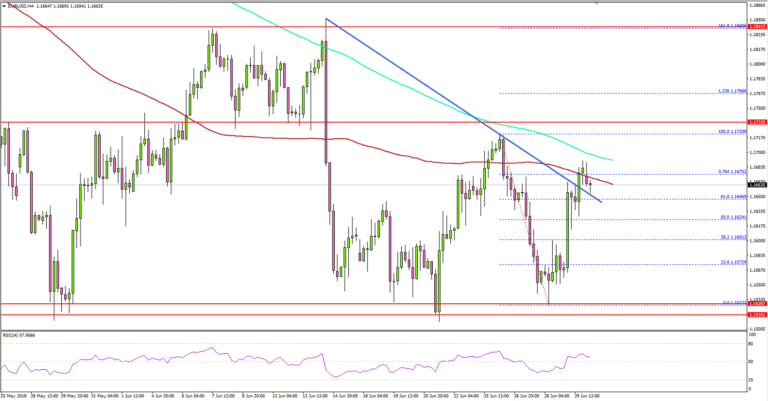
The 4-hours chart of EUR/USD indicates that the pair formed a solid support above 1.1510. It jumped higher and broke the 50% Fib retracement level of the last decline from the 1.1720 high to 1.1522 low.
More importantly, there was a break above a connecting bearish trend line with resistance at 1.1650 on the same chart. At the moment, the pair is trading near the 100 simple moving average (red, 4-hours) with positive signs.
It may perhaps continue to move higher towards the last swing high at 1.1720. Above this, the next stop for buyers could be the 1.236 Fib extension level of the last decline from the 1.1720 high to 1.1522 low at 1.1766.
On the other hand, if the pair corrects lower, it may well find support near the 1.1640 and 1.1600 support levels in the near term.
Recently in the Euro Zone, the CPI figure for June 2018 was released by the Eurostat. The market was looking for rise of 2% in the CPI in June 2018 compared with the same month a year ago.
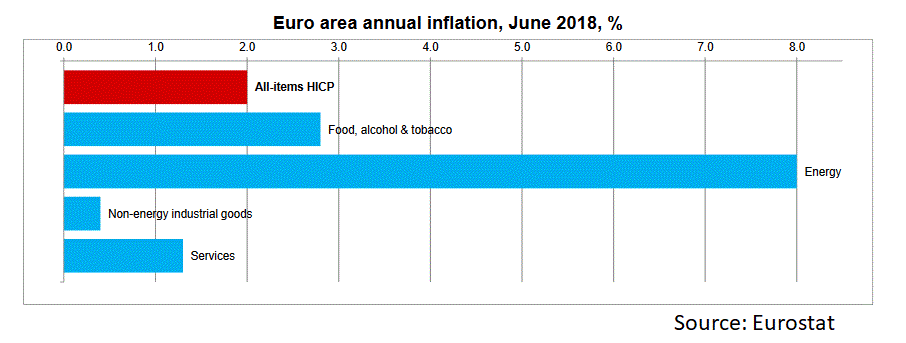
The actual result was in line with the forecast with an increase of 2%, more than the last 1.9%. The report added that:
Looking at the main components of euro area inflation, energy is expected to have the highest annual rate in June (8.0%, compared with 6.1% in May), followed by food, alcohol & tobacco (2.8%, compared with 2.5% in May), services (1.3%, compared with 1.6% in May) and non-energy industrial goods (0.4%, compared with 0.3% in May).
The Euro maintained a bid tone recently against the US Dollar. Having said that, the 1.1700 resistance must be breached sooner or later. If not, there is a risk of a downside reaction back towards 1.1600.
Economic Releases to Watch Today
- Euro Zone Unemployment Rate for May 2018 – Forecast 8.5%, versus 8.5% previous.
- Euro Zone PPI for May 2018 (YoY) – Forecast +2.4%, versus +2.0% previous.
- Germany's Manufacturing PMI for June 2018 – Forecast 55.9, versus 55.9 previous.
- Euro Zone Manufacturing PMI June 2018 – Forecast 55.0, versus 55.0 previous.
- UK Manufacturing PMI for June 2018 – Forecast 53.5, versus 54.4 previous.
- US Manufacturing PMI for June 2018 – Forecast 55.0, versus 54.6 previous.
- US ISM Manufacturing PMI for June 2018 – Forecast 58.3, versus 58.7 previous.
New Zealand Treasury: Consumption and business confidence pose downside risks to growth
New Zealand Treasury's Monthly Economic Data report noted that the 0.5% real GDP growth in Q1 was below the forecast set in the Budget Economic and Fiscal Update (BEFU). Terms of trade fell by -6.7% due to a slight fall in export prices and an increase in import prices, contributing to -0.4% decline in nominal GDP.
Consumption indicators were soft. Business confidence deteriorated further in June, hitting post-election lows. Combined they suggest "there is a little less momentum in the economy and poses some downside risk to our BEFU GDP forecast in the near-term."
The report also warned that "risks around trade continue to escalate with tariffs affecting a range of trade between the US and China, and a growing number of other countries."
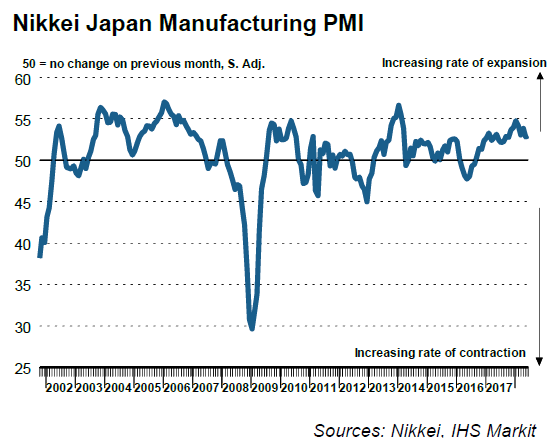
Japan PMI manufacturing revised down to 53.0
Japan PMI manufacturing was finalized at 53.0 in June, revised down from 53.1.
Quote from Joe Hayes, Economist at IHS Markit:
"Japan manufacturing PMI data continue to signal that the sector's current expansion phase still has legs. Output growth edged up in June, supported by further inflows of new work and an accelerated rate of employment growth.
"Concerns do remain however, as new order growth eased to a ten-month low and export sales decreased for the first time since August 2016. Moreover, with input price inflation jumping to a three-and-a-half year high, manufacturers may be forced to absorb higher cost burdens in order to remain competitive, particularly if the yen faces further safe haven demand."
Japan Tankan: Large manufacturing sentiments deteriorated for another quarter
The BoJ's quarterly Tankan survey showed notable worsening in manufacturer's sentiments in Q2.
The Larger Manufacturing Index dropped to 21, down from 24 and missed expectation of 23. It's also a second straight quarterly decline from Q4's 26, the first time since 2012. Large Manufacturer outlook rose to 21, up from 20.
Large Non-Manufacturing index rose to 24, up from 23, beat expectation of 23. Large Non-Manufacturing Outlook rose to 21, up from 20 but missed expectation of 22.
Large all industry capex rose 13.6%, beat expectation of 0.2%.
Forex And Cryptocurrencies Forecast
First, a review of last week's forecast:
EUR/USD. The forecast for this pair turned out to be almost 100% correct. Recall that we spoke of a slight increase to 1.1725-1.1750 (and the pair actually climbed to 1.1720), as well as its possible drop and another attempt to test the level of 1.1500 (on Thursday the pair dropped to the horizon 1.1525). In the end, while maintaining the balance between bulls and bears, it returned to the Pivot Point zone for the last one and a half months and completed the five-day period at the level of 1.1680;
GBP/USD. Thanks to the votes from the Bank of England, a positive mood prevailed in the analysts' camp last week - 65% of them expected a pair to rise above 1.3350. However, those 35% of experts who believed that all hawkish statements of the regulator were nothing more than an attempt to support the rate of the British pound, which had lost more than 1,000 points since April, turned out to be right. According to their forecasts, the pair was to fall into the zone of 1.3000-1.3100. That's exactly what happened: the local bottom was found exactly in the middle of the zone, after which the GBP/USD returned to 1.3200;
USD/JPY. Once again, the oscillators turned out to be right - 15% of them pointed it was oversold, and that was enough for the pair to go up. At the same time, it stayed within the rather narrow monthly lateral channel 109.20-110.90, which confirmed the consolidation of the pair in the 110.10 zone;
Cryptocurrencies. The forecast for BTC/USD said that if the pair confidently passes support in the $5,900-6,100 zone, with a high probability, after a while it will be seen near the horizon $4,300. And it was on June 28, that the bears decidedly went for a breakthrough. It seemed that the collapse was imminent, but when it reached $5,790, the pair first froze, and then jerked up on June 30, reaching a height of $6,525. As a result, over a day, bitcoin has grown by more than 10%, the reason for which was the mysterious large-scale purchase of BTC by an unknown investor, which occurred after the CME futures closed.
Many altcoins went into the growth. following bitcoin. The highest growth was demonstrated by Bitcoin Cash + 13% and Litecoin + 11%. The average growth of the top twenty cryptos was 7-10%.
As for the forecast for the coming week, summarizing the opinions of a number of analysts, as well as forecasts made on the basis of a variety of methods of technical and graphical analysis, we can say the following:
Last week, the short-term growth of the EUR/USD was caused by the results of the EU summit and the agreement on migration issues reached. However, in the near future it is hardly possible to have a release of new economic data, which would push the pair EUR/USD further up. The publication of the data on the labor market in the United States (NFP) on Friday July 07 is of particular interest, but the information on the possible tightening of the Fed's monetary policy may be on the other side of the scale. As a result, according to 35% of experts, the pair will be able to stay in the side corridor 1.1500-1.1725.
At the same time, it is possible that it will still be able to break the upper boundary of this channel and rise to zone 1.1725-1.1825. This version is supported by 20% of analysts and graphical analysis on H4.
The remaining 45% of experts, together with graphical analysis on D1 and 15% of oscillators signaling that the pair is overbought, believe that it will once again test the level of 1.1500, and in case of its breakdown it will drop by 100-150 points lower;
A similar picture is drawn by graphical analysis for the GBP/USD as well: on H4, a rise to the level of 1.3300-1.3335, and a fall into the zone 1.2900-1.3100 on D1. 15% of the oscillators also agree with the latter scenario.
As for the experts' opinion, they are divided almost equally: 35% support the growth of the pair, 35% are for its fall and 30% favor the sideways trend.
We can assume from all of the above, that the pair will continue to move east along the horizon 1.3200, fluctuating in the range 1.3050-1.3325.
If we talk about a medium-term forecast, 65% of analysts have supported the growth of the pair to 1.3450-1.3615 zone, and only 35% have voted for its fall below the level of 1.3000. In the event that the head of the Bank of England, Mark Carney, directly or indirectly confirms the "hawkish" statements of his colleague Andy Haldane in his speech on Thursday, July 05, the pair's jump may be expected as early as this week;
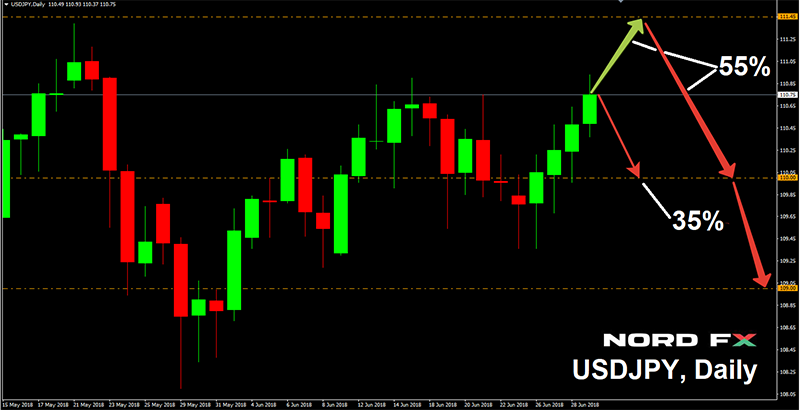
USD/JPY. Despite the fact that it is already 10% of oscillators on H4 and D1 that give signals that the pair is overbought, most experts (55%) still expect the pair to grow at least to the 111.45 horizon. And it is only after that, in their opinion, it can return to the support of 110.00. This development is supported by graphical analysis on D1, it warns that, if this level is broken through, the pair can very quickly drop another 100 points lower;
Cryptocurrencies. Seeing the latest jerk up of the bitcoin, the crypto world wondered: what was this? The long-awaited turn of the trend and the fulfillment of John McAfee's prophecy that bitcoin will cost $1 million per coin by 2020? Or just another trap? And, maybe, the IMF's Kenneth Rogoff was right, when he said that by the end of the year the rate of this forefather of virtual currencies will fall to some miserable $100?
Perhaps the answer to this question remains to be seen soon. For now, as the ancient Greek sage Skelef said, everyone sees what he wants. Analysts who are optimists say that if bitcoin confidently overcomes the level of $ 6,700, it will be a strong enough positive signal for the trend to change. As for the pessimists, we see the last breath of a dying coin. And if the pair BTC/USD is fixed below the horizon of $5,900, it is highly likely that after a while it will be possible to be seen about $4,300, and then even lower.
China Caxin PMI manufacturing dropped to 51.0, deteriorating exports and weak employment
China Caxin PMI manufacturing dropped 0.1 to 51.0 in June, met expectations. Caixin noted in the release that "productions expands as faster pace ... despite softer rise in total new orders and further decline in export sales". And, "staffing levels fall at quickest rate for nearly a year."
Quote from the release by Dr. Zhengsheng Zhong, Director of Macroeconomic Analysis at CEBM Group:
"The Caixin China General Manufacturing PMI stood at 51.0 in June, dropping slightly from a month earlier but remaining in expansion territory. The output index continued to rise, suggesting that manufacturing supply was relatively strong. The new order index dropped marginally, and the employment index dropped for the second consecutive month, indicating worsening layoffs. The index for new export orders fell to a low for the year so far and remained in contraction territory, pointing to a grim export situation amid escalating trade disputes between China and the U.S., which led to weak demand across the manufacturing sector.
"The indices for output charges and input prices both rose, with the latter jumping sharply, continuing to drive the output index upward and suggesting that the year-on-year growth of the producer price index probably continued to rise significantly in June. Corporate profits could have been squeezed due to the rapid rise in input prices, leading to a dip in the future output index. The two indices measuring stocks of finished goods and purchases both dropped, with the latter falling into contraction territory for the first time this year, reflecting that the manufacturing sector is stepping into a destocking phase amid weak demand. The suppliers' delivery times index remained in contraction territory, indicating delivery delays and poor capital turnover among manufacturing suppliers.
"Overall, the manufacturing PMI survey pointed to strengthening price pressures in June. Deteriorating exports and weak employment, along with companies' destocking and poor capital turnover, put pressure on the manufacturing sector."
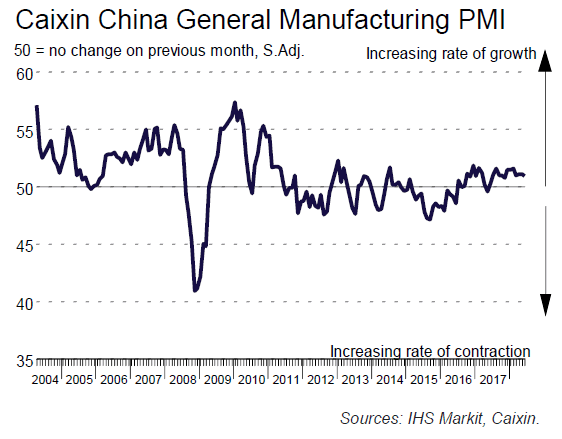
Released over the weekend, the official China PMI manufacturing dropped -0.4 to 51.5 in June. Official PMI non-manufacturing rose 0.1 to 55.0.
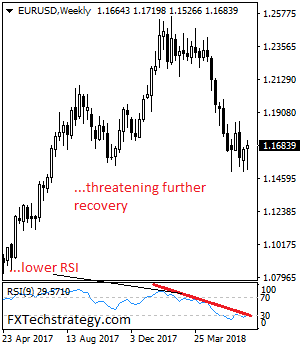
EURUSD – Risk Remains Higher On Recovery
EURUSD - The pair may have hesitated on Thursday but still looks to weaken further. On the upside, resistance comes in at 1.1750 level with a cut through here opening the door for more upside towards the 1.1800 level. Further up, resistance lies at the 1.1850 level where a break will expose the 1.1900 level. Conversely, support lies at the 1.1650 level where a violation will aim at the 1.1600 level. A break of here will aim at the 1.1550 level. Below here will open the door for more weakness towards the 1.1500. All in all, EURUSD faces further upside pressure but with caution of a recovery.