Sample Category Title
EUR/CHF Weekly Outlook
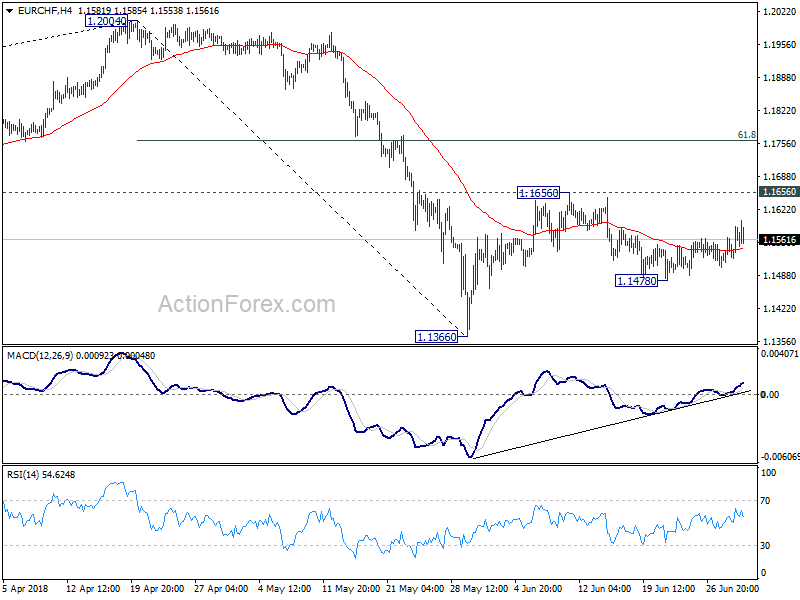
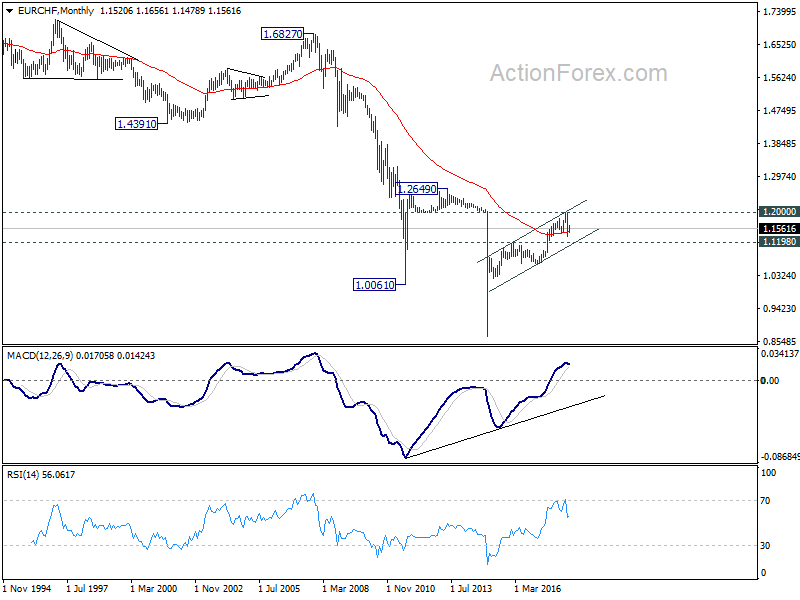
EUR/CHF edged higher to 1.1599 last week but upside momentum has been unconvincing. The rebound from 1.1478 so far looks rather correctively. Hence, initial bias is neutral this week first. On the upside, break of 1.1656 will resume the rebound from 1.1366 to 61.8% retracement of 1.2004 to 1.1366 at 1.1760. But we would expect strong resistance from there to limit upside. For now, we'd expect at least one more falling leg before the correction from 1.2004 completes. Below 1.1478 will turn bias to the downside for 1.1366 and below.
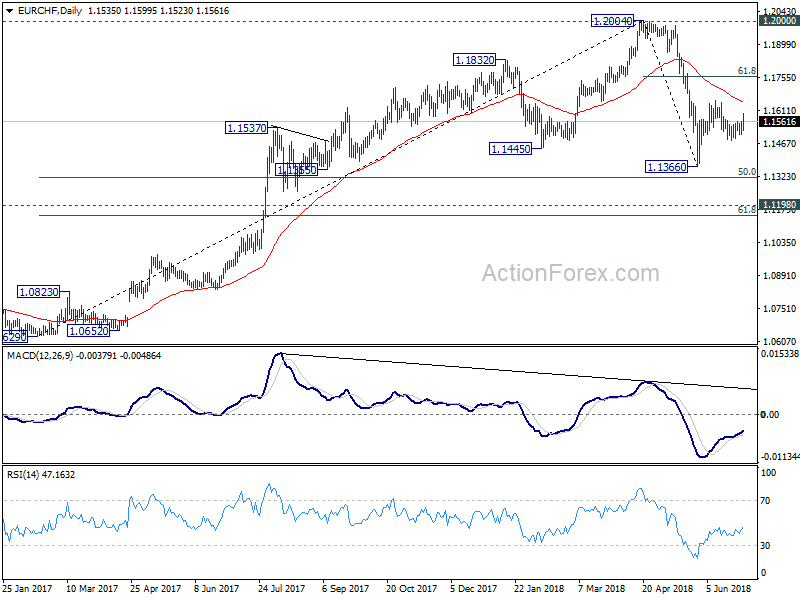
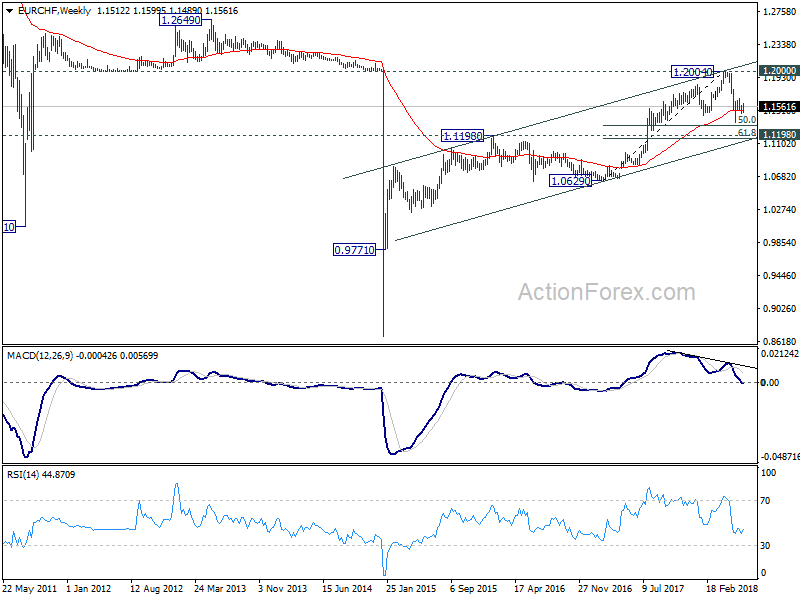
In the bigger picture, EUR/CHF was solidly rejected by prior SNB imposed floor at 1.2000. Considering bearish divergence condition in daily and weekly MACD, 1.2004 should be a medium term top. And price action from 1.2004 is correcting the up trend from 1.0629. Such correction is expected to extend for a while and therefore, we're not anticipating a break of 1.2004 in near term. Another decline cannot be ruled out yet. But in that case, strong support should be seen at 1.1198 (2016 high), 61.8% retracement of 1.0629 to 1.2004 at 1.1154 to contain downside.
Dollar Rally Halts after a Solid Quarter, Stays Bullish on Trade Tensions
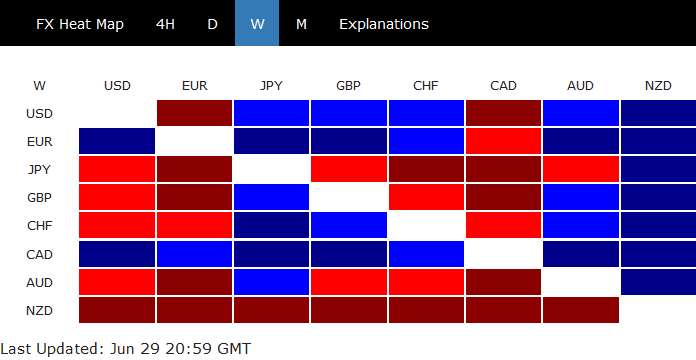
Canadian Dollar ended last week as the strongest one. Strength in oil price, with WTI hitting four-year high was a factor. Solid Canadian GDP and Business Outlook Survey also support a July BoC hike. Euro followed as the second strongest as markets cheered EU agreement on migration during the summit. That could be seen as temporarily easing German Chancellor Angela Merkel's domestic political pressure too. Despite some late setback, Dollar was the third strongest. It's more likely the the Greenback is taking a breath after a strong quarter, than reversing. On the other hand, New Zealand Dollar ended as the weakest one after dovish RBNZ suggested that it stands pat longer. Yen ignored risk aversion and ended as the second weakest, followed by Australia Dollar.
Dollar index to have more consolidations first before heading to 97.82
For now, despite all the uncertainties around trade wars, markets' pricing on Fed rate path is largely unchanged. And Fed is on course for having two more hikes this year. Dollar's near term fate will mostly depends on how monetary policies in other countries are playing out. ECB has unveiled their cards already. That is, QE is set to end this year, with rate staying at current level until summer 2019. However, whether BoC would hike in July and BoE would do too in August are both uncertain.
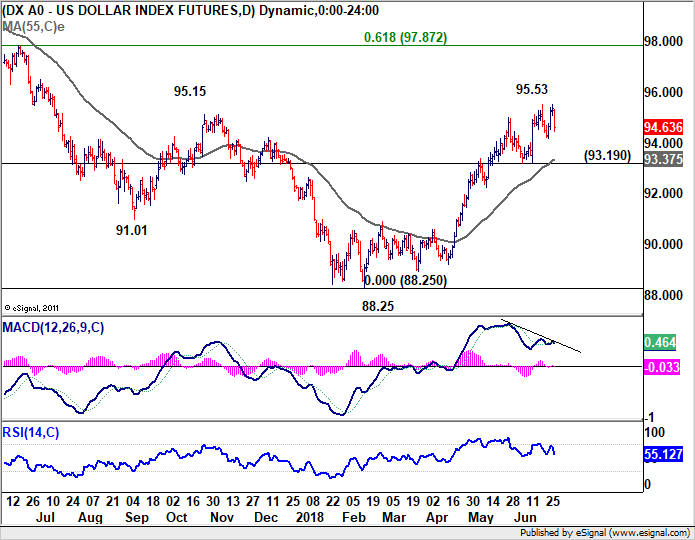
Trade tensions so far seem to be Dollar supportive, or at least, not Dollar negative. Dollar index hit a low at 88.25 back in February and the trend reversed since then. During the period, Trump announced the section 232 steel and aluminum tariffs on everyone. Temporary exemption for Canada, Mexico and the EU ended on June 1. Trump raised the stakes against these closet allies by threatening auto tariffs. In between there was section 301 intellectual property tariffs on China, which prompted equal scaled retaliation to be effective on July 6. Trump also raised the stakes by threatening tariffs on additional USD 100B of Chinese products. Dollar index has been in an up trend along these developments. Based on such correlation, as we're expecting Trump to isolate the US further from the rest of the world further, Dollar is in favor to head higher.
Technically, Dollar index tried to break through 95.15 resistance last week on another attempt. But it failed to sustain above that level again. Upside momentum is seen diminishing in daily MACD, suggesting DXY has topped out in near term at 95.53. We'd likely see some more consolidation first. But downside should be contained by 93.19 support. Rise from 88.25 is expected to resume at a later stage to 61.8% retracement of 103.82 to 88.25 at 97.82.
DOW to stay bearish as Trump expedites car probe and auto tariffs
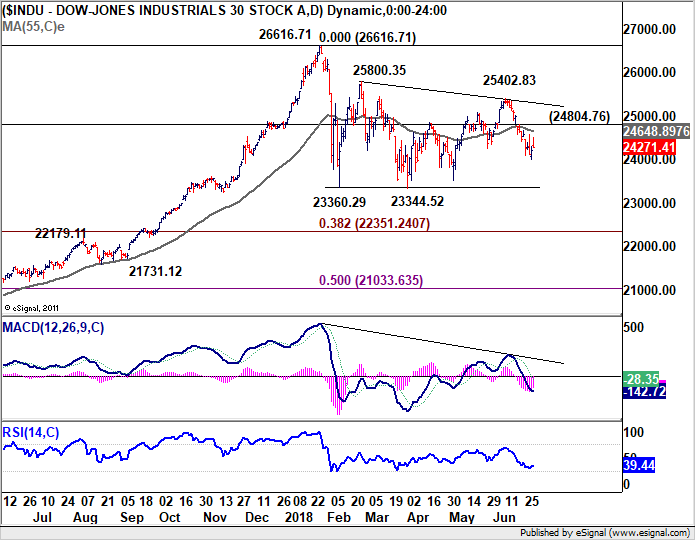
DOW's price actions on Friday revealed some underlying weakness in traders' sentiments. It hit as high as 24509 but pared back nearly all gains to close at 24271.41, just up 0.23%. Escalation in trade tensions between US and its closest allies and trade partners is deeply worrying for businesses. Two auto groups blasted Trump's using national security threat as a excuse to impost car tariffs. General Motor also submitted its comments to the Commerce Department regarding the negative impacts on auto tariffs. GM warned that "increased import tariffs could lead to a smaller GM, a reduced presence at home and risk less -- not more -- U.S. jobs".
But Trump is not going to listen to his fellow Americans anyway. When asked about the Section 232 national security probe on auto industry, Trump said it would be concluded "very soon" and "it'll be done in three, four weeks. It should be noted that the timeline is unusually fast. Similar probe that led to steel and aluminum tariffs took 10 months to complete. The Commerce Department, by law, has 270 days to offer recommendation. And the President has 90 days to act. But of course, to made a decision based on studies, or to do a study to support a decision, things could be done at vastly different pace.
We maintain our view that the choppy rise from 23344.52 has completed at 25402.83 already. As long as 24805.76 resistance holds, we'd expect further decline to retest 2334.52 next. Such decline could be the third leg of the corrective pattern from 26616.71. In that case, it could reach 38.2% retracement of 15450.56 to 26616.71 at 22351.24 before bottoming.
NASDAQ tumbled as CFIUS is neither harder or softer way to curb foreign investment
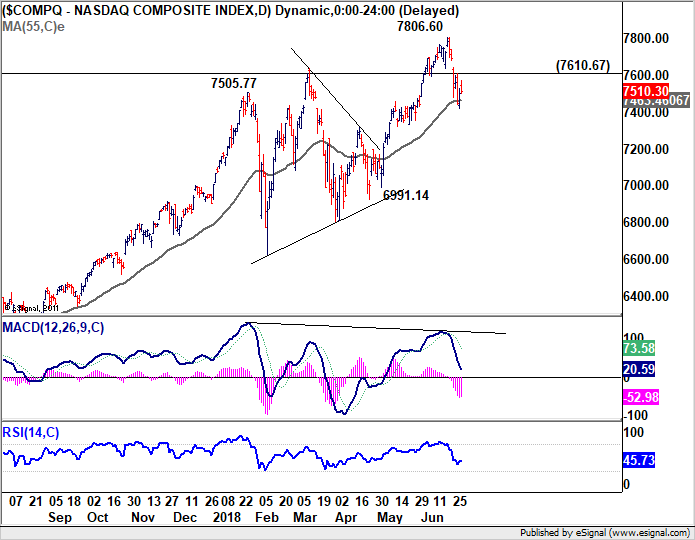
NASDAQ suffered steep loss last week on worries that the US is moving close to curb foreign investment in technology companies. Messages from Trump's administrations were initially confusing and conflicting. But in the end, a "softer" way was chosen on "protecting" US technologies from other countries. A upgraded version of the so called Committee on Foreign Investment in the United States (CFIUS) would be used. Still, as White House economic advisor Larry Kudlow said, the modernized CFIUS is "not meant to be harder or softer." And, it will not only restrict investments in US tech companies by China, but everyone else.
Friday's price action in NASDAQ shows clear weakness in underlying sentiments. It reached as high as 7573.59 but reversed almost all gains to close just up 0.09% at 7510.30. The downside acceleration from 7806.60 suggests that it's a medium term correction. This is supported by bearish divergence condition in daily MACD too. Near term outlook stays bearish as long as 7160.67 resistance holds. Sustained trading below 55 day EMA will pave the way to 6991.14 support, in proximity to 7000 psychological level.
Canadian Dollar strong but beware of a dovish BoC hike on July 11
Given that BoC rate decision on July 11 is less just two weeks away, Governor Stephen Poloz's speech last week was highly anticipated. The messages were mixed as there were something for both hawks and doves. In our view, Poloz was very clear that economic models support a July hike. This was further affirmed by the surprised growth in April GDP. BoC's quarterly Business Outlook Survey indicator, rose to the highest level since 2011, even after US steel and aluminum tariffs. and threat of auto tariffs.
However, Poloz also pointed out there are things that are not incorporated in the models. Most notably, impact of rising trade tension with it's closest neighbor and ally is something that's hard to measure. These factors will "figure prominently" in the upcoming BoC deliberations. So, even if BoC does deliver a hike, it could well be a dovish hike that comes with signal of pausing.
WTI crude oil in strong rally, but to be capped by 80 handle
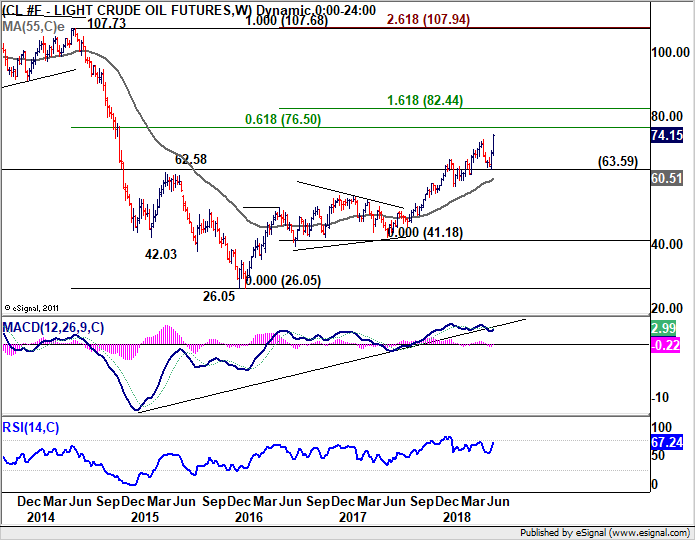
To our surprise, the strength in WTI crude oil was stronger than expected. That's partly due to the huge decline in US oil inventory. And of course, the momentum was already there as OPEC+ decision on production raise a week ago was much smaller than expected. 72.83 resistance was taken out last week with relative ease. Now, the medium term up trend from 2016 low at 26.05 has resumed and further rise would be seen to 61.8% retracement of 107.68 to 26.05 at 76.50, and possibly above.
But so far, we've got an impression that 80 is a level where OPEC member generally don't want to touch. Therefore, we'll likely see WTI starting to feel heavy as it approaches 161.8% projection of 26.05 to 51.67 from 41.18 at 82.44. But for the near term, oil price would provide some support to Canadian Dollar.
RBA may follow dovish RBNZ as China outlook worsens
RBA rate decision ahead is an event that's worth a watch. Australian Dollar was the second weakest one in June on a couple of factors. RBA's own confusing communications was one of the factors. In the May meeting minutes released on June 19, RBA omitted the language saying that it is "more likely that the next move in the cash rate would be up, rather than down". But in between, the meeting and the minutes, Governor Lowe said that it "is likely that the next move in interest rates will be up, not down". So, what is RBA trying to tell? Lowe ought to make use of this week's statement to clear the picture.
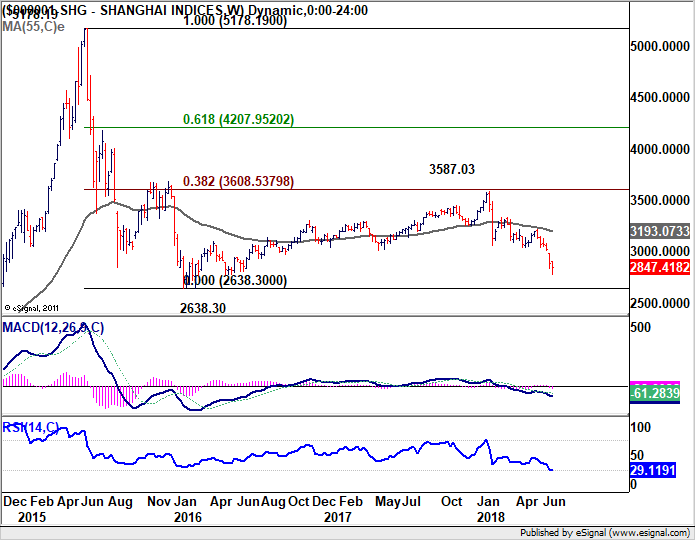
At the same time, the more dovish than expected RBNZ statement also prompted some speculations that RBA could follow suit. It should be noted that in the background, there is tremendously high risks of escalation in trade tension between the US and China. Based on its close ties with both countries, Australia will inevitably be affected. The worsening of the situation is clearly reflected in the Chinese stock markets as the Shanghai SSE extended recent decline to close at 2847.41 last week, down from prior week's close at 2889.76.
The selloff only slowed after China's central bank PBoC injected RMB 700B in liquidity to the markets by lowering the reserve requirement ratio. The central bank also signaled later in the week that it's shifting its policies to measured deleveraging to "maintain adequate liquidity" in the markets. These moves suggest that the government is not going to intervene in the markets directly at this level. And they could well let the index fall through 2016 low at 2638.3. The outlook of Chinese economy will be important food for thoughts for RBA board.
EUR/USD Weekly Outlook
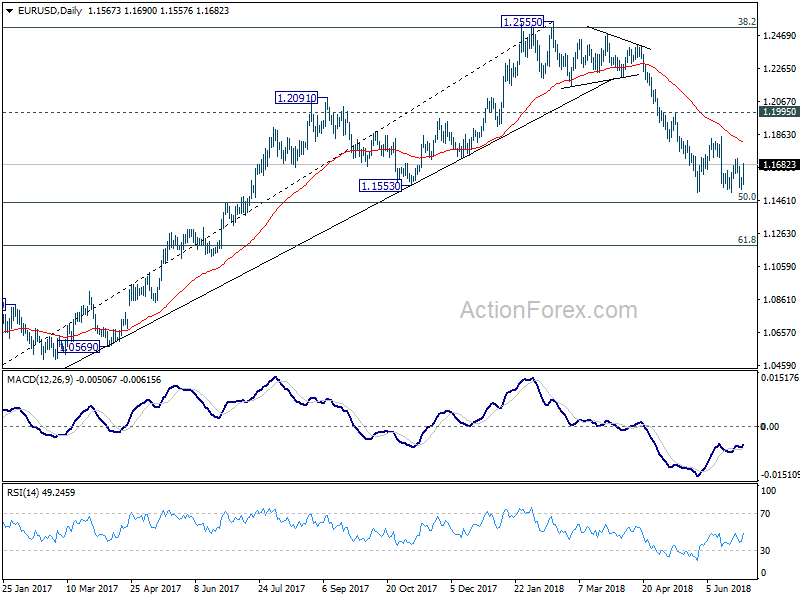
EUR/USD stayed in consolidation last week and outlook is unchanged. Initial bias remains neutral this week first. Stronger recovery cannot be ruled out. But upside should be limited by 1.1851 resistance to bring fall resumption. Decline from 1.2555 is still in progress. Firm break of 1.1507 will send EUR/USD through 50% retracement of 1.0339 to 1.2555 at 1.1447 to 61.8% retracement at 1.1186.
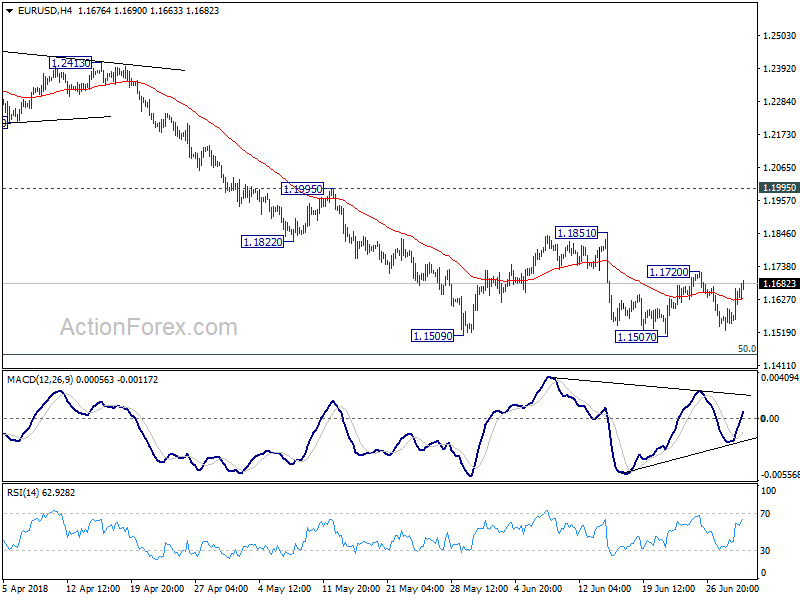
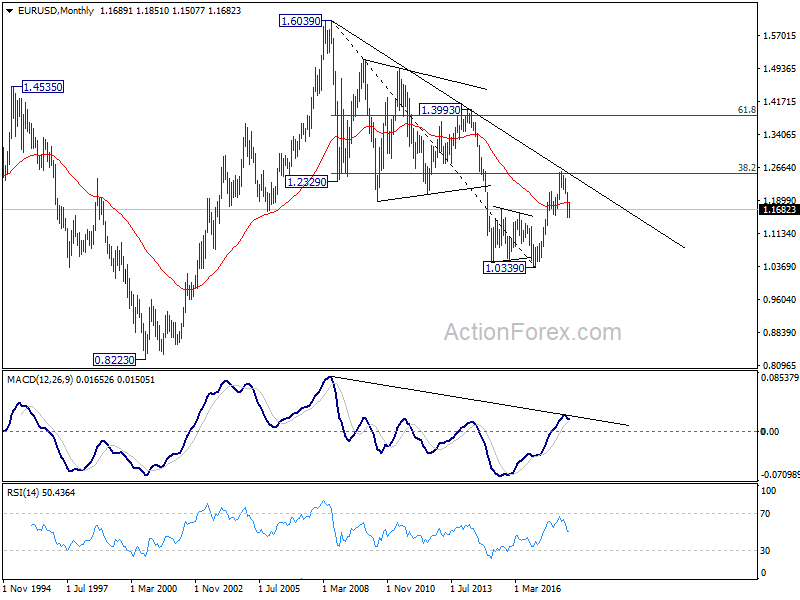
In the bigger picture, EUR/USD was rejected by 38.2% retracement of 1.6039 (2008 high) to 1.0339 (2017 low) at 1.2516. And, a medium term top was formed at 1.2555 already. Decline from there should extend further to 61.8% retracement of 1.0339 to 1.2555 at 1.1186 and below. For now, even in case of rebound, we won't consider the fall from 1.2555 as finished as long as 1.1995 resistance holds.
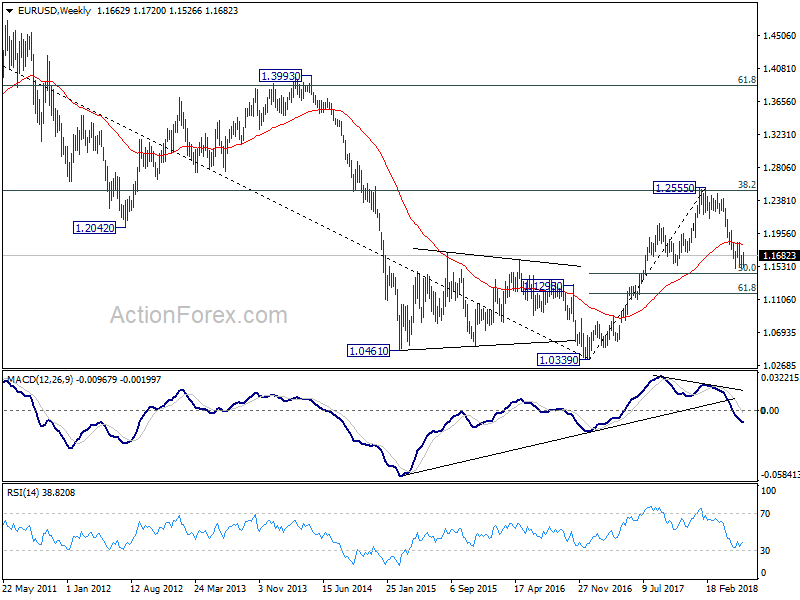
In the long term picture, the rejection from 38.2% retracement of 1.6039 to 1.0339 at 1.2516 argues that long term down trend from 1.6039 (2008 high) might not be over yet. EUR/USD is also held below decade long trend line resistance. Focus will now turn to 1.1553 support. Sustained break there would raise the chance of retesting 1.0339 low. It's early to tell, but the chance of long term bullish reversal is fading.
Summary 7/2 – 7/3
Monday, Jul 2, 2018
[php_everywhere instance="1"]
Tuesday, Jul 3, 2018
[php_everywhere instance="2"]
Wednesday, Jul 4, 2018
[php_everywhere instance="3"]
Thursday, Jul 5, 2018
[php_everywhere instance="4"]
Friday, Jul 6, 2018
[php_everywhere instance="5"]
Weekly Economic and Financial Commentary: GDP Growth Revised Lower But Poised for Rebound
U.S. Review
GDP Growth Revised Lower But Poised for Rebound
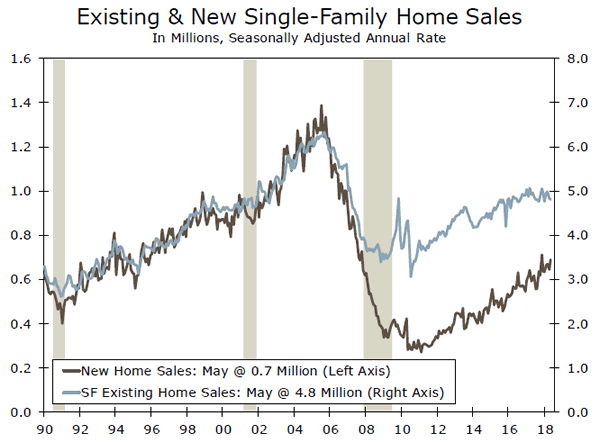
- New home sales jumped 6.7 percent in May, though April was revised lower. Tight inventories continue to push up prices and limit home sales. The S&P CoreLogic Case-Shiller National Home Price Index increased 0.3 percent in April.
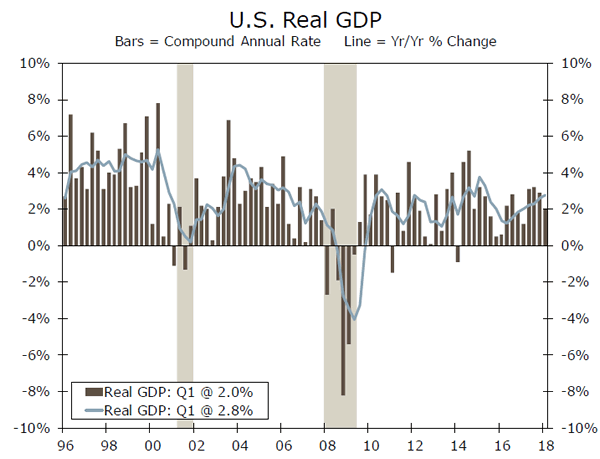
- First-quarter gross domestic product (GDP) growth was revised down to 2.0 percent, from 2.2 percent prior. However, we expect GDP growth in Q2 to rebound to 4.5 percent.
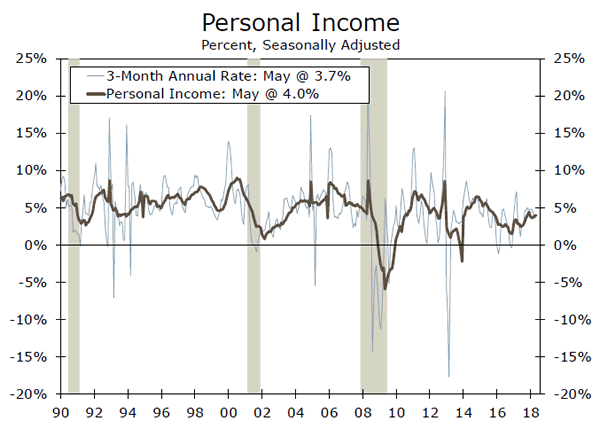
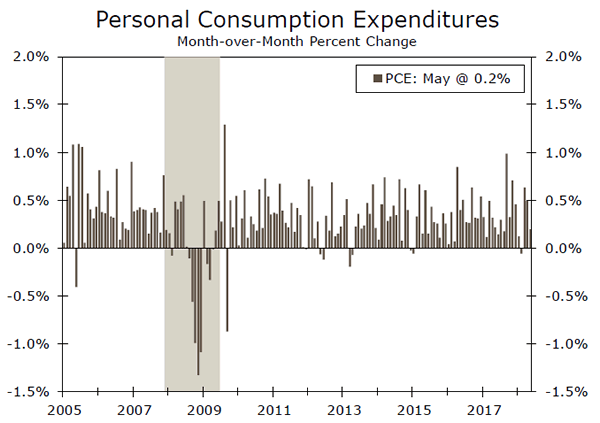
- Personal income growth rose 0.4 percent in May, up from 0.3 percent in April. Spending growth was weaker than expected, at 0.2 percent, and April's gain was revised down.
GDP Growth Revised Lower But Poised for Rebound
New home sales jumped 6.7 percent in May, to a 689,000-unit pace. However, April sales were revised lower and now reflect a 3.7 percent drop. Sales in the South were up 17.9 percent in May, to a new cycle high, and accounted for all of the national increase. More than half of new home sales occur in the South, so fluctuations in this region have a large impact on the total.
We have repeatedly written about lack of inventories restricting sales in the markets for new and existing homes. This remains true, but new home construction looks to be picking up, especially in the South where land is more readily available for development. Building activity looks to be back on track in the region after disruptions from hurricanes Harvey and Irma.
The current mismatch between supply and demand of housing has contributed to strong price gains. The S&P CoreLogic Case-Shiller National Home Price Index increased 0.3 percent in April, a 6.4 percent gain year-over-year. Price increases are widespread, with 17 markets in the 20-city index showing higher prices in April. Average prices for new homes fell in May, but this reflected compositional changes—more entry-level sales and more sales in the South (where homes are less expensive)—rather than underlying weakening.
Consumer confidence dropped 2.4 points in June to 126.4, but remains at a high level. The largest portion of the dip in confidence came from consumer expectations, which were likely dampened by ongoing trade disputes and higher gasoline prices. Nevertheless, more than twice as many consumers expect business conditions to improve over the next six months than expect them to worsen. Optimism about the labor market eased somewhat, but remained consistent with continued gains in nonfarm payrolls. We expect some slowing in job growth as open positions become harder to fill in a tighter labor market, but for the upward trajectory in nonfarm payrolls to remain intact.
First-quarter GDP growth was revised down to 2.0 percent in the third estimate, from 2.2 percent prior. The revision is due to slower consumer spending growth and smaller inventory accumulation than the government had previously estimated. This means first-quarter GDP growth was much softer than the previous three quarters, which averaged 3.1 percent. However, Q1 GDP has come in weaker in the last several years, suggesting that seasonal factors are partly to blame. We expect a strong rebound in the second quarter, to 4.5 percent annualized growth. The magnitude of this quarterly gain is influenced by low base effects from Q1, but we expect robust growth to continue through 2018. A strong labor market and tax cuts should remain supportive of GDP.
Personal income grew 0.4 percent in May, up from 0.2 percent the month prior. Personal spending slowed to 0.2 percent growth, and April's gain was revised down 0.1 percentage point to 0.5 percent. Given solid income and employment growth and continued strength in consumer confidence, we expect consumption to pick back up. Even with some slowing, consumption should be much more supportive of GDP growth in Q2 versus Q1.
U.S. Outlook
ISM Manufacturing • Monday
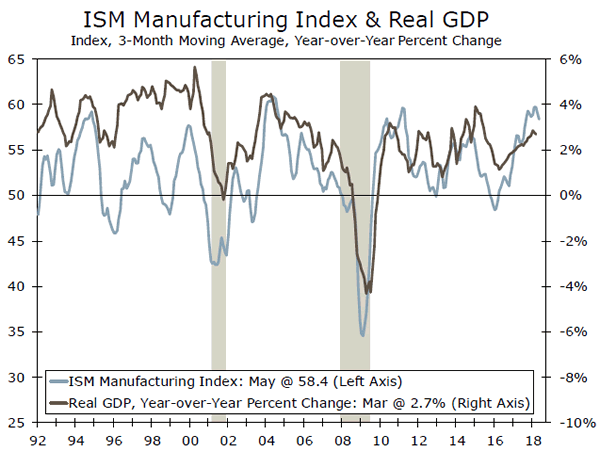
The manufacturing sector continued to report higher levels of activity in May. The ISM headline print of 58.7 beat expectations, with most of the subcomponents moving further into expansion territory. The new orders component increased 2.5 points to 63.7. Meanwhile, new export orders fell 2.1 points and imports declined 3.7 points, in possible signs of a dimming trade outlook. The prices paid measure also rose to a seven-year high of 79.5.
While the ISM in May exceeded consensus estimates, there continues to be a divergence between the "soft" survey data and the "hard" data such as output and new orders. In prior periods, consistent readings of 55 or higher from the ISM would indicate stronger GDP growth and robust manufacturing activity. However, the ISM has been running well ahead of the growth in new orders, raising questions about when the survey responses of increased activity will be corroborated in the hard data.
Previous: 58.7 Wells Fargo: 58.3 Consensus: 58.3
Trade Balance • Friday
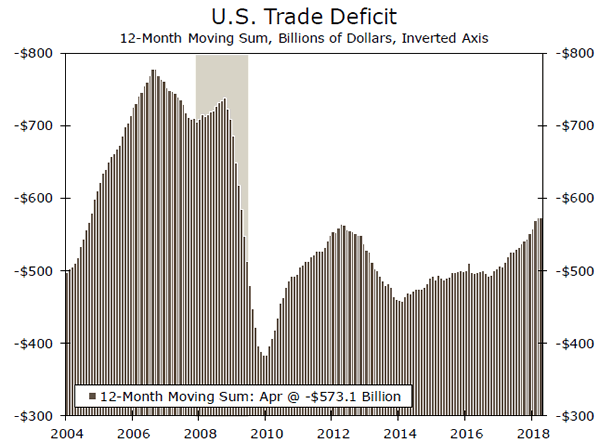
The trade deficit narrowed for the second consecutive month in April, as exports increased 0.3 percent while imports declined 0.2 percent. Imports of both iron and steel mill products and bauxite and aluminum products have increased year-to-date in April compared to last year. However, April's report is not yet capturing the broader extension of steel and aluminum tariffs on Europe and NAFTA trading partners, which go into effect in June.
It remains unclear the extent to which tariffs will impact current trade dynamics; however, there has been a noticeable softening in both the import and export components of the ISM survey data over the past three months, a possible warning of a slowdown in trade. However, given the shrinking deficit in both March and April, trade is currently poised to have a substantial positive impact on GDP growth in the second quarter.
Previous: -$46.2B Wells Fargo: -$43.9B Consensus: -$43.8B
Employment • Friday
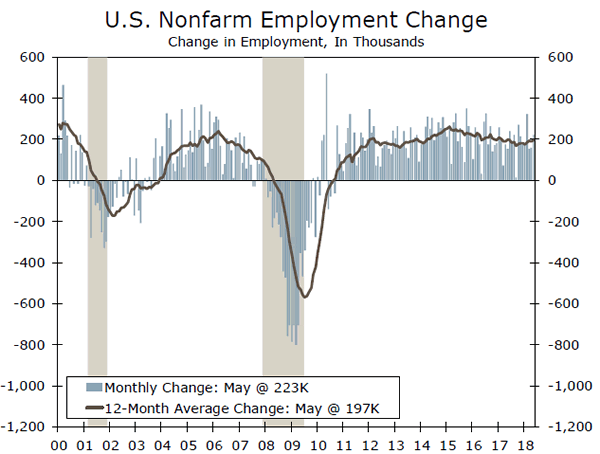
The labor market improved across the board in May. Employers beat expectations and added 223,000 new jobs. Payroll growth also continued to broaden as the net share of industries adding jobs improved to 67.6 in May. Strong hiring over the past few months also helped push the unemployment rate down to 3.8 percent, matching the low of the 1991-2001 cycle. Average hourly earnings also increased 0.3 percent in May, improving to 2.7 percent year-to-year rate.
Rising compensation costs should help resolve some of the structural challenges facing the labor force by enticing more workers off the sidelines. Prime-age participation ticked down for the third consecutive month in May. While there has been improvement in recent years, participation among this cohort remains below prerecession levels and a full recovery remains some ways off.
Previous: 223K Wells Fargo: 185K Consensus: 198K
Global Review
Chinese Currency Comes Under Downward Pressure
- The Chinese renminbi has depreciated in recent weeks due to concerns about a potential trade war and steps by the Chinese central bank to provide more liquidity in the banking system. Our currency strategists look for the renminbi to eventually regain its footing against the dollar, but they acknowledge that it could weaken further if trade tensions continue to escalate.
- In Japan, economic data for May suggest that real GDP, which contracted mildly in the first quarter for the first time in more than two years, grew at a modest pace in Q2.
- Data released this week suggest that growth in Canada should be solid in Q2.
Chinese Currency Comes Under Downward Pressure
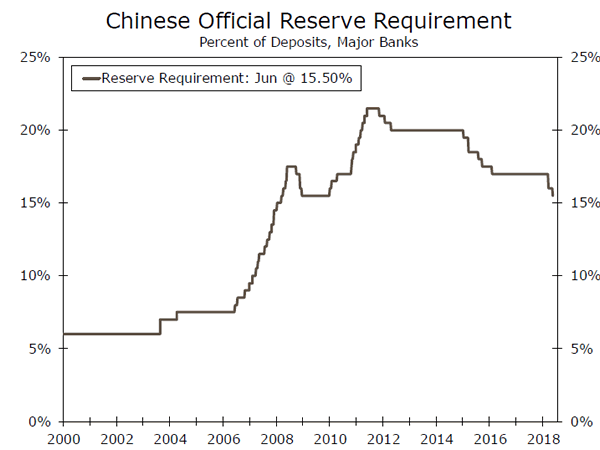
The Chinese central bank announced early this week that it was cutting the required reserve ratio (RRR) for major banks from 16.00 percent to 15.50 percent (see graph on front page). Interbank lending rates had been creeping higher, and the cut in the RRR will provide the Chinese banking system with more liquidity. The easing of monetary policy comes amid recent data that suggest some deceleration is underway again in the Chinese economy. Not only were growth rates in retail sales and industrial production in May not as robust as most analysts had expected, but investment spending is currently growing at its slowest rate in at least 20 years. We continue to look for the rate of economic growth in China to slow further, although we think that the probability of an outright contraction in the Chinese economy is low.
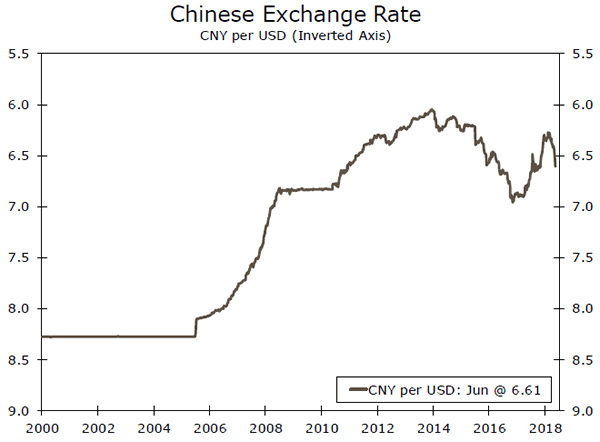
The easing of monetary policy in China also contributed to a marked decline in the value of the Chinese renminbi, which was already sliding vis-à-vis the U.S. dollar due to mounting concerns about a potential trade war between the United States and China (top graph). Indeed, the renminbi has slipped more than 3 percent against the greenback in the past two weeks, which is a rather sizeable move for the usually stable Chinese currency. Although our currency strategists look for the renminbi to eventually regain its footing against the dollar, they acknowledge that the Chinese currency could weaken further if trade tensions escalate more.
Japan Economy Probably Rebounded in Q2
Real GDP growth in Japan, the world's third-largest individual economy, turned negative in Q1-2018 for the first time in more than two years. However, data for May that were released this week indicate that GDP growth probably turned positive again in the second quarter. Although industrial production (IP) edged down 0.2 percent in May relative to the previous month, that modest contraction followed three consecutive months of strong gains that left IP in the April-May period 2.0 percent above Q1. The consensus forecast estimates that real GDP grew at an annualized rate of roughly 2 percent in Q2, which would more than reverse the 0.6 percent contraction that occurred in Q1.
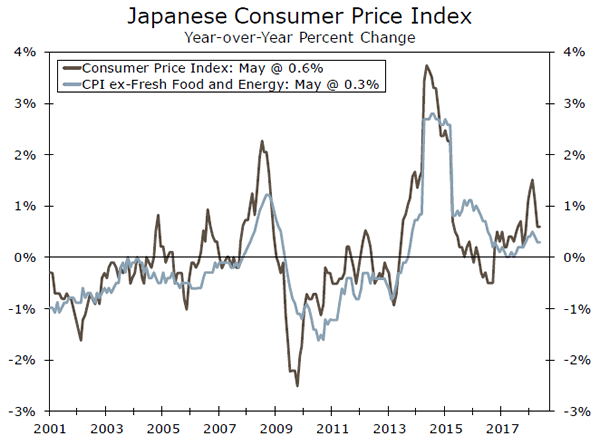
The problem in Japan has been, and continues to be, the abnormally low rate of CPI inflation (middle chart). In that regard, there was a bit of good news this week as CPI inflation in Tokyo, which has a high degree of correlation with the nationwide inflation rate, rose from 0.4 percent in May to 0.6 percent in June. That said, until inflation rises to 2 percent on a sustainable basis, which likely will not happen anytime soon, the Bank of Japan will refrain from removing monetary accommodation.
Canadian Economy Has Solid Momentum
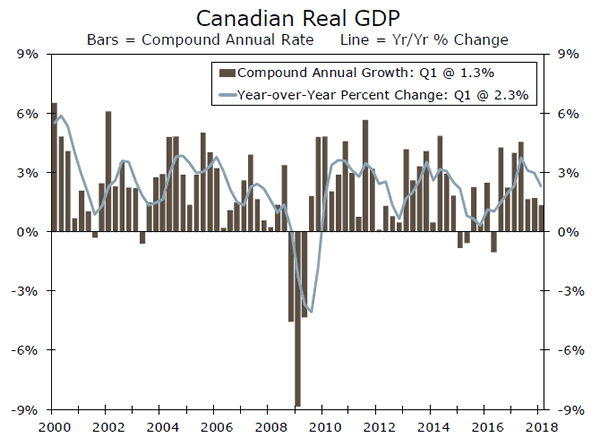
Real GDP growth in Canada has downshifted on a sequential basis in recent quarters (bottom chart). However, the 0.1 percent rise in real GDP in April, which comes on the heels of the 0.3 percent increase posted in March, means that the Canadian economy started off Q2 with a fair degree of momentum. The consensus forecast of 2.5 percent growth in Q2 looks reasonable to us.
Global Outlook
U.K. Manufacturing PMI • Monday
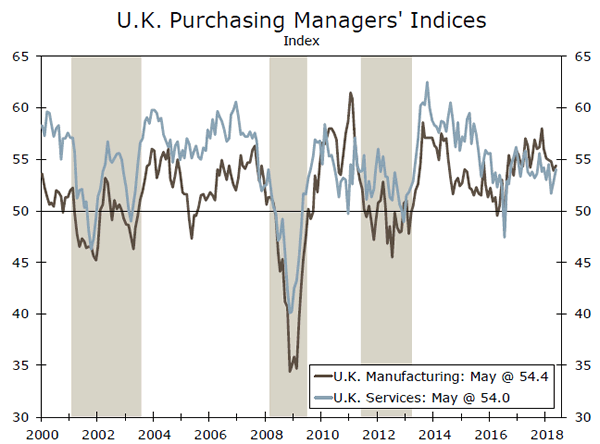
After a strong second half of 2017, the manufacturing sector in the United Kingdom cooled in Q1. The Purchasing Managers' Index (PMI) for manufacturing has fallen to 54.4 from a high of 58.0 in November 2017, and factory sector output rose just 0.2 percent in Q1. The industrial production data for April suggest the weakness carried into Q2. Manufacturing output fell 1.4 percent in April, and construction output declined an even steeper 3.3 percent amid a streak of declines that has stretched to five months.
The May PMI for the manufacturing sector rose 0.5 points to 54.4, halting another streak of five straight monthly declines. Some stabilization in the June PMI, which is released Monday, would be an encouraging sign that a rebound in factory sector activity is in the offing. Given the sluggish pace of growth in the United Kingdom in Q1, a turnaround in manufacturing and Q2 output for the overall economy is key for a potential Bank of England rate hike in August.
Previous: 54.4 Consensus: 54.0
Reserve Bank of Australia • Tuesday
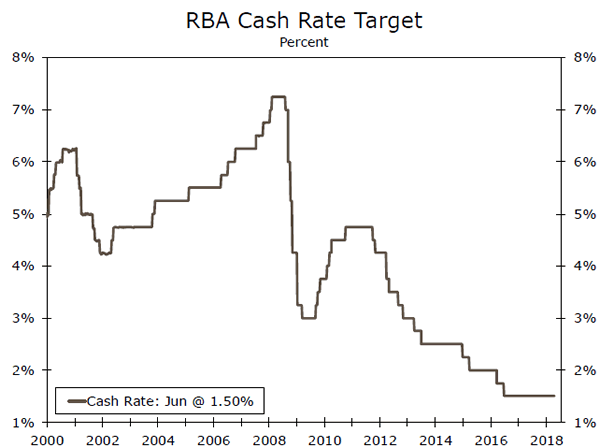
Economic growth in Australia was robust in Q1, rising at a 4.2 percent annualized rate. The strong print was driven by external demand, however, as exports accounted for roughly half of the quarter's increase in output. Domestic demand was more tepid, as consumer spending grew at a scant 1.4 percent annualized pace and business investment was not much stronger at 2.1 percent.
For policymakers at the Reserve Bank of Australia (RBA), stubbornly low wage growth and housing market/household leverage concerns have prevented the central bank from joining other developed economy central banks that have tightened policy. While we eventually expect the RBA to join in policy normalization, we believe that policymakers will continue to delay tightening until gradual progress in inflation and the labor market translates into higher wages. This would help households deleverage and offset some of the debt servicing costs associated with rising interest rates.
Previous: 1.50% Consensus: 1.50% (Cash Rate Target)
Canada Employment• Friday
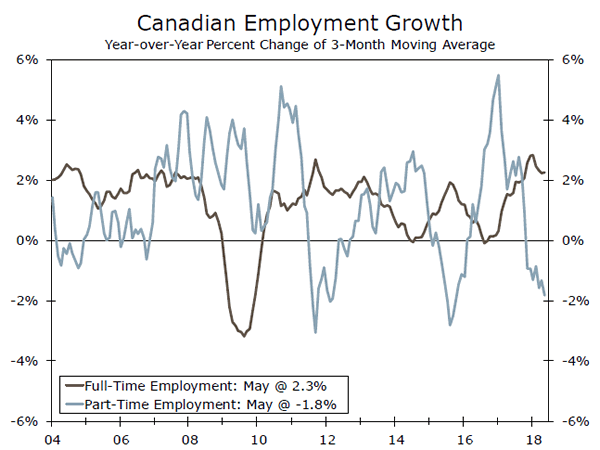
Job growth in Canada has been soft through the first half of the year. Total employment is down almost 50,000 from December 2017. The aggregate numbers mask a split between full-time and part-time employment, however, as full-time employment is up about 76,000 jobs while part-time job growth is firmly in negative territory.
Against this backdrop, wage growth in Canada has skyrocketed, reaching its highest year-over-year pace since 2009. Minimum wage increases in some parts of the country have likely played a role in the gains, but a tightening labor market has also driven "solid labor income growth" as the Bank of Canada noted in its last meeting statement. With inflation on target and the labor market generally giving policymakers a green light, we continue to expect two more rate hikes this year from the Bank of Canada. Sustaining the recent momentum in wage growth will be key, as household leverage concerns are a key risk to the Canadian economy.
Previous: -7,500 Consensus: 20,000
Point of View
Interest Rate Watch
Fed Chairman Powell Pursues Neutral—Yet No Inverted Yield Curve
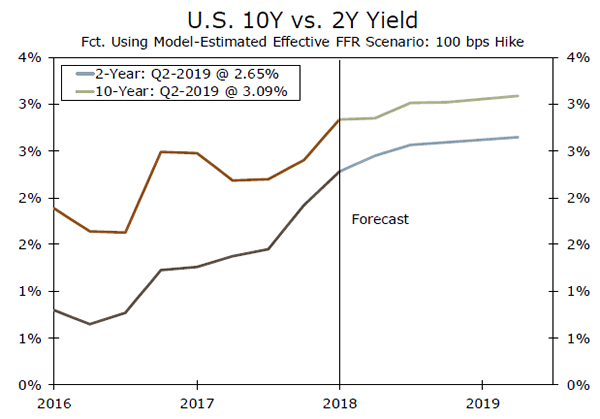
We have estimated the impact on Treasury rates if the Fed pursues an additional 100 bps of tightening through mid-2019 (top chart). We use the effective fed funds rate, as it is more in line with market interest rates. Under this baseline scenario, the two-year rate rises from 2.45 percent to 2.65 percent in Q2-2019. This is consistent with the history that the two-year moves up with the funds rate, but not one-for-one bps. Meanwhile, the 10-year rate rises from 2.85 percent to 3.09 percent.
These results are lower than our published forecast due to the baseline model not accounting for the specific timing and magnitude of rate hikes, which we are able to adjust for in our final forecast. Historically-lower inflation inputs in the baseline model is another factor that results in the baseline output being lower than our published forecast, even with a faster projected pace of tightening. However, the baseline analysis still does not indicate an inverted yield curve even with an additional 100 bps of Fed hikes.
ECB: No Change in Rates Ahead
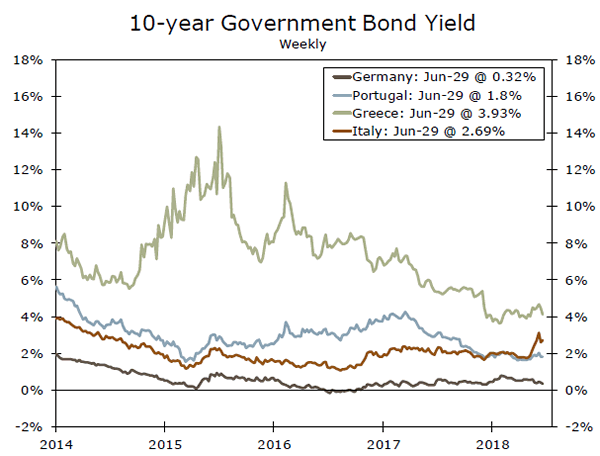
Recently, the ECB announced the end of its bond purchase program but also pledged that interest rates would remain unchanged for the period ahead into mid-2019. As illustrated in the middle graph, benchmark European yields have remained fairly low since early 2015 with some minor hiccups for Portugal and Italy and more significant issues for Greece. Without ECB bond buying, 10-year yields are expected to move upward in our outlook even as short-term rates remain unchanged, and generate a steeper yield curve in the year ahead.
TIPS and Inflation Expectations
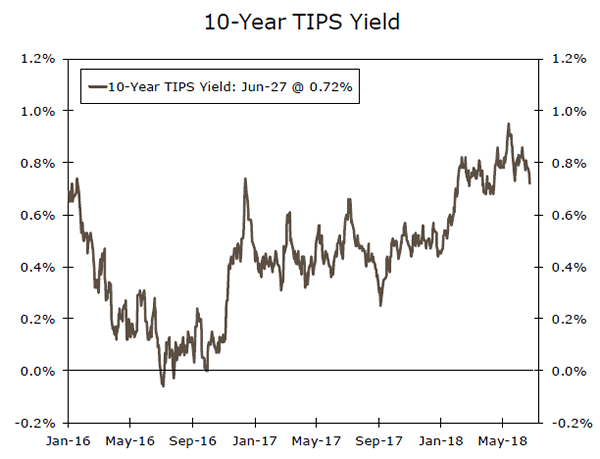
Inflation expectations can be roughly gauged by comparing Treasury yields to TIPS yields (bottom graph). There has been a distinct upward shift in TIPS yields over the past year that is consistent with a rise for inflation-protected yields within the context of higher nominal rates going forward. This would be consistent with our expectation that both real growth and inflation measures drift upward in the year ahead.
Credit Market Insights
Easing Standards, Seeking Growth
Tepid growth in commercial and industrial (C&I) loans has been a frustration for banks, and now appears to be a key concern for regulators. Demand for C&I loans slowed considerably in 2016 as activity in the energy and industrial sectors cooled. Despite the increased levels of business optimism that began in early 2017, we have not seen a convincing rebound in loan growth. In response to firmer business conditions, many banks have eased their terms and standards on C&I loans. This easing may have helped spur loan growth more recently–in March and April–but it has also caught the eye of regulators.
In its spring risk report, the Office of the Currency Comptroller (OCC) highlighted the relaxing of standards as a top risk to the industry. The number of outstanding matters requiring attention (MRAs), which are citations handed out by the OCC, increased 24 percent since the first quarter of 2017. The MRAs specifically related to a bank making exceptions to its typical lending procedure increased 45 percent over the same period.
The most recent look at the sector, the Fed's June 22 H.8 report on the balance sheet of commercial banks, showed C&I loan growth slowing to a 0.3 percent annualized pace in May. This may be welcomed by regulators, if it is a reflection of more careful lending habits; however, it still could present concern going forward. If the movement away from C&I loans is not a passing trend, but rather a structural shift to other forms of credit, banks may continue to face incentives to relax standards.
Topic of the Week
Gas Prices Up Just As Households Hit the Roads
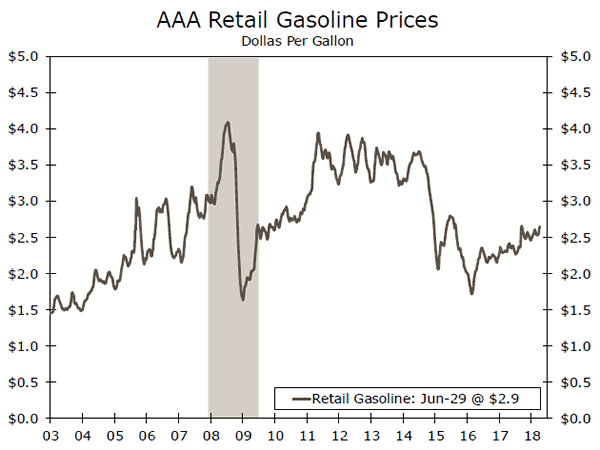
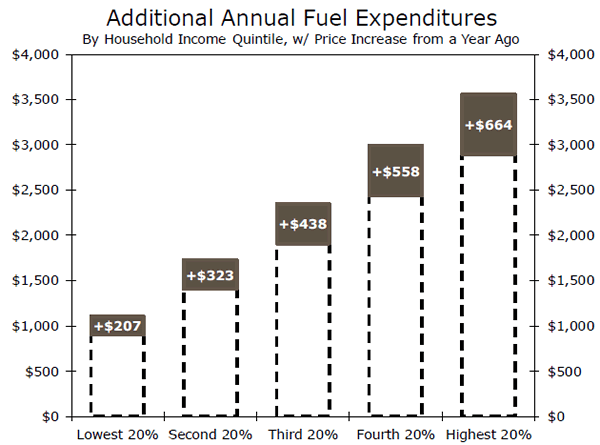
Retail gas prices are up more than 20 percent over the past year (top chart). The EIA forecasts that average gas prices this summer will run the highest of the past four summers. This means more pain for household budgets as families embark on summer road trips. Gasoline currently makes up about 4 percent of the consumption basket, according to the Consumer Price Index. Holding usage from the 2016-2017 Consumer Expenditure Survey constant, the rise in gas prices over the past year means that the average household would pay about $440 more for fuel on an annualized basis.
Households are bringing in more income, which should alleviate some budgetary pressure. After-tax personal income was up 4.1 percent year-over-year in May, in part due to tax reform. The Joint Committee on Taxation estimates that tax cuts will add up to $700 in the first year of effect for households earning annual incomes of $50,000-$75,000 (the middle of the distribution). Based on historical usage, higher gas prices–if sustained at current levels—would eat up about two-thirds of the savings from tax reform for the typical household (bottom chart). This still leaves households with some breathing room. Job and wage gains should also continue to push up household incomes.
More fuel-efficient cars and the increased popularity of alternative fuels mean that households are using less gasoline than in years past, and they may further reduce consumption due to higher prices. Therefore, price changes are likely making a proportionally smaller dent in household budgets (and our estimate of additional annual household fuel expenditures, based on historical data, is likely a bit high). We also expect gas prices to ease somewhat in the second half of the year as Brent oil prices pull back to around $72 per barrel in Q4, from an average of $77 this week. Overall, strong job and income growth and somewhat lower gas prices to end 2018 should position households to weather the recent rise in gasoline prices.
The Weekly Bottom Line: Canada – Clear As A Cloudy Day
U.S. Highlights
- The BEA's third estimate of Q1 real GDP downgraded growth slightly to 2.0%, from 2.2% previously. May data did show flat real personal spending, but strength in March and April still set Q2 consumption up for a decent rebound.
- The Fed's preferred measure of inflation, core PCE, hit its 2% target in May. This supports our forecast for continued gradual monetary policy tightening, as the focus shifts to containing upside risks.
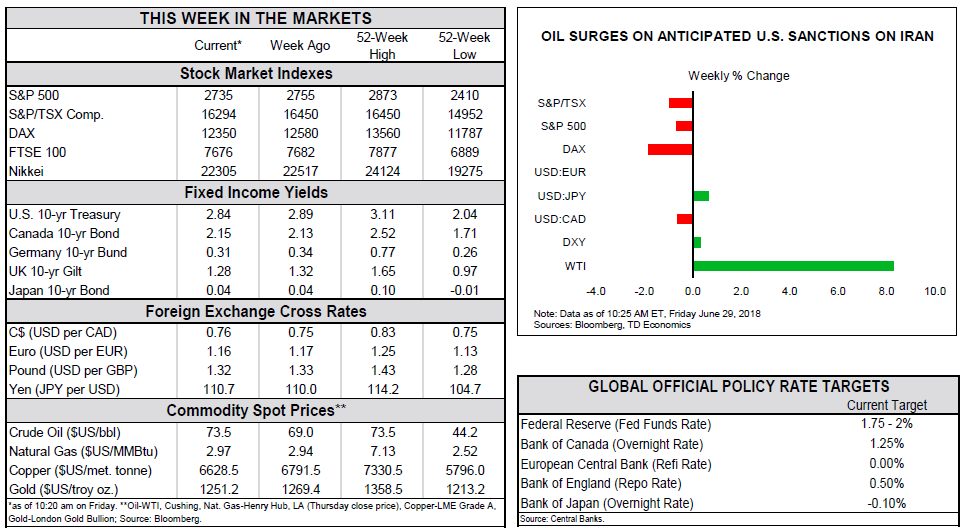
- Shifting headlines on trade were a key driver of stock market activity. Foreign policy also got in on the action, with crude prices surging on the anticipation of tougher U.S. sanctions on Iran.
Canadian Highlights
- The Canadian economy, beset by headwinds, still managed to grow in April with real GDP rising 0.1%.
- Canadian firm sentiment also remained solid, according to the Bank of Canada's Business Outlook Survey.
- The Bank of Canada is focusing on clarity, but the economic data and trade risks are anything but. The Bank's July 11th rate decision looks to be a hike, but the path thereafter is anything but clear.
U.S. - BULLSEYE!
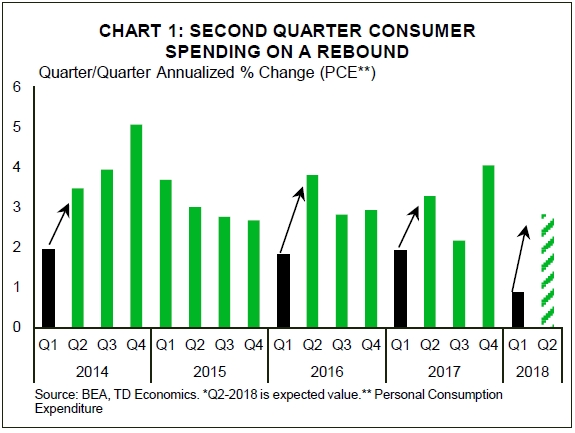
The U.S. economy slowed more than previously believed in the first quarter of 2018, with growth coming in at 2% ann. according to the BEA's third estimate, down 0.2 percentage points from the second estimate. The downward revision was largely due to weaker consumer spending, while softer inventory investment also played a part. New data out this morning on personal income and outlays reinforce the notion that the soft start to the year was temporary. Supported by a healthy 0.4% m/m gain in nominal personal incomes, nominal spending rose a respectable 0.2% in May. But given inflation, consumption was flat in real terms. Strength in March and April still set Q2 consumer spending – currently tracking just shy of 3%, slightly below our forecast (Chart 1) – up for a rebound. We continue to expect the economy to grow by some 4% in Q2 given widespread strength in other components.
Consumer spending should continue to follow a decent 2.5% growth path in the second half of 2018, bolstered by a tight labor market and tax cuts, which will continue to support incomes. The latter will feature favorably for housing demand, even as interest rates rise. But a lack of inventory will constrict the sales pace. On this front, pending home sales – a solid gauge of near-term activity – retreated in May, marking the second consecutive monthly decline and weakening a previously improving trend.
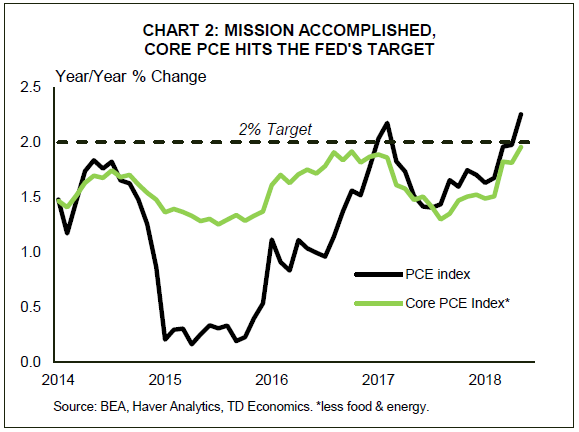
Perhaps the most striking element from this morning's report was inflation data. The headline PCE index ticked higher to 2.3% y/y, while core PCE (the Fed's preferred measure of inflation) hit the bullseye of 2% for the first time in six years (Chart 2). These developments support our view for the Fed to continue raising rates gradually, with two more hikes expected for 2018. The focus now shifts from below-target-inflation to containing the upside risks.
With little else in the way of primary data, shifting headlines on trade remained an important driver of stock market activity. Markets opened lower on Monday after indications that the U.S. planned new curbs on Chinese investment in U.S. tech firms. Foreign policy also got in on the action, with crude prices surging on the anticipation of tougher U.S. sanctions on Iran. The rollercoaster ride in equities continued, with the President seemingly taking a softer stance on Chinese tech investment, but then hinting at the possibility of protectionist action on autos.
Ultimately, trade spats with a number of important trading partners risks siphoning away much of the economic boost from fiscal stimulus by way of higher consumer prices, reduced exports, supply chain disruptions, and by denting consumer and business confidence. Under the presumption that the tougher trade rhetoric is simply a negotiating tactic, there is still hope that common sense will prevail, and tensions will de-escalate. The risk, however, is that once the wheels have been set in motion, tensions can quickly escalate to a full-out trade war. China, Mexico and the EU have already retaliated to some degree, while Canada is announcing a detailed list of U.S. products to be slapped with retaliatory tariffs at the time of writing, which will take effect over the weekend. The U.S. may up the ante, further reinforcing the negative feedback loop.
Canada - Clear As A Cloudy Day
Summer vacation is here, but for those of us trying to parse out the next move from the Bank of Canada, the rest and relaxation will have to wait. A July rate hike has been long expected, but a turn south in (some) economic data and a worsening in the trade relationship with the U.S. has led to doubts about its likelihood.
This week, Governor Poloz gave a speech entitled "Let Me be Clear," outlining the Bank's communication strategy. The focus on communication comes at a time when the Canadian economy faces a heightened level of uncertainty. As clear as the Bank of Canada tries to be, its crystal ball is more cloudy than usual at the moment. The governor's response is to move away from "forward guidance" and toward data dependence. So, what does the economic data say about the case for a rate hike?
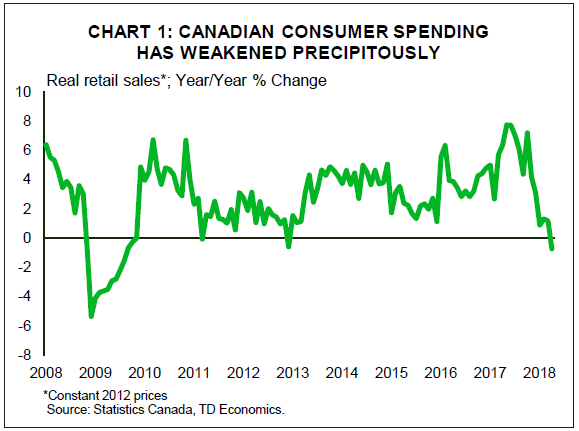
First, we must recognize the negatives. Consumer spending appears to have weakened fairly dramatically over the past few months. While some of this softness may reflect unseasonable weather, the deceleration is marked (Chart 1). The slowdown is echoed in credit growth, not just for mortgages, but also credit cards and other consumer credit lending. Inflation also disappointed in May, corroborating the seeming loss in momentum.
At the same time that domestic demand is showing softness, export growth has, with the exception of April, been disappointing. The weakness on the export front has come even without the imposition of tariffs on steel and aluminum and counter-tariffs on U.S. goods. In his speech, Poloz noted that the trade dispute will "figure prominently" in the Bank's next decision and is likely to lead to a modest downgrade in the Bank's economic outlook.
On the other hand, several developments have been positive, especially relative to the Bank's previous forecast in April. Oil prices have moved higher and are about US$10 a barrel above the Bank of Canada's earlier expectations. Higher oil prices may not have the benefit they had in the past given pipeline constraints and trade uncertainty, but they are still, on balance, positive.
Similarly, the housing market, has shown signs of stabilization. Some markets such as Montreal and Ottawa have even shown decent positive momentum. In the job market, wage growth has accelerated and jobs have tilted toward full-time. Finally, the boost to U.S. growth from fiscal stimulus is playing out as expected, with growth in domestic demand in the second quarter coming in ahead of expectations.
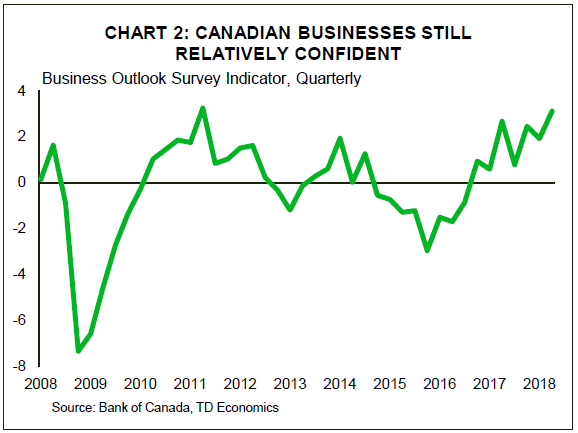
Despite Governor Poloz's focus on clarity, the Bank's next decision is anything but. On balance, the economic data, while softening, have not moved materially off the Bank's previous projections. Indeed, after today's April GDP report, which eked out a modest 0.1% gain, we anticipate the second quarter to come in around 2.4%, roughly in line with the Bank's 2.5% projection. With the business outlook survey suggesting a good degree of confidence among Canadian firms (Chart 2), we expect it to be sufficient for the Bank to lift its key lending rate in July. Still, given a more cautious outlook and ongoing threat of escalating trade wars, we suspect it will be some time before we see another hike.
U.S.: Upcoming Key Economic Releases
U.S. Employment - June
- Release Date: July 6, 2018
- Previous: 223k, unemployment rate: 3.8%
- TD Forecast: 180k, unemployment rate: 3.8%
- Consensus: 200k, unemployment rate: 3.8%
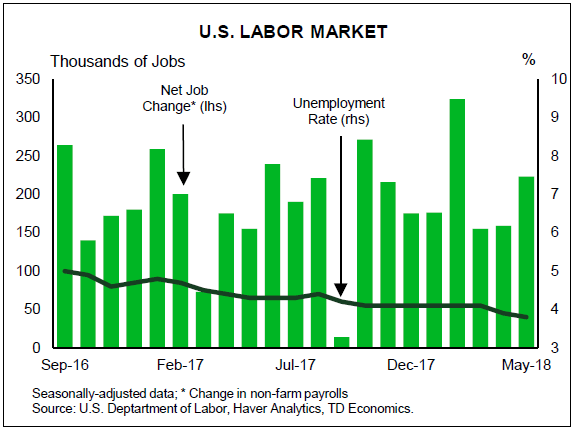
We lean toward a modest pullback in June nonfarm payroll gains of 180k vs 223k in May. This is mainly on account of a moderation in private services in line with the past retreat in the ISM non-manufacturing jobs index. On the goods side, we expect solid performance consistent with the robust trend across regional factory surveys and a higher oil rig count.
We expect an unchanged unemployment rate of 3.8%, with risks skewed to the upside on a rebound in labor force participation. We look for average hourly earnings to rise 0.3% m/m, leading the y/y pace to 2.8% y/y. Risks are to the upside for the m/m print, but we can't rule out downward revisions which temper any upside to the y/y pace.
Canada: Upcoming Key Economic Releases
Canadian International Trade - May
- Release Date: July 6, 2018
- Previous: -$1.90bn
- TD Forecast: -$2.60bn
- Consensus: N/A
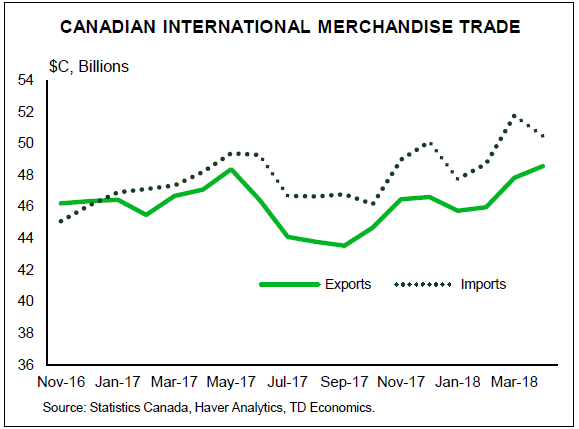
TD looks for the international trade deficit to widen to $2.6bn in May on a rebound in import activity. Exports should see little change as weakness in the non-energy component offsets stronger energy exports. Metals should benefit from some frontloading of steel/aluminum exports ahead of tariffs on June 1st but we see limited upside after a large increase in the previous month. Energy exports will provide the main source of strength amid a surge in crude oil prices while advance US trade data implies soft autos. Looking ahead, CAD depreciation should provide a sizeable tailwind to exports over the coming months though steel/aluminum tariffs will start to weigh on exports and imports in June and July, respectively.
Canadian Employment - June
- Release Date: July 6, 2018
- Previous: -7.5k, unemployment rate: 5.8%
- TD Forecast: 10k, unemployment rate: 5.8%
- Consensus: N/A
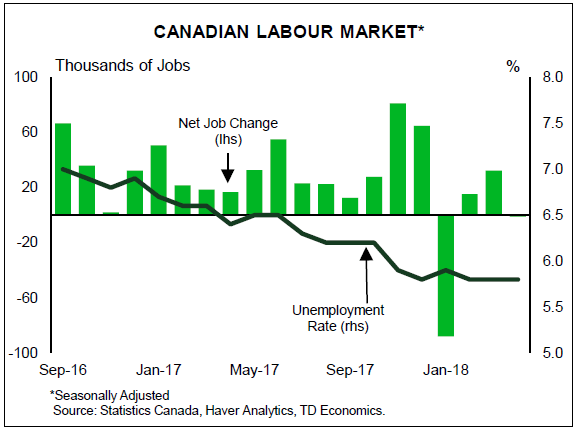
TD expects job growth to rebound to 10k in June, which would be sufficient to recover the 7.5k jobs lost in May while extending the relatively soft pace that has persisted since January. Job growth should be led by full time positions, which would add a modestly upbeat tone to the report, while part time employment should underperform after a 20k gain in May. Wage growth should remain unchanged at 3.9% y/y for permanent employees with risks tilted to the upside on the minimum wage hike in BC. However, the magnitude of the hike ($11.35 to $12.65) and relative size of the labour market imply a lesser impact on the national average than similar policies in Alberta and Ontario. Meanwhile, the unemployment rate should hold at 5.8% for the fifth consecutive month absent a rebound in labour force participation.
Bank of Canada Business Outlook Survey: Canadian Firms Paint a Cautiously Positive Outlook
Canadian firms were generally upbeat over the second quarter of the year, according to the Bank of Canada's quarterly Business Outlook Survey (BOS). The Bank's "BOS Indicator", a statistical summary of the overall results of the survey, rose to 3.1 (from 1.9 previously), its highest level since 2011.
Of note, the survey was conducted between May 3rd and June 5th, a period which includes the announcement of both U.S. steel and aluminum tariffs and the commerce department investigation into U.S. auto imports, but before the heated rhetoric around the G7 summit conclusion.
The details of the report showed a few interesting divergences. The balance of opinion around future sales fell a tick, to 6% (from 16% previously), with some firms reporting capacity constraints impacting sales prospects. In contrast, 'indicators of future sales', which captures order books, advanced bookings, and similar metrics, rose for a second quarter to hit 49% - the fifth highest reading on record.
Investment intentions fell back for a second quarter, but remained positive with a balance of opinion of 17%. The associated commentary noted that fewer firms are planning to increase investment in machinery and equipment, but intentions were still described as 'buoyant'. This may be a reflection of the structure of the survey, which asks for intentions relative to the prior 12 months. The solid performance of M+E over this time is a high bar to match. The interesting divergence here is that these intentions are not higher given that the share of firms reporting some or significant difficulty meeting demand is near a record high at 57%.
These challenges extend to hiring. Hiring intentions rose for a third straight quarter, with firms reporting labour shortages as a limit to hiring. Indeed, both the share of firms that reported labour shortages, and the intensity of those shortages remained elevated.
With all of these pressures at play, expectations around price growth also rose on both the input and output sides. Notably, the share of firms expecting inflation in the 2% to 3% range or above 3% rose again, with nearly 2/3 of firms falling into this category.
Senior Loan Officer Survey
The Senior Loan Officer Survey (SLOS), also released this morning, indicated an easing of lending conditions for both businesses and households. On the business side, both price and non-price conditions eased in the second quarter, but only for corporate borrowers due to increased competition from banks and capital markets. Lending conditions for small businesses and commercial borrowers remained unchanged, while their demand for credit picked up.
For households, easier lending conditions were driven by mortgage lending. Price conditions have eased substantially, as a reduced pool of eligible borrowers owing to B-20 rules and higher mortgage rates increased competition among lenders. Non-price conditions were unchanged. Demand for non-mortgage loans remained unchanged, and some easing of price conditions occurred for auto loans. Lending conditions were unchanged for other types of consumer loans.
Key Implications
Don't count Canadian firms out just yet. Beneath a few soft spots that can probably be put down to the structure of the survey, firm sentiment looks healthy heading into the second half of the year. Order books remain solid, and all labour market indicators were robust. To be sure, developments since the survey are likely to weigh on sentiment, and comparing reported capacity constraints against investment intentions suggests that even prior to recent developments, uncertainty was tempering the pace of spending. But, for the time being, firms continue to report a constructive operating environment.
On the lending side, it is no surprise that the impact of B-20 rules and higher mortgage rates are working their way through the housing market. Growth in residential mortgage credit continued to decelerate in April, falling to 4.9% y/y (from 6.4% a year ago), a trend that is likely to continue for a while. That said, housing market activity is likely to trough in the second quarter of the year, and recover gradually thereafter. The easing of credit conditions will help this process.
The solid BOS, together with a decent April GDP report, will leave the Bank of Canada confident that its growth narrative remains intact. We may have lost a bit of our conviction following Governor Poloz's remarks earlier this week, but given his emphasis on data dependency, we are confident in looking for a 25bp hike on July 11th. At the same time, data dependency and the significant uncertainty facing the economy mean that we are also comfortable in our expectation that July will likely mark the last rate hike for 2018.
Japanese Tankan Big Manufacturers Index to Lose Further Momentum in Q2
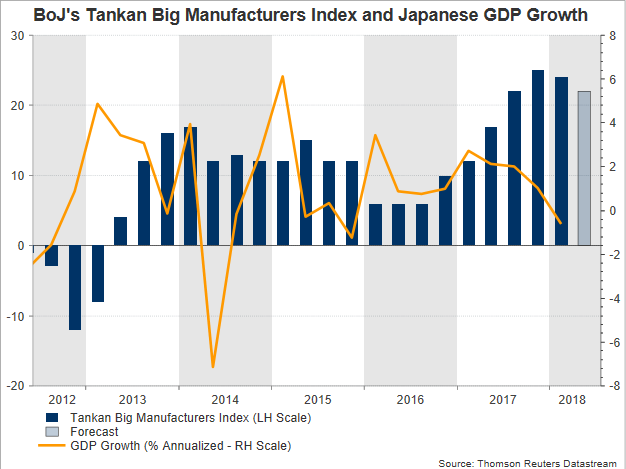
Early on Monday, Japan’s closely watched Tankan survey which tracks responses from more than 10,000 companies is expected to show that business conditions for large companies in the manufacturing sector have deteriorated in the second quarter of the year. While the safe-haven yen hardly reacts to data releases, investors will curiously take a glance at the numbers to see whether the US trade protectionism and higher oil prices have weighed on firms’ investment plans.
According to analysts, the Big Manufacturers Tankan index issued by the Bank of Japan (Sunday 2330 GMT) is forecasted to drop by 2 points to 22 in the second quarter, registering its second quarterly slowdown in a row but still standing among the highest levels recorded in a decade. Rising oil prices could have been behind the weakness given that crude prices have surged by 13% in the three months to June so far. Meanwhile, US tariffs on Japanese aluminum and steel imports (in force since June 1) and generally the growing trade dispute between the US and the rest of the world could have cut back investment plans in the sector. In recent evidence, industrial production readings out of Japan indicated on Thursday a smaller decline than forecasts suggested, with the output falling by 0.2% month-on-month in May instead of tumbling by 1.1%, led by shortfalls in transport equipment, steel and iron, and electrical machinery. In terms of shipments, losses were larger at 1.6% m/m, while inventories were up by 0.6% m/m. Yet, the yen’s 4.2% depreciation against the strengthening dollar, during the second quarter could have caped sharper downfalls in the export sector. Regarding the forward-looking business outlook, big manufacturers are anticipated to hold their prospects unchanged, leaving the Tankan Big Manufacturers Outlook index steady at 20.
Meanwhile, in the service sector, the Tankan index for large companies is forecasted to stand at 23, the same as in the first quarter, while the outlook measure is seen higher by 2 points at 22.
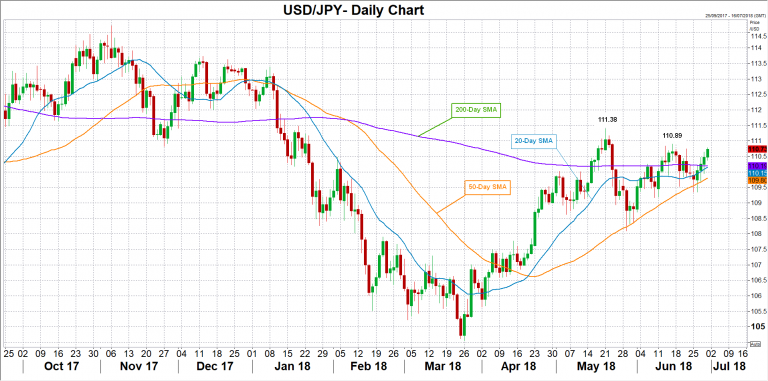
Turning to forex markets, the yen is not expected to react much to the data as usual, but a substantial improvement in the figures could prove the resilience of the Japanese business sector amid heightening trade risks and enhance optimism that economic growth could return to positive territory in the second quarter. In this case, dollar/yen could reverse lower to meet the 200-day and the 20-day (simple) moving average at 110.19. Under this level, the price could then try to break the 50-day MA at 109.80 which the bears were unable to pierce since early April.
Alternatively, a significant miss in the data could help the pair to touch the previous high of 110.89, while above from there, May’s 4-month peak of 111.38 could also attract attention.
Stock traders will be also eyeing the results, as any encouraging print could drive the blue-chip Japan 225 stock index (Nikkei 225) upwards.
Week Ahead – Resilient Dollar Looks at US Jobs Report for New Highs; UK PMIs and RBA in Focus...
The US jobs report for June will be the highlight of the coming week as the greenback remains unscathed from the rising trade tensions. Canada will also publish employment numbers, while PMI releases in the UK and the US will be watched too, along with the Bank of Japan’s quarterly Tankan survey. In the world of central banks, policy meetings by the Reserve Bank of Australia and Sweden’s Riksbank will be making the headlines.
Mixed outlook expected from BoJ Tankan survey
The week will start on Monday with the Bank of Japan’s Tankan report – a quarterly survey that gauges business sentiment across the Japanese economy. The survey is expected to reveal a mixed outlook for the second quarter, with sentiment worsening slightly in some sectors but improving in others. Among large businesses, the manufacturing index is forecast to drop slightly but the non-manufacturing index is expected to hold steady. For small businesses, both the manufacturing and non-manufacturing indices are forecast for a small drop. However, expectations for capital spending plans are set to improve, with large businesses likely to raise capex spending by 9.3% in the current fiscal year, from 2.3% in the prior survey, while small businesses are forecast to cut spending at a slower pace.
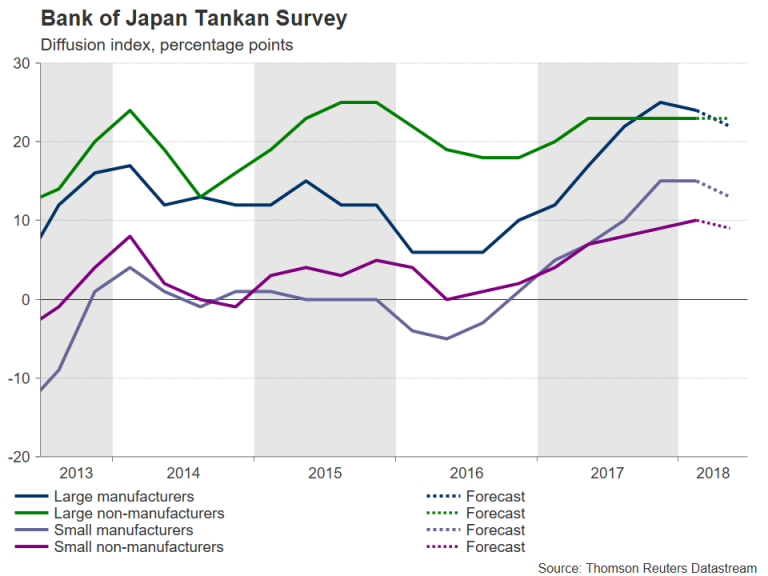
The yen could get a small lift should the Tankan report point to a strong second quarter. Other major data out of Japan will include household spending numbers for May on Friday.
RBA could follow RBNZ in dovish tilt
The RBA will announce its latest policy decision on Tuesday and is widely expected to hold rates at 1.50%, where they’ve been since August 2016. With a darkening cloud over trade policy hanging over the markets, the RBA may point to growing downside risks even if it maintains its growth outlook. However, even if policymakers don’t ring any alarm bells yet, the Australian dollar is unlikely to find a lot of support from a possible not-so-dovish RBA statement as only a reversal of the heightened risk aversion would be of much help to the aussie in the short term.
Economic data could also fail to move the aussie next week. May building approvals are due on Tuesday, and retail sales and the trade balance will follow on Wednesday (also for May). Aussie traders will additionally be watching the June manufacturing PMIs out of China. The official NBS manufacturing PMI is due on Saturday, with the private Caixin manufacturing PMI coming up on Monday. Worse than-expected readings could raise concerns that the Sino-US trade conflict has started to weigh on manufacturing activity.
Quiet week for the Eurozone; Riksbank meets
Eurozone data will take a backseat next week with some German releases likely to attract the most attention. Euro area indicators will include the bloc’s jobless rate on Monday, and producer prices and retail sales on Tuesday, all for May. The final Eurozone PMI readings for June are not expected to cause much excitement either on Wednesday as no revision is forecast to the preliminary prints. But German industrial orders on Thursday and industrial production on Friday could upset the euro bulls if they don’t show a rebound in May as expected, following large drops for both measures in April.
There could also be some volatility for the Swedish krona as the Riksbank announces it latest policy decision on Thursday. The Riksbank is expected to hold its repo rate unchanged at -0.5% and will probably stick to its forecast of a rate hike at the end of 2018. The Riksbank should feel more confident about proceeding with a rate rise after the European Central Bank announced its own plans for policy normalization earlier this month. However, any alteration to its rate path guidance by the Riksbank could catch traders by surprise, bringing further sharp moves to the krona, which this week touched 7-week lows versus the euro and more than one-year lows versus the US dollar.
Sterling looks to UK PMIs for support
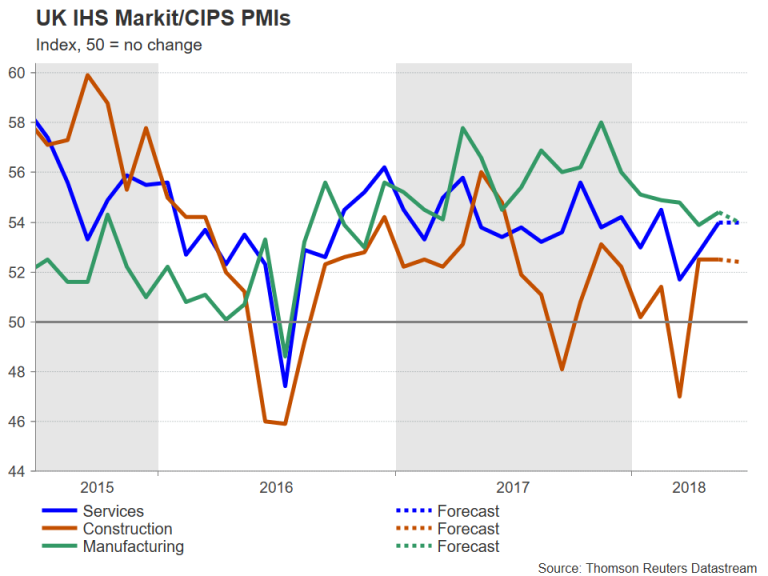
The pound slumped to a near 8-month low of $1.3048 this week as a possible dovish shift to the Bank of England’s MPC composition and mounting Brexit concerns dragged down the British currency. There was some relief for cable at the end of the week from an upward revision to first quarter UK GDP and comments from the EU’s chief Brexit negotiator that the two sides are making progress in the negotiations. However, next week’s PMI releases out of the UK may be unable to sustain the pound’s rebound. The manufacturing and construction PMIs, due on Monday and Tuesday respectively, are forecast to fall marginally in June, while on Wednesday, the services PMI is expected to remain unchanged at 54.0. On Thursday, a speech by BoE Governor Mark Carney might provide some clues as to the likelihood of an August rate hike.
US and Canadian jobs reports eyed
Employment numbers from the United States and Canada will be significant for both the US and Canadian dollars on Friday. Before then though, the ISM manufacturing and non-manufacturing PMIs out of the US will be closely monitored on Monday and Thursday, respectively. Both PMIs are forecast for a slight dip in June. Also important will be Tuesday’s factory orders for May, as well as the minutes of the Fed’s June 12-13 policy meeting on Thursday. With several FOMC members, including Chairman Powell, having spoken in public after the June meeting, the minutes are unlikely to bring new viewpoints to the market.
The focus at the end of the week will divert to the nonfarm payrolls report. The US economy is projected to have added 200k jobs in June, somewhat less than the prior 223k. The unemployment rate is forecast to stay unchanged at 3.8% in June. Average hourly earnings are expected to rise by another 0.3% month-on-month pace, with the annual rate inching up 0.1 percentage points to 2.8% in June, matching the January high. A bigger increase could once again stoke fears of an inflation overshoot, especially after the core PCE price index reached 2.0% in May.
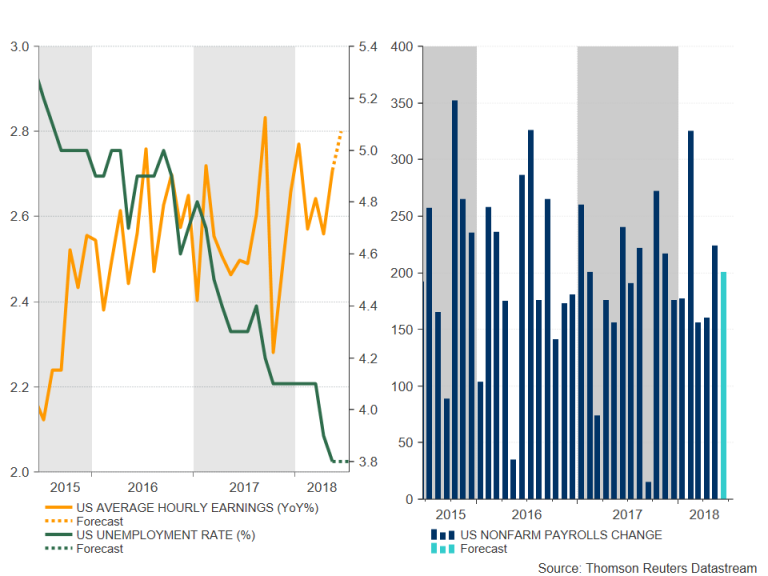
The greenback could extend this week’s strong gains if US wage growth shows signs of accelerating. The Canadian dollar also stands to benefit from a stronger-than-expected jobs report after the Bank of Canada’s governor, Stephen Poloz, revived expectations of a July rate hike this week. In addition to the employment data, Canada will see the release of the May trade balance and the June Ivey PMI on Friday.
Weekly Focus: Politics Driving Markets Again
Market Movers ahead
- In the US, the most important release will be the jobs report for June on Friday 6 July, but the week also brings FOMC meetings minutes.
- In the euro area, German politics will again take centre stage after ongoing squabbles within the governing coalition over migration policy.
- US-China trade tension might escalate further after tariffs take effect on 6 July.
- In Scandinavia, the Riksbank meeting will be the key event.
- Note that our Weekly Focus publication will take a summer break until 10 August.
Global macro and market themes
- Trump blinked but further escalation of the trade tensions is still our baseline scenario ahead of 6 July.
- Merkel and Europe are facing a pivotal weekend following the EU summit.
- Oil prices have surged to multi-year highs.
- Confidence indicators have moderated further recently.
EURCHF Trading Within Range, Looks Neutral Over Short-Term
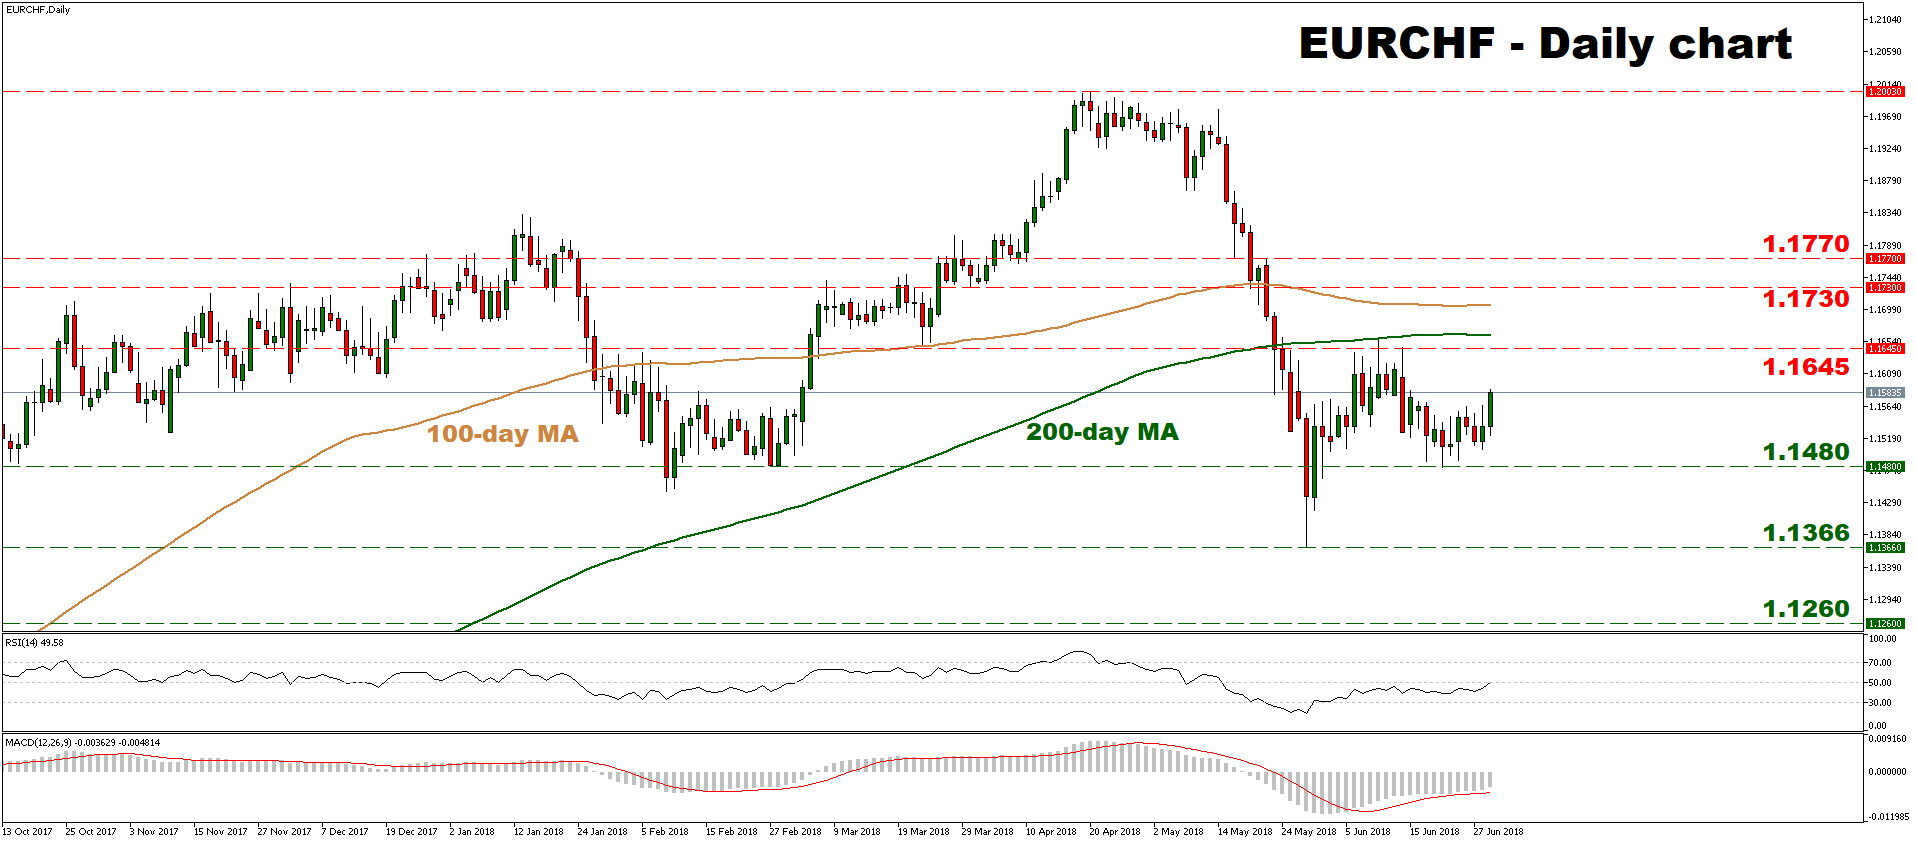
EURCHF touched a three-and-half year high of 1.2003 on April 20, before falling violently to post a ten-month low of 1.1366 on May 29. The pair recovered somewhat in the subsequent weeks and ever since May 31, it has been trading within a relatively tight sideways range, between 1.1480 and 1.1645.
Looking at momentum oscillators, the RSI – although marginally below its neutral 50 line – has rebounded and is pointing upwards, indicating that negative momentum is fading. Similarly, the MACD stands in negative territory, but rests above its red trigger line and is slowly edging upwards.
Combined, these suggest that the latest rebound may continue in the near-term, perhaps to challenge the upper bound of the aforementioned range, at 1.1645. That said, the area around 1.1645 capped several advances in June, and a clear closing candle above that level and the pair’s 200-day moving average – which rests not far above at 1.1663 – is needed for the near-term outlook to turn positive. In case of such an upside break, further advances could stall near the 1.1730 area, defined by the lows of May 18, before attention shifts to the May 17 trough of 1.1770.
On the downside, preliminary support to declines could come around the 1.1480 zone, identified by the June 21 lows, before focus turns to the pair’s multi-month low of 1.1366. A downside break would mark a lower low on the daily chart, turning the short-term outlook back to negative, and potentially opening the way for declines towards the 1.1260 zone, marked by the bottom of 18 August, 2017.
Overall, while both the short and medium-term pictures appear neutral at the moment, a continuation of the current rebound cannot be ruled out in the short run.