Sample Category Title
USD/JPY Develops 3 Different Chart Patterns
The USD/JPY is in a highly corrective consolidation zone. Price action is now offering multiple price patterns that could offer interesting ways of analysing the charts.
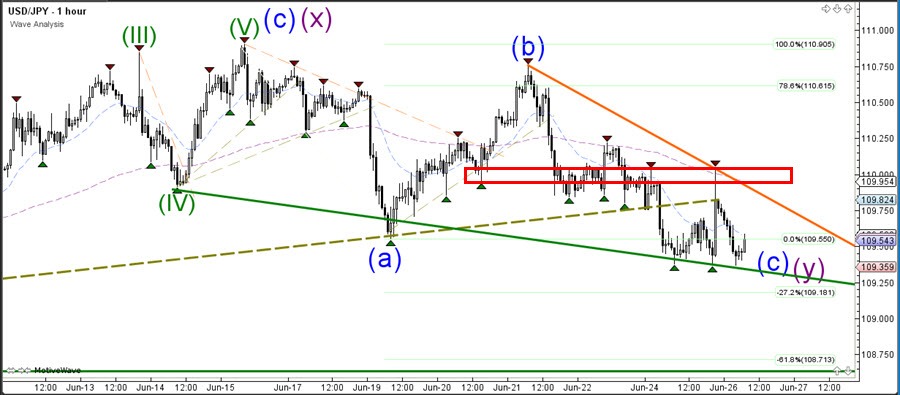
The USD/JPY seems to be building a triangle pattern (red/blue lines) and a falling wedge chart pattern (orange/green lines) at the same time. A bearish breakout could see a continuation towards the previous support zone (horizontal green) and a potential inverted H&S pattern.
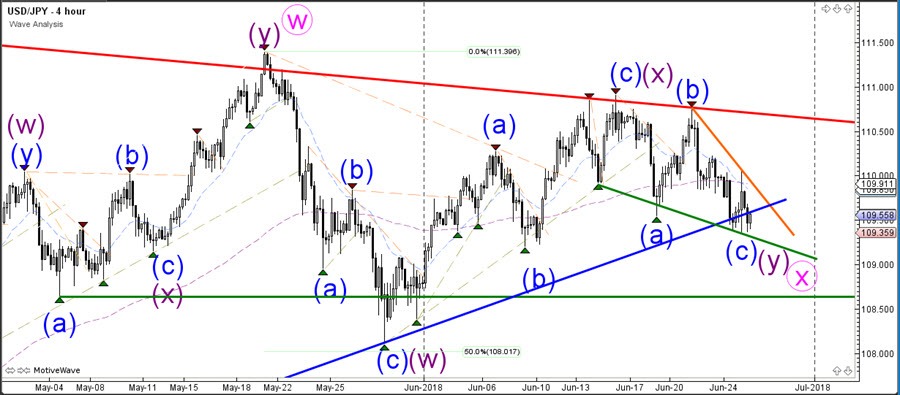
The USD/JPY remains choppy and needs to break support or resistance before a larger price movement could be expected. A bullish break above 110 or a bearish break below 109 could see the start of momentum.
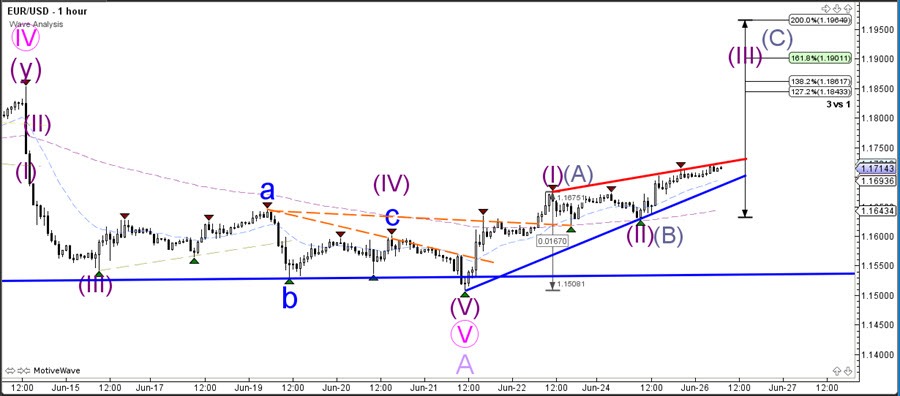
EUR/USD Approaches Key Resistance Zone At 1.1750-1.1840
The EUR/USD is showing bullish momentum but the overall trend remains down. Price is now approaching a key resistance spot at 1.1750-1.1840, which is critical decision zone.
The EUR/USD has 2 main options:price is either expanding the wave 4 (pink) via a sideways corrective pattern or building a bullish ABC (pink) zigzag as part of a wave B (purple).
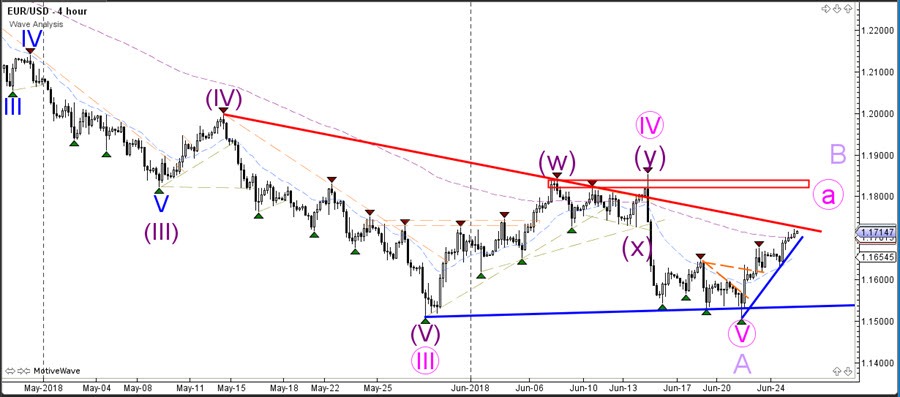
The EUR/USD broke the previous top for a new higher high. As expected the EUR/USD moved up eventually, despite the bearish trend. The bullish price action however is moving slowly which is hinting at a correction. Price could either be developing a 123 or ABC pattern depending on how price responds to the trend lines. A bullish breakout could see price test the Fibs of wave 3 whereas a bearish breakout could see price test the previous bottom.
GBP/USD Bullish Pullback Approaches 1.34 Resistance Zone
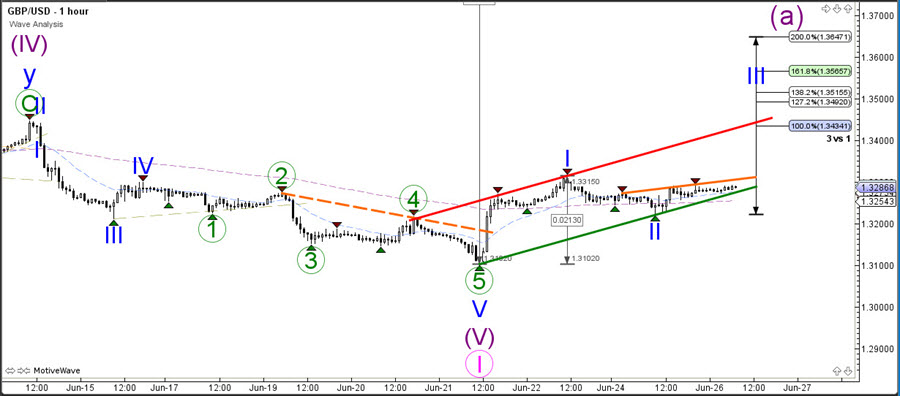
The GBP/USD showed a strong rally after reaching 1.31 support. Will price continue the bullish correction or will the downtrend emerge as the winner? For the moment a larger move up seems likely, at least towards the 23.6% Fib at 1.34. This is a major decision zone because a bullish breakout could confirm the start of a wave 2 (pink) whereas a bearish bounce could see price continue with the downtrend.
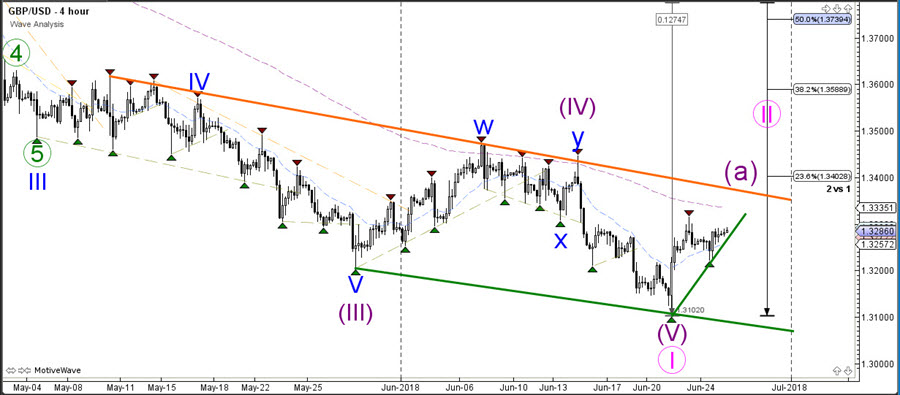
The GBP/USD could be building a potential wave 1-2 (blue) of a larger ABC correction if price breaks above the resistance trend line (orange) and 23.6% Fib at 1.34. Strong bearish price action could make this wave pattern invalid. The same would occur if price breaks below the bottom of 1.31.
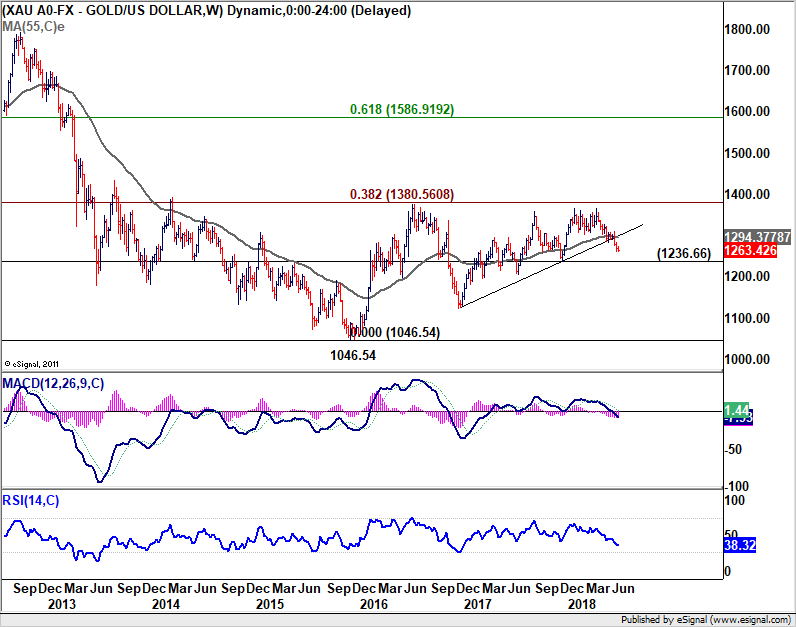
Gold building up bearishness for 1236 support
Gold's selling pressure re-emerges today and it looks like recovery from last week's low of 1261.52 has completed yesterday. Focus is back on 1261.52 now. And break will resume the fall from 1365.24. near term outlook is quite bearish, with solid break of trend line support and rejection by the falling 55 day EMA. 1236.66 will be the next downside. While some support might be seen there on first attempt, outlook will stay bearish as long as 1309.30 resistance holds.
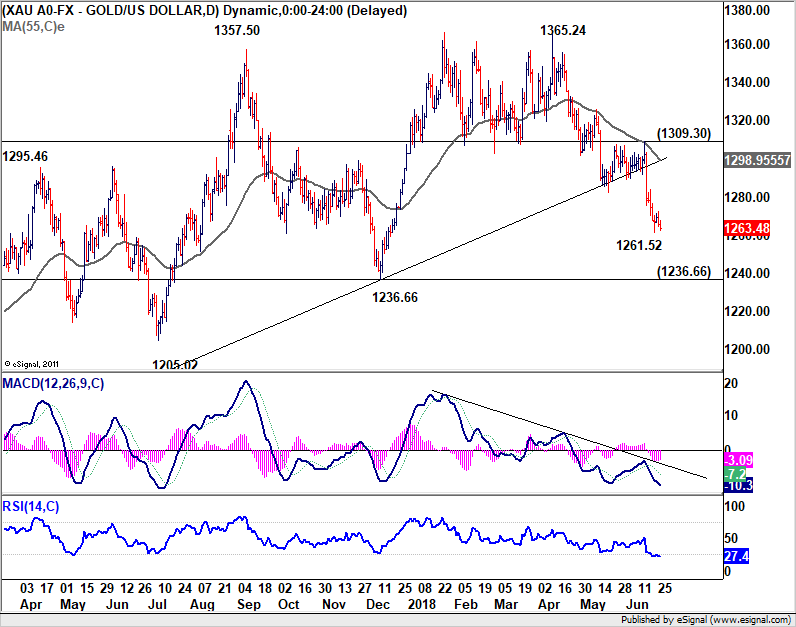
Also, current development also re-confirm the strong resistance from long term fibonacci level of 1920.94 (2011 high) to 1046.54 (2015 low) at 1380.56). Firm break of 1236.66 should at least send gold to 1046.54/1122.81 support zone, as a leg in the long term sideway pattern.
Crude Oil Under Pressure
Pivot (invalidation): 68.95
Our preference Short positions below 68.95 with targets at 67.15 & 66.65 in extension.
Alternative scenario Above 68.95 look for further upside with 69.45 & 70.05 as targets.
Comment The RSI is mixed to bearish.
Silver Spot Key Resistance At 16.3600
Pivot (invalidation): 16.3600
Our preference Short positions below 16.3600 with targets at 16.1800 & 16.1100 in extension.
Alternative scenario Above 16.3600 look for further upside with 16.4400 & 16.5500 as targets.
Comment The RSI is mixed to bearish.

UK automotive industry urged swift Brexit negotiation and rethink on customs union
UK Society of Motor Manufacturers and Traders urged "swifter progress" on Brexit negotiation and pushed for as deal that , as a minimum, "maintains customs union membership and delivers single market benefits."
SMMT Chief Executive Mike Hawes said in a report there is "growing frustration in global boardrooms at the slow pace of negotiations". And "the current position, with conflicting messages and red lines goes directly against the interests of the UK automotive sector which has thrived on single market and customs union membership."
Hawes added that there is "no credible plan B" for so called frictionless customs arrangements. And it's unrealistic to expect new trade deals with the rest of the world would " replicate the immense value of trade with the EU". He urged Prime Minister Theresa May's government to "rethink its position on the customs union".
He also pointed to "increasingly hostile and protectionist global trading environment". And the until the government can "demonstrate exactly how a new model for customs and trade with the EU can replicate the benefits we currently enjoy, don't change it.
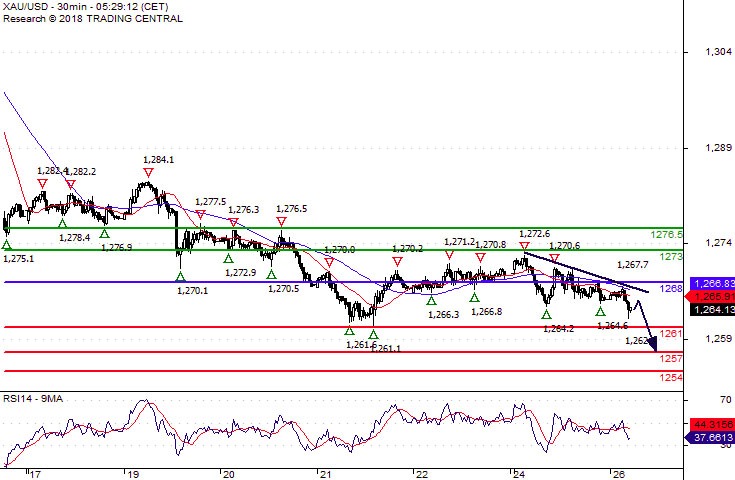
Gold Spot Key Resistance At 1268.00
Pivot (invalidation): 1268.00
Our preference Short positions below 1268.00 with targets at 1261.00 & 1257.00 in extension.
Alternative scenario Above 1268.00 look for further upside with 1273.00 & 1276.50 as targets.
Comment The RSI advocates for further decline.
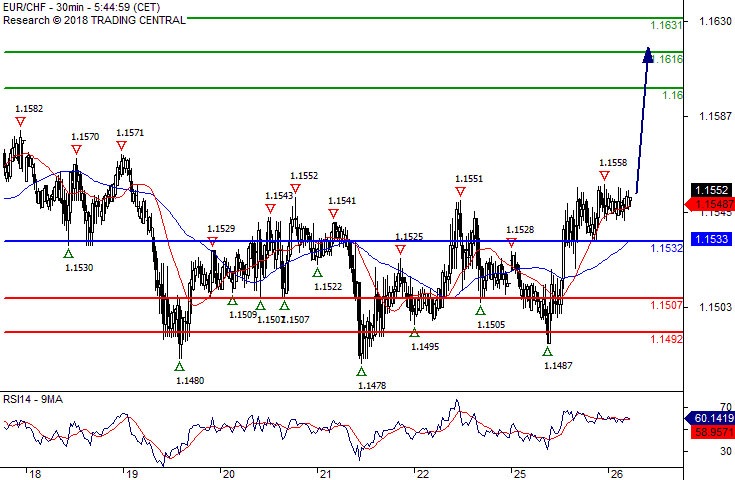
EUR/CHF As Long As 1.1532 Is Support Look For 1.1602
Our pivot (invalidation) point stands at 1.1532.
Our preference As Long as 1.1532 is support look for 1.1602.
Alternative scenario The downside breakout of 1.1532 would call for 1.1506 and 1.1491.
Comment The RSI is above its neutrality area at 50. The MACD is positive and below its signal line. The pair could retrace. Moreover, the pair is trading above both its 20 and 50 MAs (respectively at 1.1550 and 1.1534).
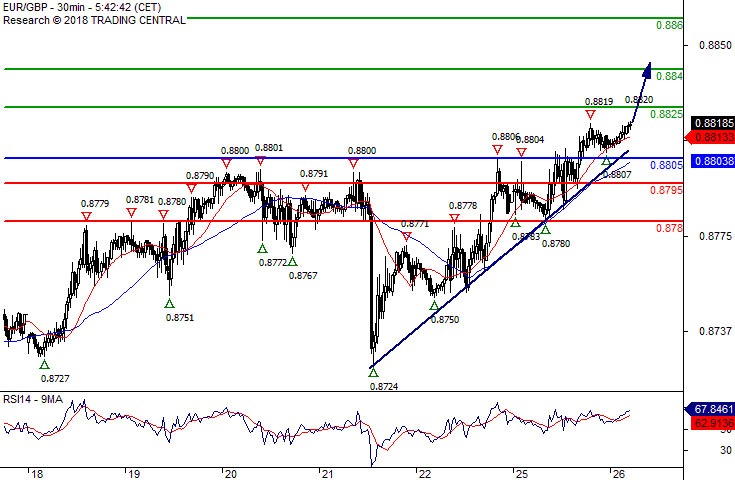
EUR/GBP Target 0.8825
Pivot (invalidation): 0.8805
Our preference Long positions above 0.8805 with targets at 0.8825 & 0.8840 in extension.
Alternative scenario Below 0.8805 look for further downside with 0.8795 & 0.8780 as targets.
Comment The RSI advocates for further upside.