Sample Category Title
Aussie Extends Its Losses In The Morning Session
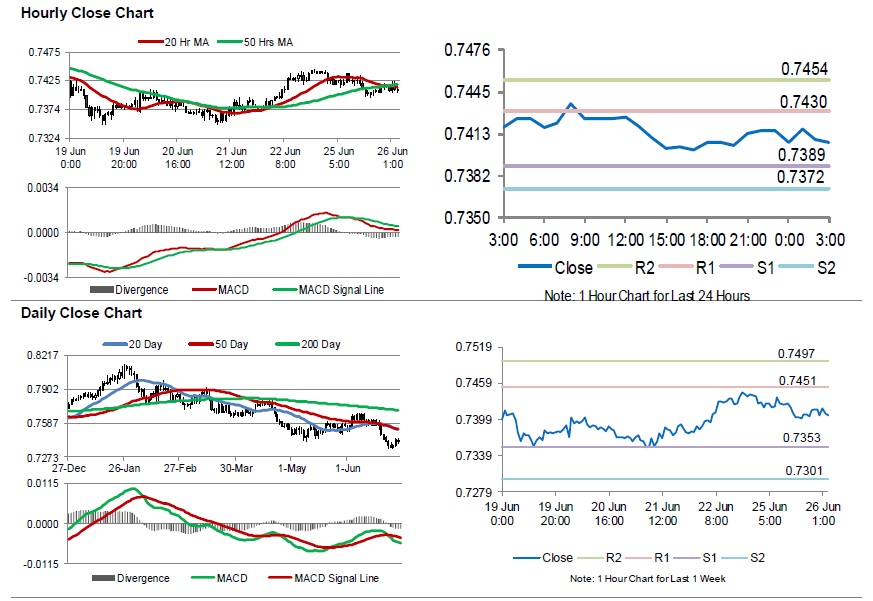
For the 24 hours to 23:00 GMT, the AUD declined 0.16% against the USD and closed at 0.7415.
LME Copper prices declined 0.4% or $28.0/MT to $6783.0/MT. Aluminium prices rose 0.3% or $6.0/MT to $2172.0/MT.
In the Asian session, at GMT0300, the pair is trading at 0.7406, with the AUD trading 0.12% lower against the USD from yesterday’s close.
The pair is expected to find support at 0.7389, and a fall through could take it to the next support level of 0.7372. The pair is expected to find its first resistance at 0.7430, and a rise through could take it to the next resistance level of 0.7454.
In absence of key economic releases in Australia today, traders would keep an eye on global macroeconomic releases for further direction.
The currency pair is showing convergence with its 20 Hr moving average and trading below its 50 Hr moving average.
Gold: Yellow Metal Trading On A Weaker Footing This Morning
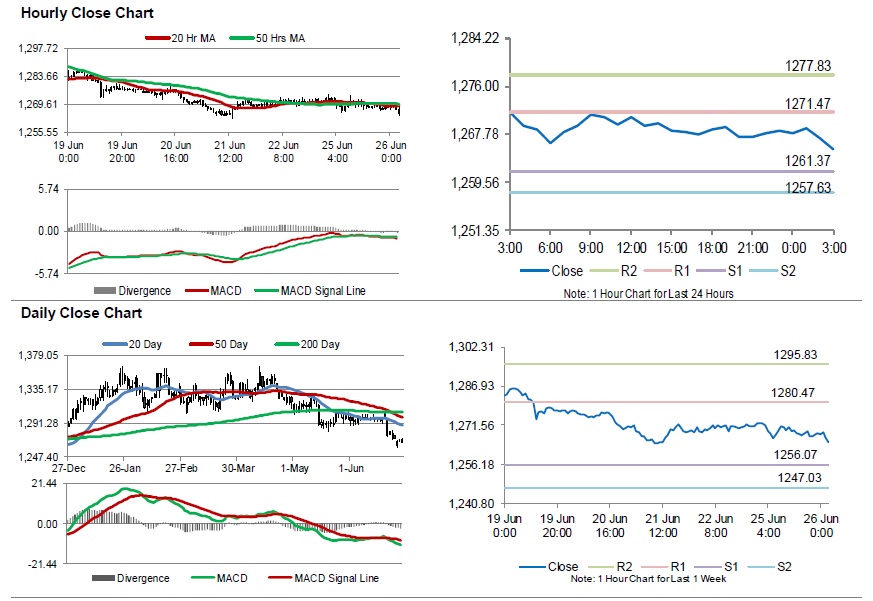
For the 24 hours to 23:00 GMT, Gold declined 0.35% against the USD and closed at USD1267.90 per ounce, as investors turned to the US Treasuries rather than bullion for safe haven investment.
In the Asian session, at GMT0300, the pair is trading at 1265.10, with gold trading 0.22% lower against the USD from yesterday’s close.
The pair is expected to find support at 1261.37, and a fall through could take it to the next support level of 1257.63. The pair is expected to find its first resistance at 1271.47, and a rise through could take it to the next resistance level of 1277.83.
The yellow metal is showing convergence with its 20 Hr moving average and trading below its 50 Hr moving average.
Silver: White Metal Extends Its Losses In The Morning Session
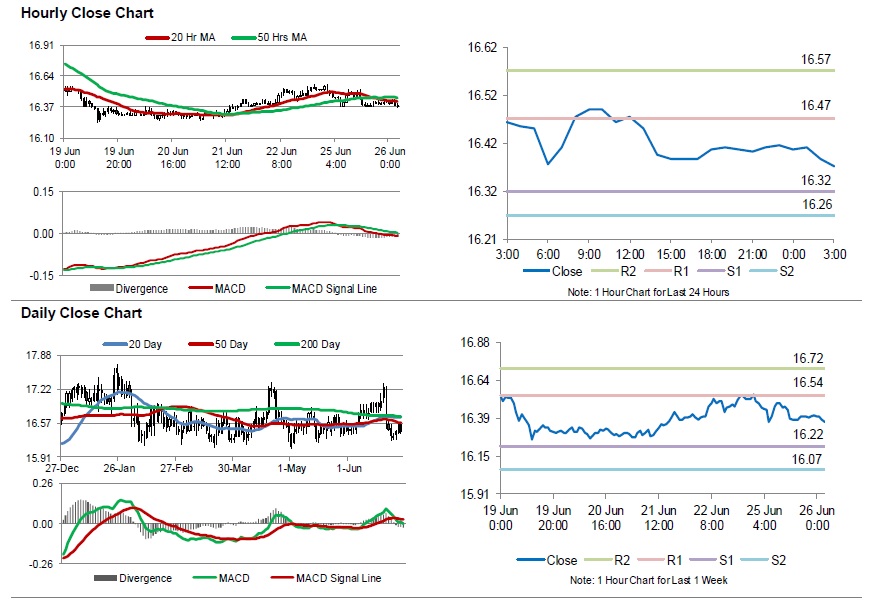
For the 24 hours to 23:00 GMT, Silver declined 0.45% against the USD and closed at USD16.42 per ounce, tracking losses in gold prices.
In the Asian session, at GMT0300, the pair is trading at 16.37, with silver trading 0.27% lower against the USD from yesterday’s close.
The pair is expected to find support at 16.32, and a fall through could take it to the next support level of 16.26. The pair is expected to find its first resistance at 16.47, and a rise through could take it to the next resistance level of 16.57.
The white metal is trading below its 20 Hr and 50 Hr moving averages.
Crude Oil: Oil Trading Lower, Ahead Of API Weekly Crude Oil Inventories Data
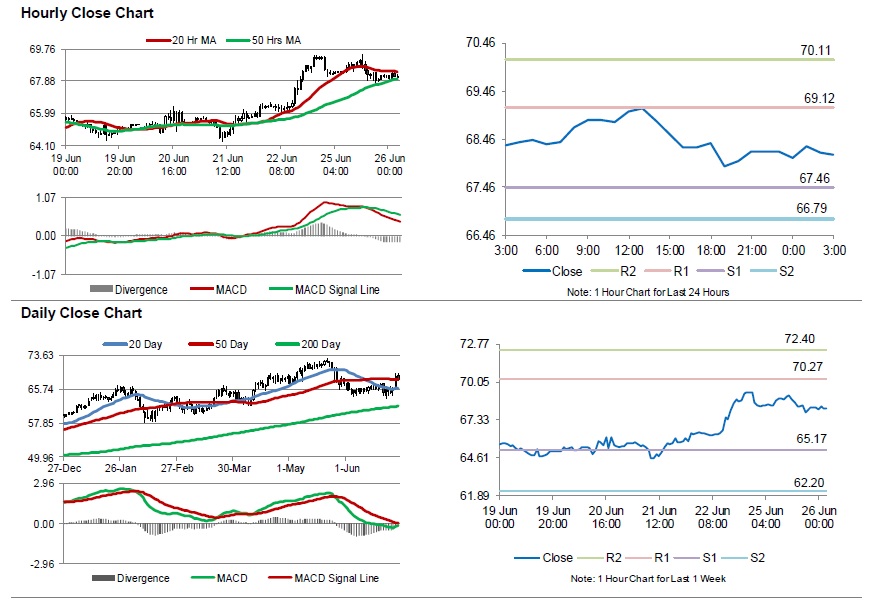
For the 24 hours to 23:00 GMT, Crude Oil declined 0.18% against the USD and closed at USD68.20 per barrel, amid uncertainty over an agreement by the Organization of the Petroleum Exporting Countries (OPEC) to raise crude production.
In the Asian session, at GMT0300, the pair is trading at 68.13, with oil trading 0.10% lower against the USD from yesterday’s close.
The pair is expected to find support at 67.46, and a fall through could take it to the next support level of 66.79. The pair is expected to find its first resistance at 69.12, and a rise through could take it to the next resistance level of 70.11.
Crude oil is trading between its 20 Hr and 50 Hr moving averages.
EURUSD Further Bullish Above 1.1674 Level
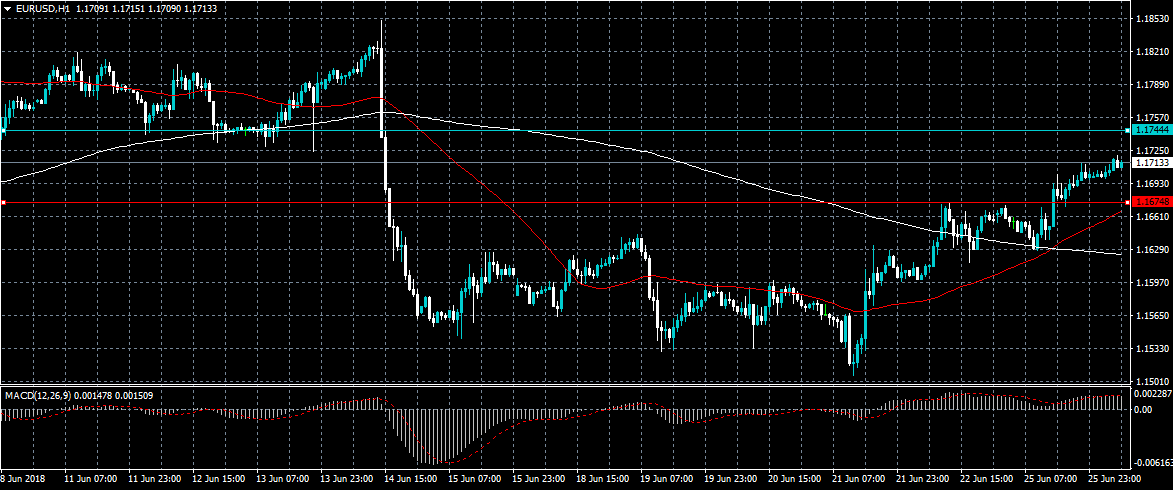
The euro has moved to its highest trading level against the US dollar since the last ECB meeting, with the EURUSD pair hitting a fresh weekly trading above the key 1.1700 level. Yesterday EURUSD buyers gained control of the pair, as they moved price well above the former weekly trading-high, of 1.1674. Technical indicators continue to call for further upside in the EURUSD pair, with multiple daily price-closes above the 1.1713 level needed for further bullish advancement towards 1.1800.
The EURUSD pair is intraday bullish while trading above the 1.1674 level, key technical resistance is located at the 1.1713 and 1.1744 levels.
If the EURUSD pair moves below the 1.1674 level the intraday trend will turn bearish, and price may fall towards the 1.1648 and 1.1628 levels.
GBPUSD Only Intraday Bullish Above 1.3270
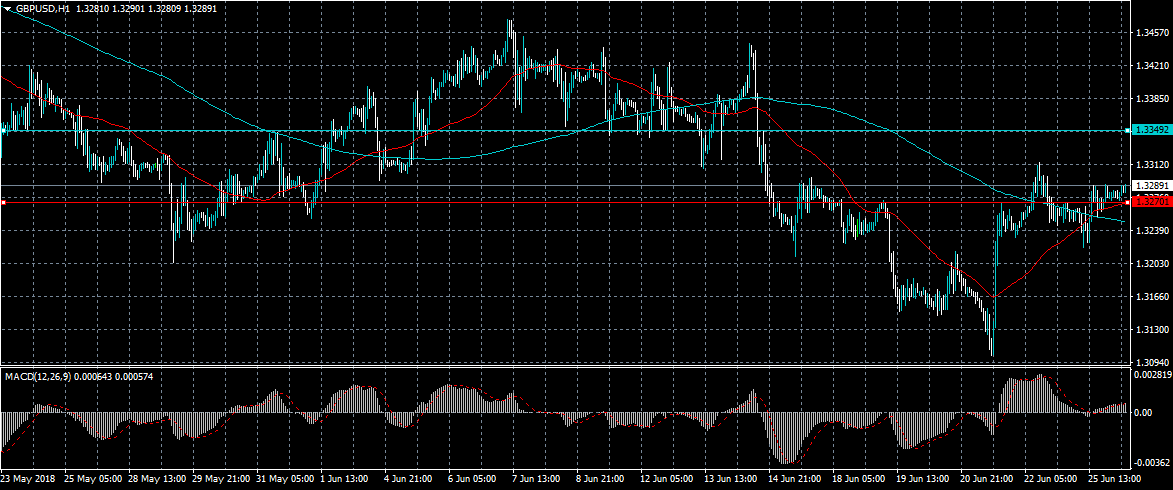
The British pound has moved towards the top-end of its recent short-term trading-range against the US dollar, as the greenback moves lower in early-week trading. The GBPUSD pair continues to probe towards the 1.3300 level, but has so failed to gain traction above this key level. Buyers will need to break the former weekly-high of 1.3313 to keep the bullish upside momentum intact, while sellers will look for continued technical failure below 1.3300 level.
The GBPUSD pair is only intraday bullish while trading above the 1.3300 level, key technical resistance is now located at the 1.3313 and 1.3349 levels.
If the GBPUSD pair moves below the 1.3270 level, key technical support can be found at the 1.3240 and 1.3215 levels.
FOMC Speeches In The Headlines On Tuesday
Monetary policy is back in focus on Tuesday as top central bankers from the US Federal Reserve and Bank of England deliver public commentary.
An absence of Eurozone data on Tuesday will shift the attention to the United Kingdom, where the British Bankers Association (BBA) is expected to report on monthly mortgage approvals. According to a median estimate of analysts, approvals are projected to rise to 38,200 in May compared with 38,049 the month before.
Two members of the Bank of England’s Monetary Policy Committee (MPC) are scheduled to deliver speeches in back-to-back sessions. MPC member Jonathan Haskel is first up at 09:00 GMT. Half an hour later, Ian McCafferty is scheduled to speak.
Federal Open Market Committee (FOMC) members Raphael Bostic and Robert Kaplan are scheduled to deliver public addresses at 14:00 GMT and 17:45 GMT, respectively.
Central bank speakers are closely watched by the financial markets for clues about the possible direction of monetary policy in the future. In the case of the Fed, interest rates are expected to rise at a quicker pace this year. Policymakers earlier this month voted in favour of raising the federal funds rate by 25 basis points. Two additional hikes are projected before the end of 2018.
In terms of economic data, S&P/Case-Shiller will deliver the monthly home price indices at 13:00 GMT. The report is expected to show 6.8% year-over-year growth in US home values during the month of April. Prices registered similar growth the month before.
At 14:00 GMT, the Federal Reserve Bank of Richmond will release the June edition of its manufacturing index. The headline reading is projected to show a reading of 15, down one point from May.
Commodity traders will also be keeping track of weekly crude oil inventory data courtesy of the American Petroleum Institute (API). The official inventory data is due the following morning.
EUR/USD
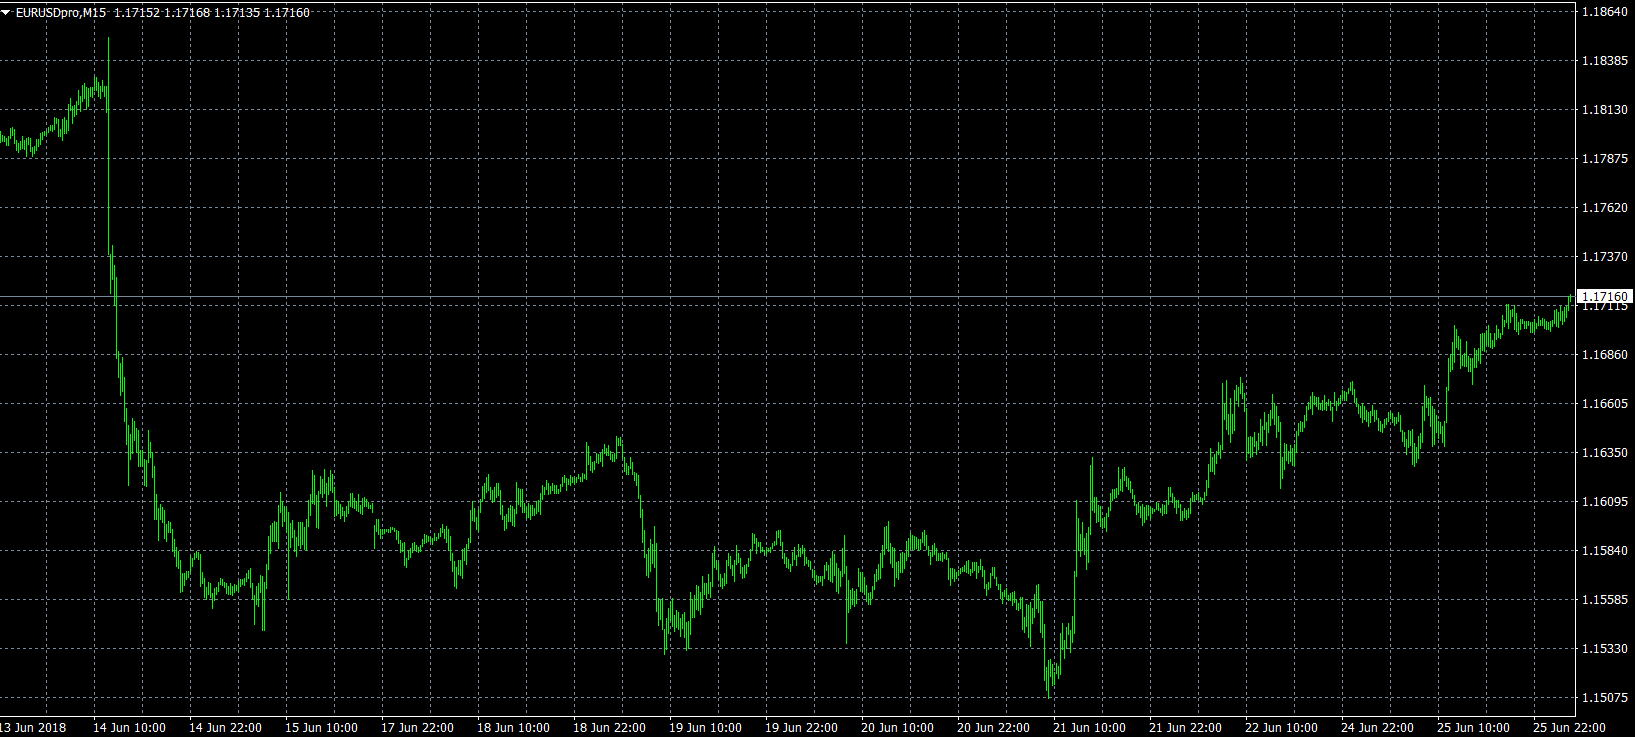
Europe’s common currency extended its recovery in early week trading, as the dollar backtracked against a basket of currencies. EUR/USD added 80 pips Monday and currently sits at 1.1715. The pair is eyeing the 1.1720 resistance, followed by 1.1750.
GBP/USD
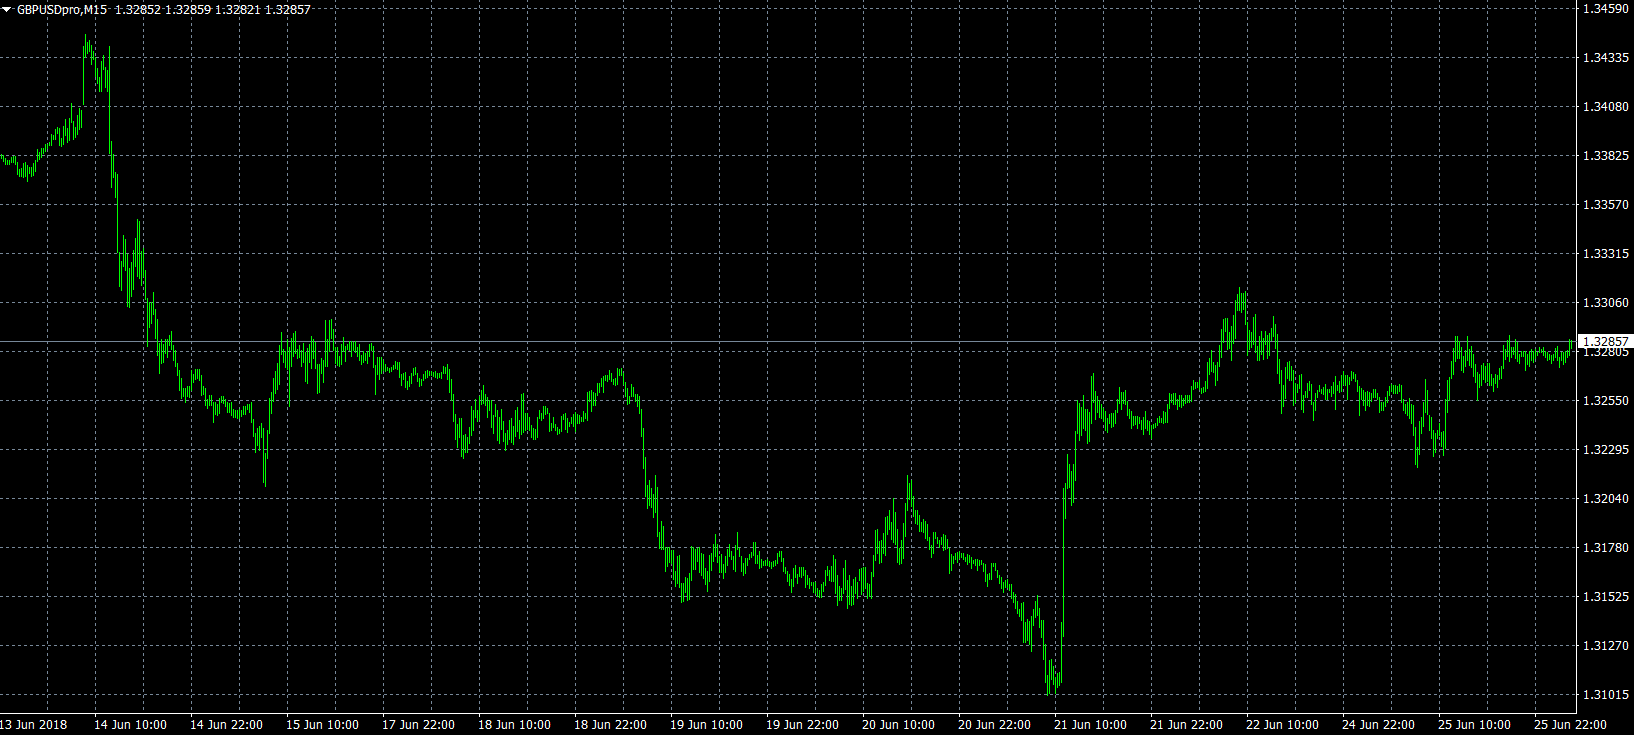
Pound sterling was quick out of the gate Monday as it jumped more than 60 pips against the dollar. GBP/USD now sits at 1.3285, having gained another 0.1% in Asian trading. The pair is running up to an important hurdle at 1.3300. A rally north of that level would likely expose 1.3315, followed by 1.3370.
USD/JPY
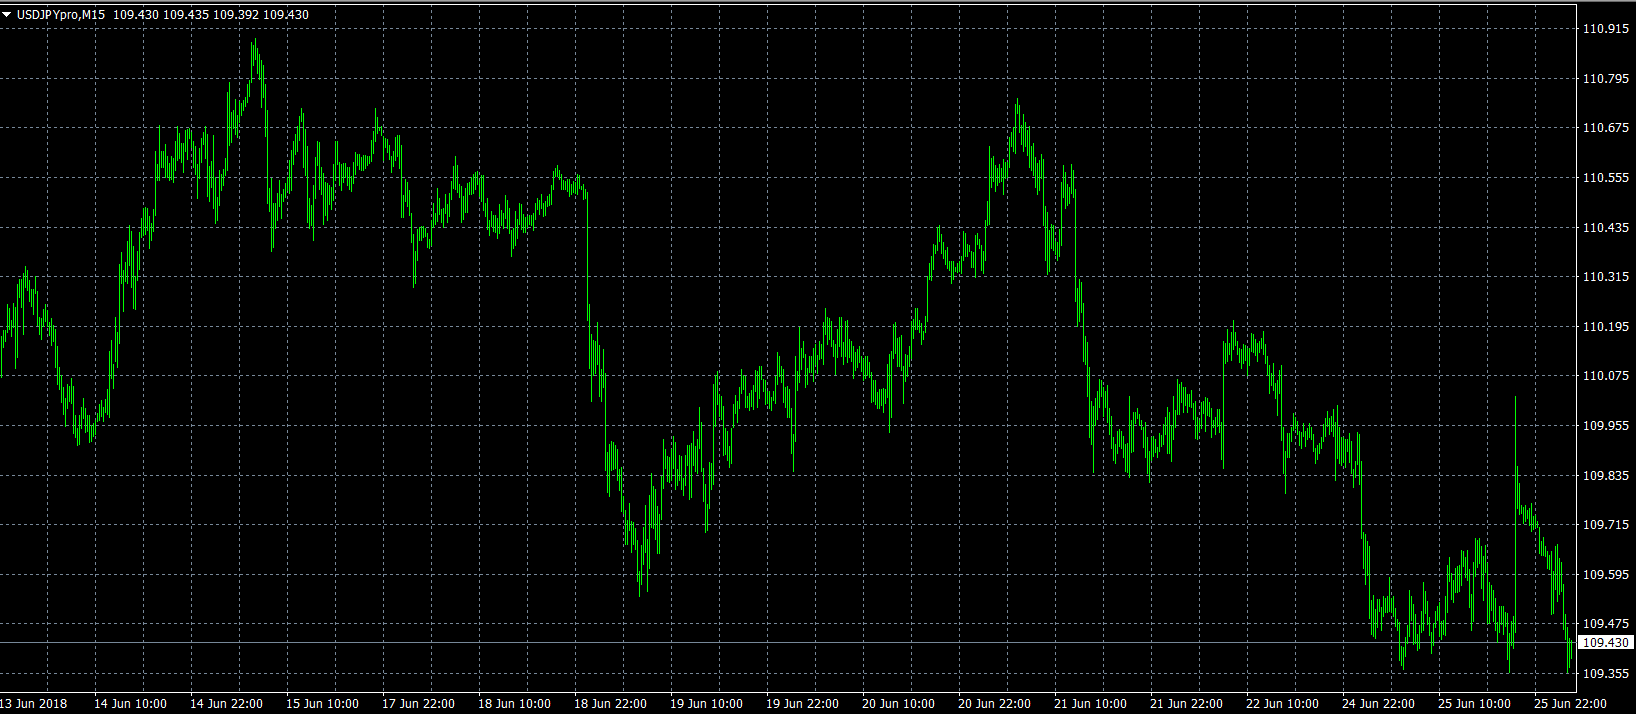
A receding dollar impacted USD/JPY negatively on Monday, as investors turned to risk-off mode in the wake of political risks involving the United States and China. USD/JPY is currently trading at 109.41. where it faces immediate support at 109.20. On the flipside, immediate resistance is located at 109.90.
USDSGD Showing Incomplete Elliott Wave Structure To The Upside
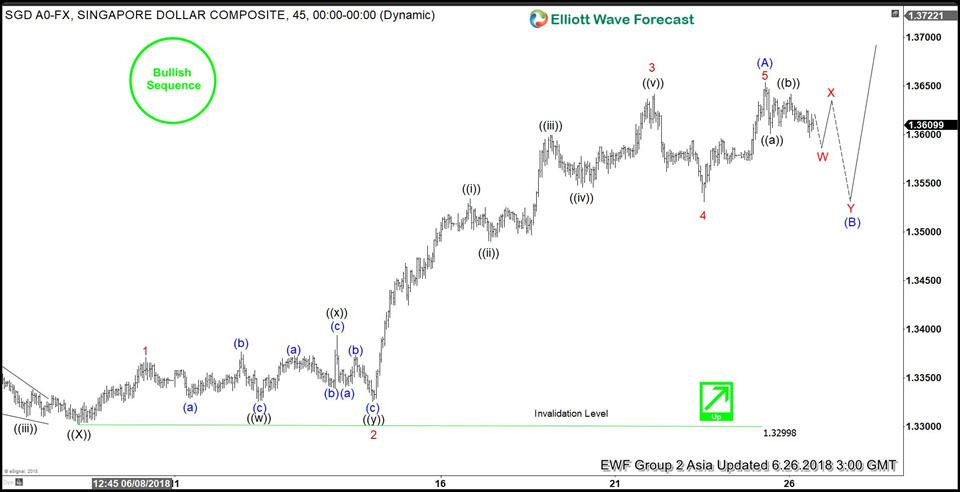
USDSGD short-term Elliott wave view suggests that the decline to 1.3299 on 6/07 low ended primary wave ((X)) pullback. Above from there, the pair rallied higher and went on to make a new high for this year creating 5 swing incomplete sequence to the upside from 1/25/2018 low. This sequence is represented by the bullish tag marked on the chart below.
The rally from 6/07 low appears to be in 5 waves & the structure looks impulsive. The 5 waves rally up from 6/7 low ended Intermediate wave (A) of an Elliott wave Zig-zag pattern at 1.3654. Up from Primary wave ((X)) low at 1.3299, the rally to 1.3371 high ended Minor wave 1. Then the pullback to 1.3326 low ended Minor wave 2 as double three structure.
Above from there, the pair made a strong rally in lesser degree 5 waves structure & ended Minor wave 3 at 1.3642 high. Down from there, the pullback to 1.3531 low ended Minor wave 4. Finally, the rally to 1.3654 high may have ended Minor wave 5 and also the Intermediate wave (A) of a Zigzag. The pair is now doing a pullback in Intermediate wave (B) to correct cycle from 6/07 low in 3, 7 or 11 swings before further upside is seen. We don’t like selling it and expect buyers to appear once Intermediate wave (B) pullback ends in 3, 7 or 11 swings for further upside, provided the pivot from 6/07 low (1.3299) stays intact.
USDSGD 1 Hour Elliott Wave Chart
In The US, The Conference Board Consumer Confidence Indicator For June Is Due To Be Released
Market Movers today
Market focus will continue to be on trade war issues and the contents of the expected US Treasury report later this week on foreign investments. The market will follow the preparation of the EU summit, where notably immigration problems seem to be contentious between European leaders. The EU summit will possibly also touch on an EU-wide response to the likely US tariffs on European car exports to the US.
In the US, the conference board consumer confidence indicator for June is due to be released. Consensus expects confidence to remain at present high levels boosted by low unemployment and prospective tax cuts.
In Denmark, the May retail sales are released today. In Sweden, the PPI inflation reading is due.
Selected market news
The fear of a full-blown trade war is now the single most important factor for the direction on global financial markets. Importantly, yesterday we got the first indication albeit small that the Trump administration is not immune to the bearish market sentiment that pushed Nasdaq down more than 2.2 % yesterday.
White House trade adviser Peter Navarro said on CNBC that a Treasury Department to be published later in the week on American restrictions on foreign investments will not be as damaging to growth as markets are anticipating. Navarro underlined that 'there are no plans to impose investment restrictions on any countries that are interfering in any way with our country. This is not the plan the whole idea that we're putting investment restrictions on the world please discount that all we're doing here with the president's trade policy is trying to defend our technology when it may be threatened'.
However, we doubt that the words from Navarro will be enough to calm market fears. China and the EU yesterday raised concerns that the protectionism risks pushing the world economy into recession and Harley Davidson said it would move some production out of the US to avoid new EU tariffs on its motorcycles. Note that earlier in the day, Treasury Secretary Steven Mnuchin had tweeted indicating that the administration would not focus its restriction efforts solely on China but on all countries. In addition, White House Press Secretary Sarah Sanders pointed in that direction.
Despite the poor equity sentiment in the US and a spike in VIX volatility, the support to US treasuries was modest. The 10Y treasury yield dropped just one bp though the 2Y10Y curve continued to flatten and is now at 34bp. USD/JPY has continued to move lower and Nikkei is down 0.5% at the time of writing.
The interviews with influential ECB members continue and this time it is Benoît Coeuré in Le Figaro . He argues that growth is still robust but also warns that' ...there is increasing uncertainty arising from tensions in world trade as well as the risk of volatility in the financial markets and in certain emerging economies, and we have to take all that into account'. He also says that QE reinvestment needs will be c.EUR15bn a month in 2018.
EUR/USD Daily Outlook
Daily Pivots: (S1) 1.1649; (P) 1.1682 (R1) 1.1736; More.....
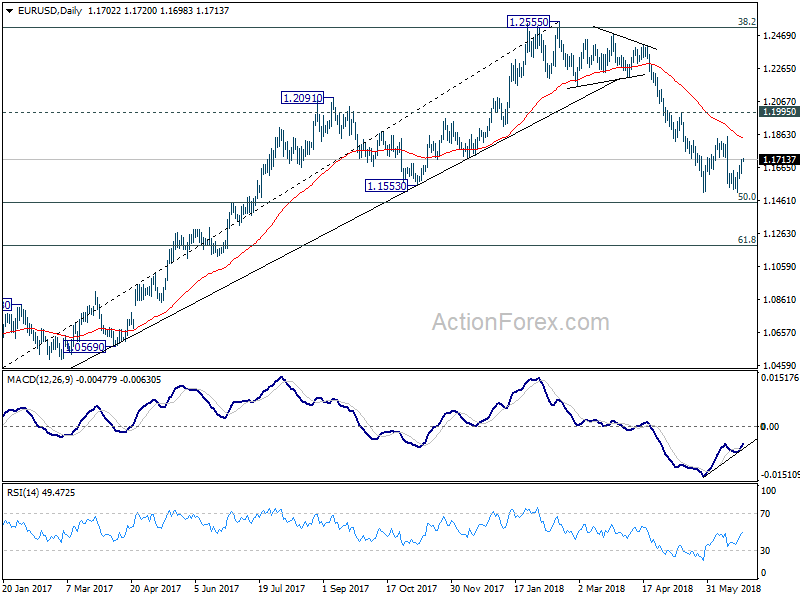
No change in EUR/USD's outlook. Recovery from 1.1507 is in progress and could extend higher. But still, it's seen as part of the consolidation from1.1509. Upside should be limited by 1.1851 resistance to bring fall resumption. On the downside, below 1.1628 minor support will bring retest of 1.1507 first. Break will resume the whole fall from 1.2555 through 50% retracement of 1.0339 to 1.2555 at 1.1447 to 61.8% retracement at 1.1186.
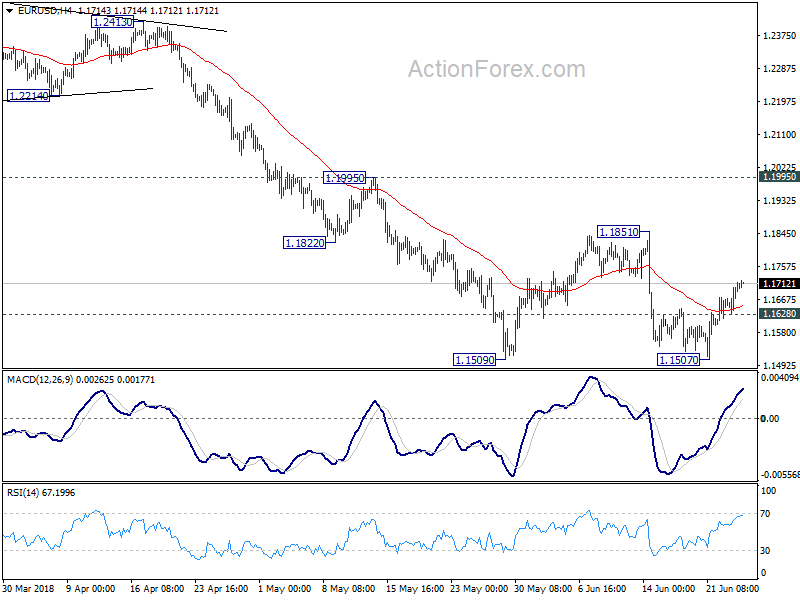
In the bigger picture, current development suggests that EUR/USD was rejected by 38.2% retracement of 1.6039 (2008 high) to 1.0339 (2017 low) at 1.2516. And, a medium term top was formed at 1.2555 already. Decline from there should extend further to 61.8% retracement of 1.0339 to 1.2555 at 1.1186 and below. For now, even in case of rebound, we won't consider the fall from 1.2555 as finished as long as 1.1995 resistance holds.