Sample Category Title
Swing Trades: EUR/USD
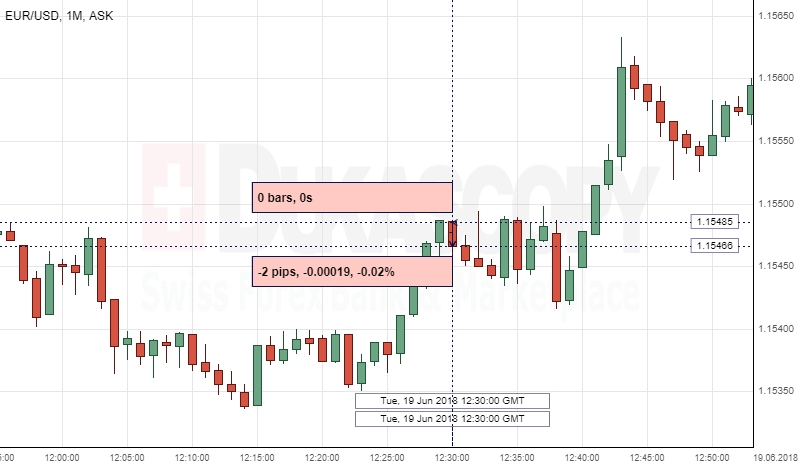
The Greenback strengthened against the European single currency, following the US Building data release on Tuesday. The EUR/USD currency pair lost two pips, or 0.02%, to continue fluctuating in the 1.5596 area.
The Census Bureau released Residential Building Permits data that came lower-than-expected with a forecast of 1.35M in May, and lower from the previous period.
A survey showed that builders are: "..increasingly concerned that tariffs placed on Canadian lumber and other imported products are hurting housing affordability."
GBP/CAD 4H Chart: Pound Sterling Strengthens
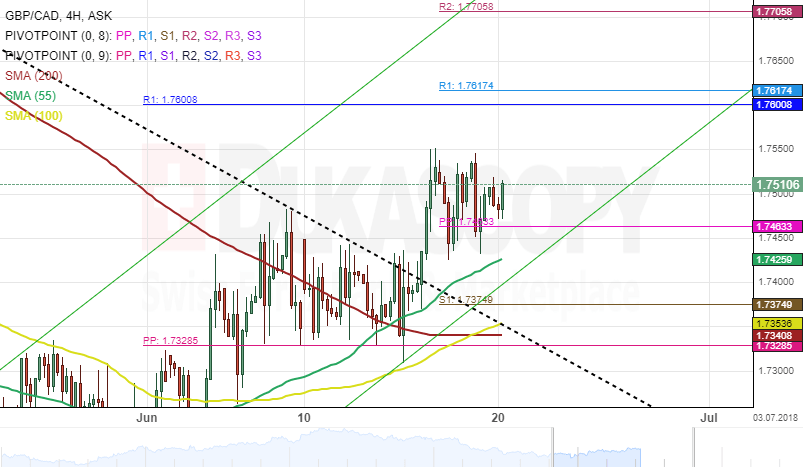
The downward movement predicted last week for the GBP/CAD exchange rate did not come into reality. Bulls took control of the market and as a result, a breakout occurred through the upper boundary of a descending pattern.
After testing the 55-, 100-hour SMAs and the monthly pivot point near the 1.7328 area, the Pound Sterling continues its upside journey against the Canadian Dollar.
Given that the currency exchange rate has breached the upper border of the descending channel, it is expected for the pair to target 1.76 which is a resistance cluster set by the weekly and monthly PPs.
GBP/AUD 4H Chart: Surges As Expected
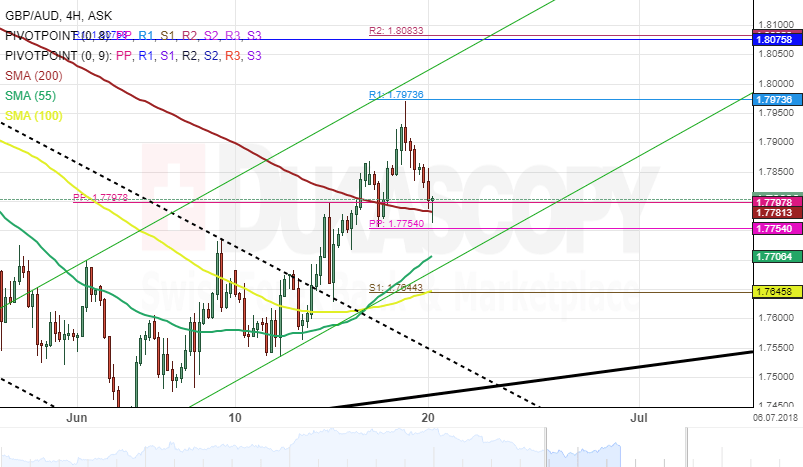
Following up on last week Monday analysis for the British Pound against the Australian Dollar. Bulls strengthened their position as expected and managed to move past the 200– hour simple moving average at 1.7782.
However, after hitting the weekly pivot point at 1.7973 on June 19, the currency pair made a brief retracement south. Meanwhile, a new junior ascending pattern has been spotted and mapped out to trail the price movement.
As for near future, the GBP/AUD currency exchange rate is likely to move further south toward the 55– and 100– hour SMAs during the following sessions before continuing its northern journey.
EURUSD Analysis: Returns Near One-Year Low
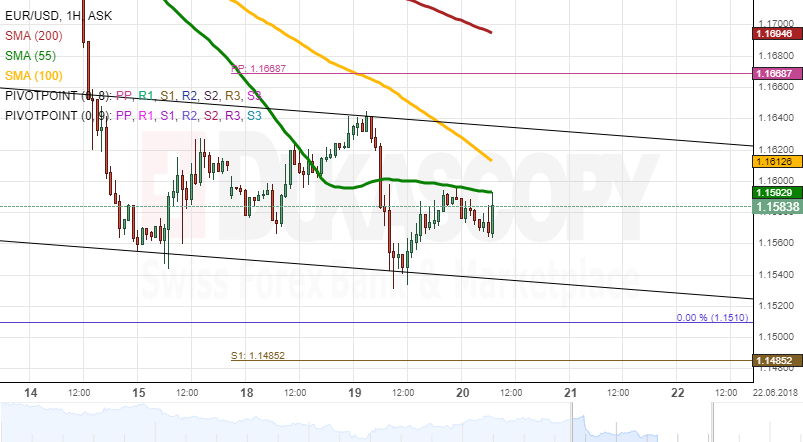
EUR/USD has been ranging for the third consecutive session with a slight tendency southwards. Despite moving above the 55-hour SMA early on Tuesday, the Euro failed to accelerate and thus back south at 1.1650.
By this morning, the rate was trading near its one-year low of 1.15. Even tough technical indicators are steadily recovering, the price has failed to pick up this bullish momentum.
It is likely that the first part of the day is spent calmly due to 55– and 100-hour SMAs pressuring the rate from above at 1.16. This resistance should eventually be breached to allow for a test of the 1.17 mark which should mark today's highest price, as it is strengthened by the 200-hour and 55– and 100-period (4H) SMAs.
GBPUSD Analysis: Approaches Channel Line
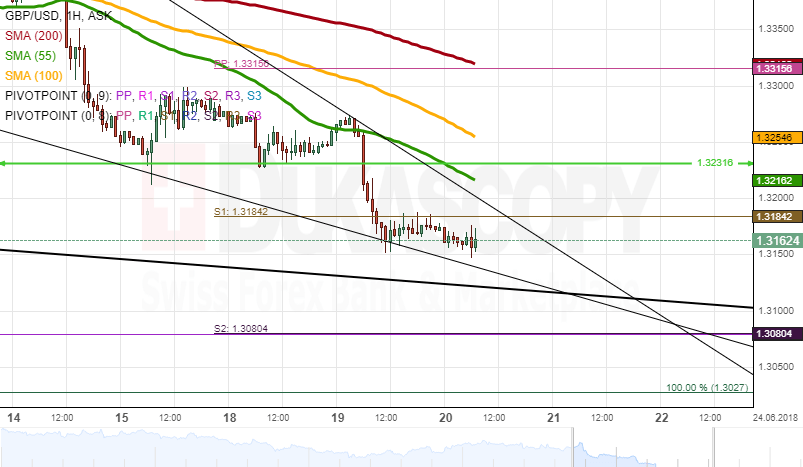
Despite flashing bullish signals early on Wednesday, the narrow range between the 55-hour SMA and a historic resistance/support level at 1.3232 was breached to the downside. This move extended the Pound's losses against the US Dollar to the third consecutive session.
The pair is trading near the bottom boundary of a six-week descending channel at 1.3125. Thus, it is likely that bears still manage to push the rate lower to 1.31 today. However, bulls are expected to lead the pair for the following 24 hours and even longer.
This is supported by converging technical indicators and the current sideways movement which shows that the strong bearish sentiment has eased considerably. Upside potential is apparent until the 55-hour SMA at 1.3232.
USDJPY Analysis: Pressured By Strong Resistance
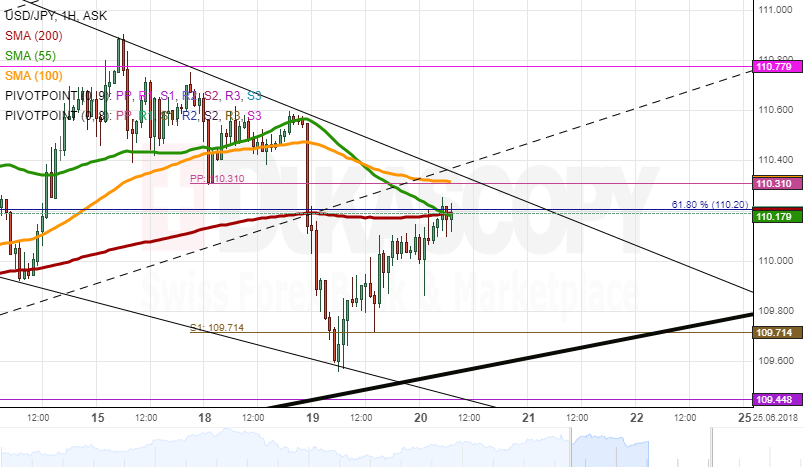
The strong plunge of the USD/JPY pair early on Tuesday was stopped by the combined support of the weekly S1, the monthly PP and the senior channel at 109.60. This was followed by a period of appreciation which allowed the US Dollar to return back to 110.30.
This territory is likely to provide considerable resistance to the pair, as it is strengthened not only by the 61.80% Fibonacci retracement and all three moving averages on the one-hour time-frame, but also the 55-period (4H) and 200-day SMAs. This resistance cluster should pressure the rate lower until the weekly S1 or the senior channel at 109.72 and 109.60, respectively.
In case the rate gathers the necessary bullish sentiment to breach this area, the Greenback should test its June high at 111.00.
Gold Analysis: Is Guided By 55-Hour SMA
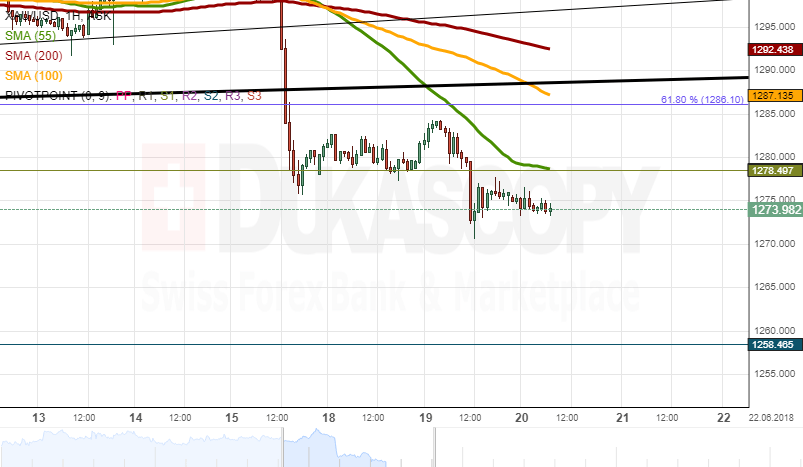
Apart from a 0.52% fall mid-Tuesday, the yellow metal managed to maintain its movement sideways against the US Dollar for the second consecutive session. This shows that both bulls and bears lack the necessary momentum to move the rate in their desired direction. Technical indicators remain bullish in this session.
In line with this scenario, Gold should reverse near 1,270.00, breach the 55-hour SMA and approach the combined resistance of the 100– and 200-hour moving averages and the senior channel at 1,290.00.
On the other hand, the pair resuming its move down should send it testing the monthly S2 at 1,260.00.
XAUUSD Intraday Analysis
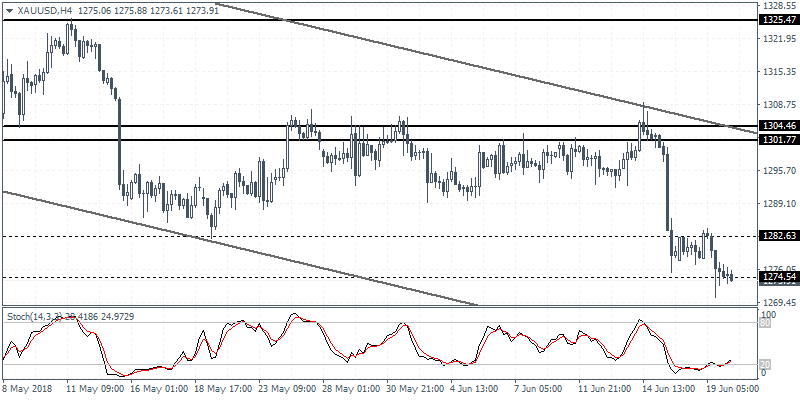
XAUUSD (1273.91): Gold prices continued to inch lower despite the broader market sentiment. Price action is seen hovering near the 1274.50 level of support marking the lower end of the support zone at 1282 and 1274. A close below this level could signal continued decline in price action. The declines come following a period of consolidation in price action below the 1304 - 1301 level of resistance. A break down below 1274 could trigger further declines to the next main support at 1242.25.
USDJPY Intraday Analysis
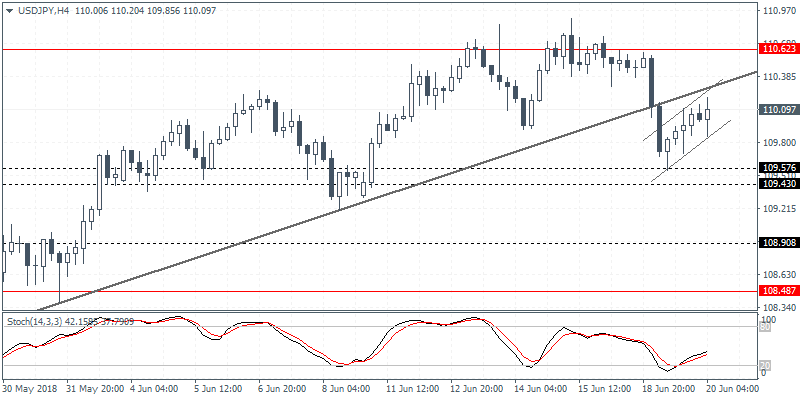
USDJPY (110.09): The USDJPY currency pair was seen to be closing bearish but price action managed to pullback from intraday lows of 109.57. Still, the near term retracement following the downside breakout from the rising trend line is expected to keep the bias to the downside. Failure to breakout above the trend line could signal another retest back to the support level at 109.57. There is also a possibility that USDJPY could break out from the bearish flag pattern which is yet to be validated.
EURUSD Intraday Analysis
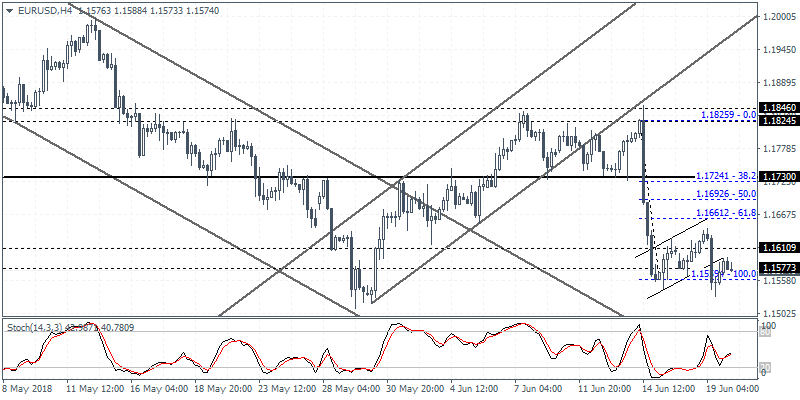
EURUSD (1.1574): The EURUSD currency pair formed an outside bar yesterday with the intraday gains failing to hold. The currency pair closed on a bearish note. The declines came following Draghi's comments from Portugal where he reiterated his comments from the recently held ECB meeting. Price action was seen to be steady above 1.1539 level of support for the moment. On the 4-hour chart, the EURUSD broke out to the downside from the bearish flag pattern only to retrace the losses rather quickly. Still, a close below the previous low at 1.15594 could suggest further declines.