Sample Category Title
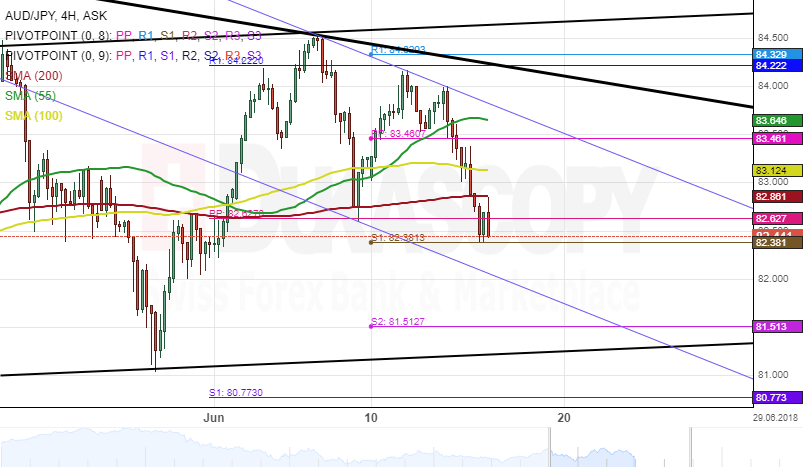
AUD/JPY 4H Chart: Bearish Market
Downside risks have dominated the Australian Dollar against the Japanese Yen after the currency pair hit a strong resistance cluster formed by the weekly and the monthly PPs near 84.32 on June 7.
Following a test of the northern border of a newly formed junior pattern, bears took control of the market and as a result, the exchange rate breached both the 55-,100-, and 200-hour SMAs.
From a technical analysis point of view, the AUD/JPY currency exchange rate could be set for a further decline toward the lower boundary of an ascending channel during the following trading sessions.
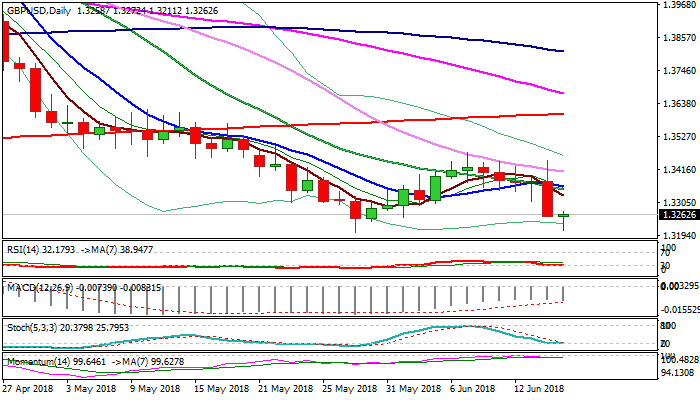
GBPUSD Outlook: Pressures Key Supports At 1.3207/04 As Negative Impact From ECB Impacts Pound
Cable dipped to new low at 1.3211 in early Friday's trading, in extension of previous day's strong fall, when the pair was down 09% for the day.
Strong bearish acceleration of Euro on dovish ECB dragged pound with negative impact persisting.
Today's extension approached key support at 1.32007/4 (weekly cloud top /29 May low, the lowest since November 2017), violation of which would generate strong bearish signal and expose next pivot at 1.3153 (Fibo 61.8% of post-Brexit 1.1930/1.4376 recovery phase).
Bears may take a breather above key supports, on profit-taking and oversold daily techs, however, limited upside action is seen ahead of final attack at 1.320704 pivots.
Upticks are expected to stall under thick 4-hr cloud (spanned between 1.3357 and 1.3392) to keep fresh bears in play.
Res: 1.3272, 1.3302, 1.3328, 1.3357
Sup: 1.3211, 1.3204, 1.3153, 1.3100
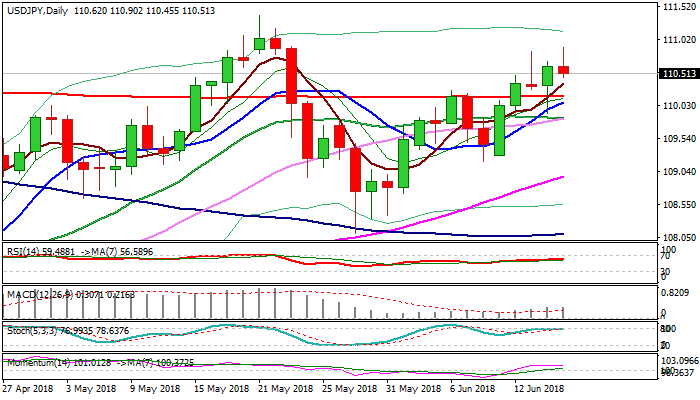
USDJPY Outlook – Hits New Highs As BoJ Keeps Ultra-Easy Policy, Bulls Consolidate Ahead Of Push Towards Key Barriers...
The pair extended rally on Friday and hit new three-week high at 110.90 after BoJ decided to keep ultra-easy policy on today’s meeting.
The dollar remains bid after hawkish Fed and Thursday’s close above strong option-barrier at 110.50 but showed hesitation on approach to psychological 111 resistance.
Broken 110.50 barrier contained consolidation for now, while deeper dips are expected to find ground above key 200SMA support (110.15) to keep bulls intact.
Bullish configuration of daily techs is supportive for further advance as formation of 5/200SMA Golden cross further underpins the action.
Current wave C of five-wave sequence from 108.11, hit its FE 76.4% at 110.85 and eyes Fibo 100% expansion at 111.36, to validate wave principles and open way for further advance on break above key barriers at 111.36/39 (FE 100% / 21 May high).
The pair is on track for strong bullish weekly close which is also positive signal.
Only return and weekly close below 200SMA would weaken near-term structure.
Res: 110.90, 111.39, 111.59, 112.00
Sup: 110.37, 110.15, 109.85, 109.75
BoJ Kuroda: Deflationary mindset caps medium- and long-term inflation expectations
In the post meeting press conference, BoJ Governor Haruhiko Kuroda admitted that " year-on-year growth in consumer prices is slowing". Falling durable goods prices and temporary fluctuations in hotel costs were part of the reasons. However, "companies' price-setting behavior appears to be changing" as they're passing on rising costs to consumer. Hence, the economy is "sustaining momentum" to achieve the 2% inflation target. Kuroda also said there will be further debate on price moves at the next meeting in July, when the quarter long-term forecasts will also be published.
Kuroda added that "Japan's economy is seeing labor markets tighten and the output gap improving, but prices aren't rising much." There are external factors from US and Europe. At the same time, that's the deflationary mindset of households and companies, which became entrenched due to 15 years of deflation." That's the reason keeping medium- and long-term inflation expectations subdued.
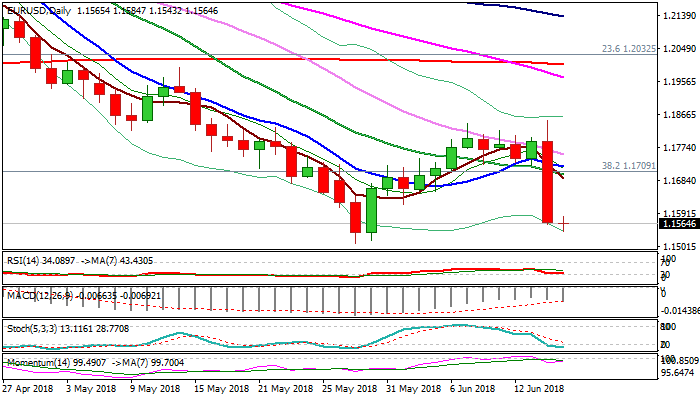
EURUSD Outlook – Bears Eye Key Support At 1.1509 After Thu’s 2% Fall, Correction May Precede Attack
The Euro remains in red on Friday and extends weakness from the previous day when it fell 2% on dovish ECB.
Thursday's fall marked the biggest one-day loss in two years and bears eye key support at 1.1509 (29 May low), following yesterday's close below the last obstacle at 1.1589 (Fibo 76.4% of 1.1509/1.1848 recovery leg).
Daily tech returned to full bearish configuration and support further weakness, boosted by bearish sentiment which further soured on ECB's announcement of keeping QE for the rest of the year and seeing no changes in the interest rates until the second half of 2019.
Expectations for attempts through 1.1509 pivot are rising and sustained break here would open way for extension of broader downtrend from 2018 high at 1.2555 towards targets at 1.1447 (50% retracement of 1.0340/1.2555 (Jan 2017 / Feb 2018 rally) and 1.1414 (weekly 200SMA).
Bears are expected to face strong headwinds at 1.1509 support and may correct higher before final attack.
Offers at 1.1650/1.1700 zone are seen as good levels for fresh shorts and should keep the upside limited.
Only close above 1.1700 (20SMA) would sideline bears.
Res: 1.1584, 1.1650, 1.1700, 1.1717
Sup: 1.1543, 1.1509, 1.1447, 1.1414
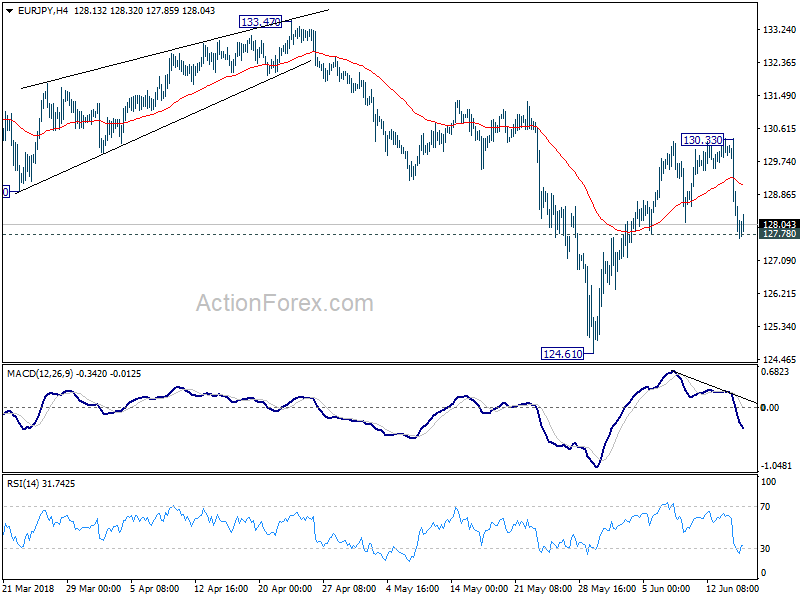
EUR/JPY Daily Outlook
Daily Pivots: (S1) 127.11; (P) 128.73; (R1) 129.59; More....
Focus is now on 127.78 support after the sharp decline from 130.33. Firm break there will confirm completion of the rebound from 124.61. Retest of 124.61 should be seen back then. Nonetheless, break of 103.33 will resume the rebound from 124.61 to retest 133.47 high.
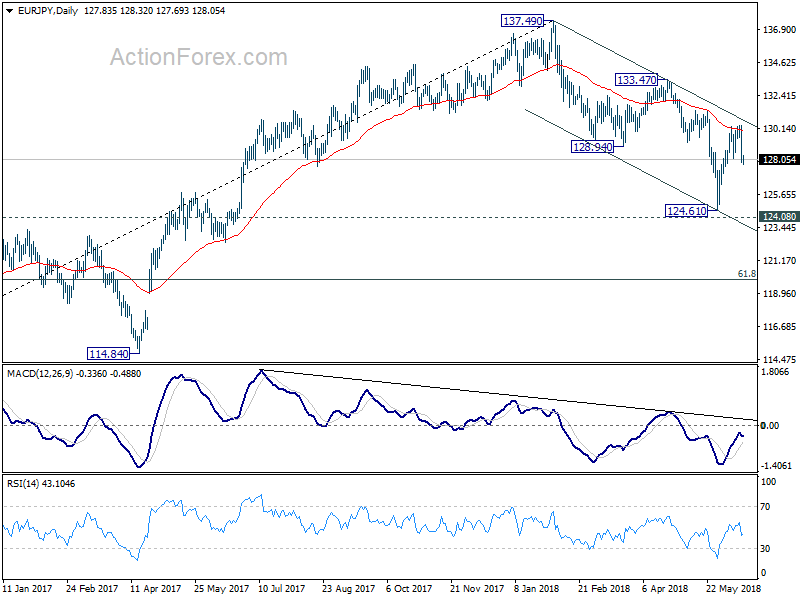
In the bigger picture, despite rebounding strongly ahead of 124.08 resistance turned support, there was no clear follow through buying. Note again that there is bearish divergence in daily MACD. Firm break of 124.08 will confirm trend reversal. That is, whole rise from 109.03 (2016 low) has completed at 137.49 already. In that case, deeper fall should be seen back to 61.8% retracement of 109.03 to 137.49 at 119.90 and below. Nonetheless, decisive break of 133.47 key resistance will likely extend the rise from 109.03 through 137.49 high.
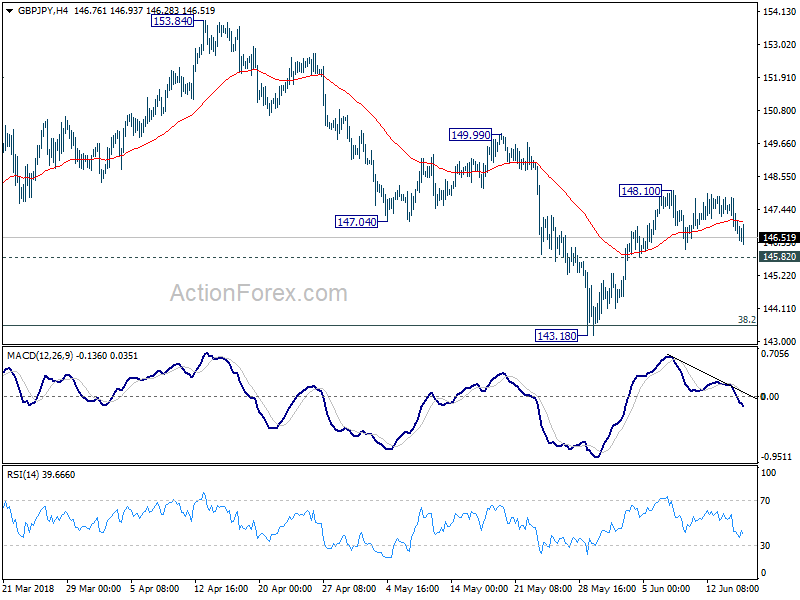
GBP/JPY Daily Outlook
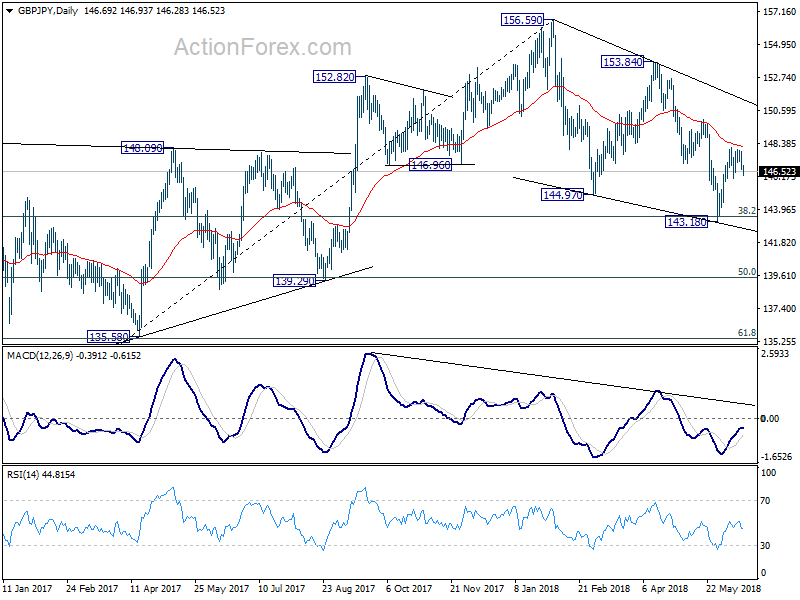
Daily Pivots: (S1) 146.28; (P) 147.06; (R1) 147.46; More...
GBP/JPY is staying in range of 145.82/148.10 and intraday bias remains neutral first. On the upside, above 148.10 will resume the rebound from 143.18 and target 149.99, and then 153.84 resistance. However, break of 145.82 minor support will argue that the rebound from 143.18 is completed and bring retest of this low.
In the bigger picture, no change in the view that decline from 156.59 is a corrective move. In case of another fall, strong support should be seen above 139.29 cluster support (50% retracement of 122.36 to 156.59 at 139.47) to contain downside and bring rebound. Meanwhile, break of 153.84 should confirm that the correction is completed and target 156.59 and above to resume the medium term up trend.
EUR/GBP Daily Outlook
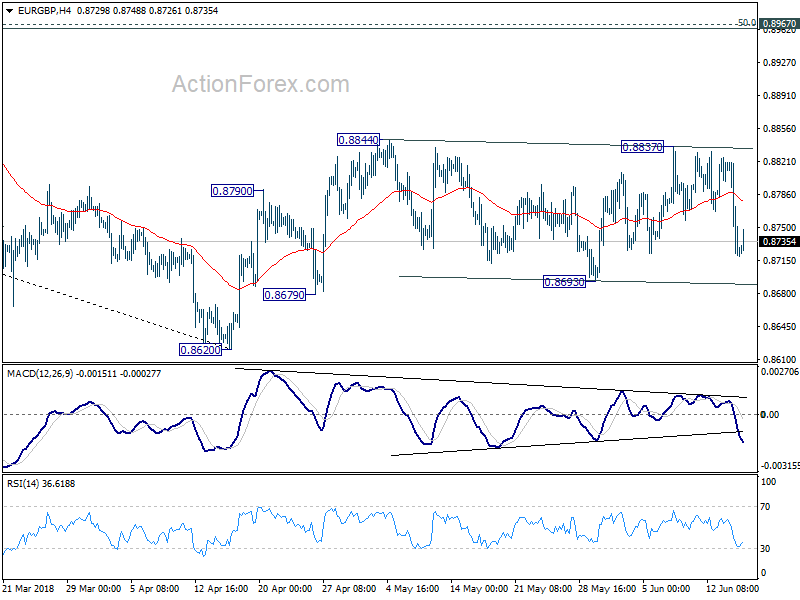
Daily Pivots: (S1) 0.8687; (P) 0.8755; (R1) 0.8792; More...
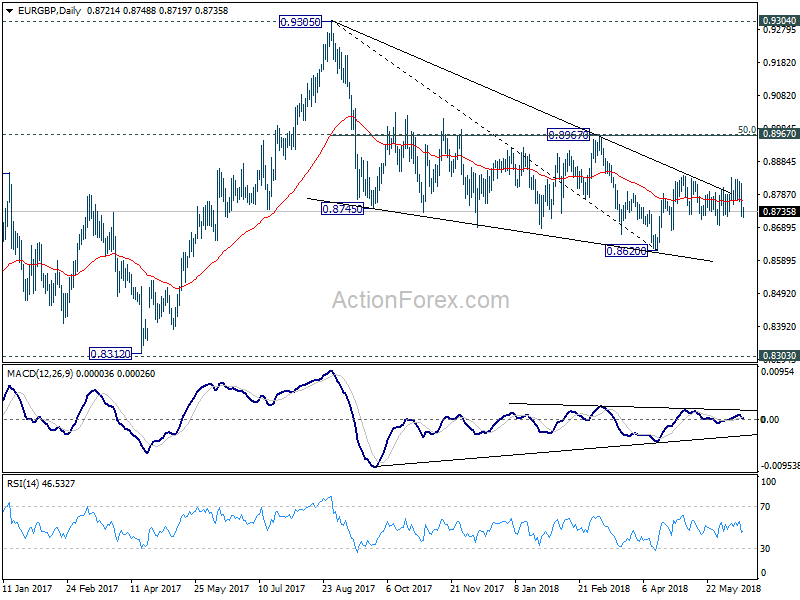
EUR/GBP dropped sharply but it's still staying in range of 0.8693/8844. Intraday bias remains neutral at this point. Another rise is expected as long as 0.8693 support holds. Break of 0.8844 will resume the rebound from 0.8620 for 0.8967 cluster resistance (50% retracement of 0.9305 to 0.8620 at 0.8963). However, break of 0.8693 will bring deeper fall back to retest 0.8620 low.
In the bigger picture, for now, the decline from 0.9305 is seen as a leg inside the long term consolidation pattern from 0.9304 (2016 high). Such consolidation pattern could extend further. Hence, in case of strong rally, we'd be cautious on strong resistance by 0.9304/5 to limit upside. Meanwhile, in another decline attempt, we'd expect strong support from 0.8116 cluster support (50% retracement of 0.6935 to 0.9304 at 0.8120) to contain downside.
EUR/CHF Daily Outlook
Daily Pivots: (S1) 1.1493; (P) 1.1571; (R1) 1.1611; More....
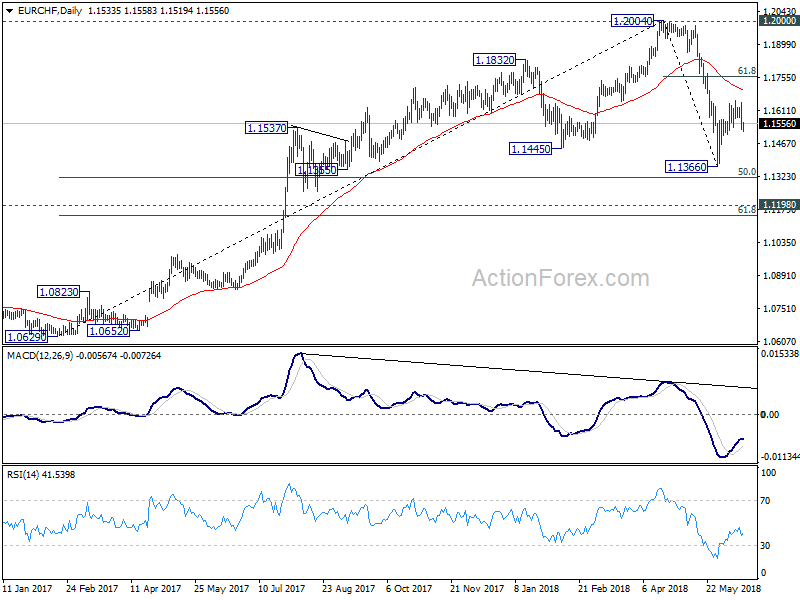
Despite dipping to 1.1519, EUR/CHF quickly recovered and intraday bias is turned neutral first. Outlook is unchanged at the the corrective pattern from 1.2004 is still in progress. And, another decline is expected before the correction completes. Below 1.1505 minor support will turn bias to the downside for retesting 1.1366 low first. Above 1.1656 will extend the rebound to 61.8% retracement of 1.2004 to 1.1366 at 1.1760. But, we'll we'll look for reversal signal above 1.1760.
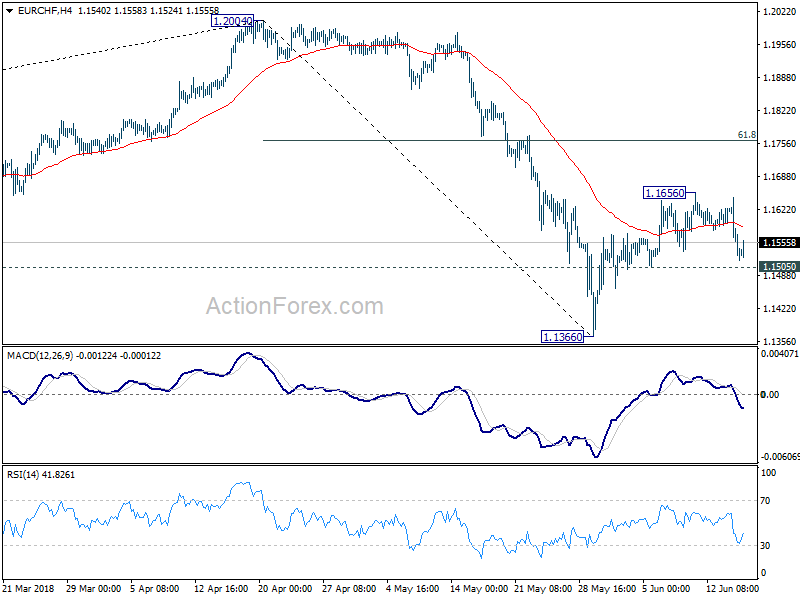
In the bigger picture, current development suggests solid rejection by prior SNB imposed floor at 1.2000. Considering bearish divergence condition in daily and weekly MACD, 1.2004 should be a medium term top. And price action from 1.2004 is correcting the up trend from 1.0629. Such correction is expected to extend for a while and therefore, we're not anticipating a break of 1.2004 in near term. Another decline cannot be ruled out yet. But in that case, strong support should be seen at 1.1198 (2016 high), 61.8% retracement of 1.0629 to 1.2004 at 1.1154 to contain downside.
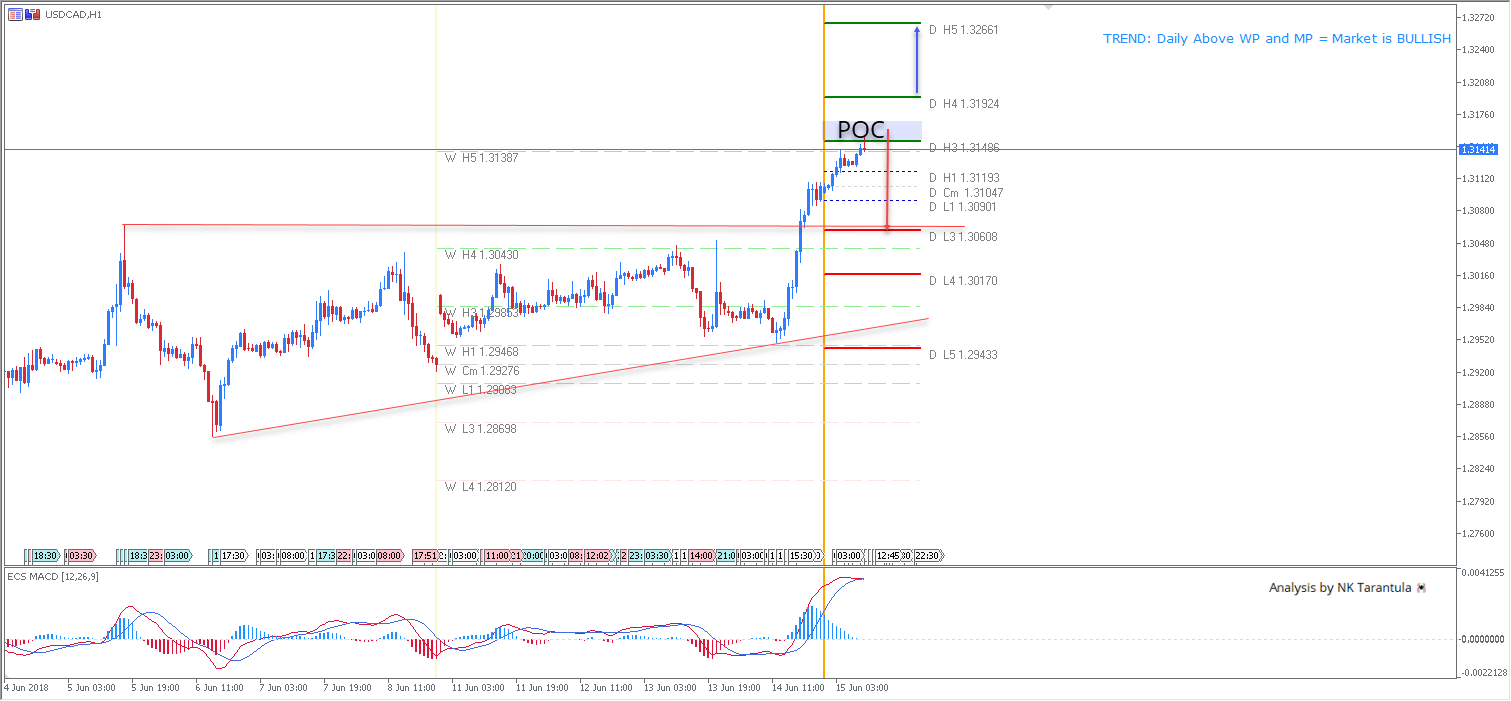
USD/CAD Exactly At Resistance Cluster
After the strong breakout of W H4 level, the USD/CAD has had a powerful upside momentum reaching both W H5 and new D H3 resistance. This is a resistance cluster now, and any sign of a bearish divergence or a reversal pattern could reject the price. Watch for the 1.3138-48 zone and a possible 1.3060 retest. However, if we don't see any rejection from the zone, the pair could go up further towards 1.3192. A strong close above 1.3192 should target 1.3266. However, W H5 is the strongest weekly resistance so there should be resistance there.
W L3 - Weekly Camarilla Pivot (Weekly Interim Support)
W H3 - Weekly Camarilla Pivot (Weekly Interim Resistance)
W H4 - Weekly Camarilla Pivot (Strong Weekly Resistance)
D H4 - Daily Camarilla Pivot (Very Strong Daily Resistance)
D L3 – Daily Camarilla Pivot (Daily Support)
D L4 – Daily H4 Camarilla (Very Strong Daily Support)
POC - Point Of Confluence (The zone where we expect price to react aka entry zone)