Sample Category Title
Japanese Industrial Production Revised Higher In April
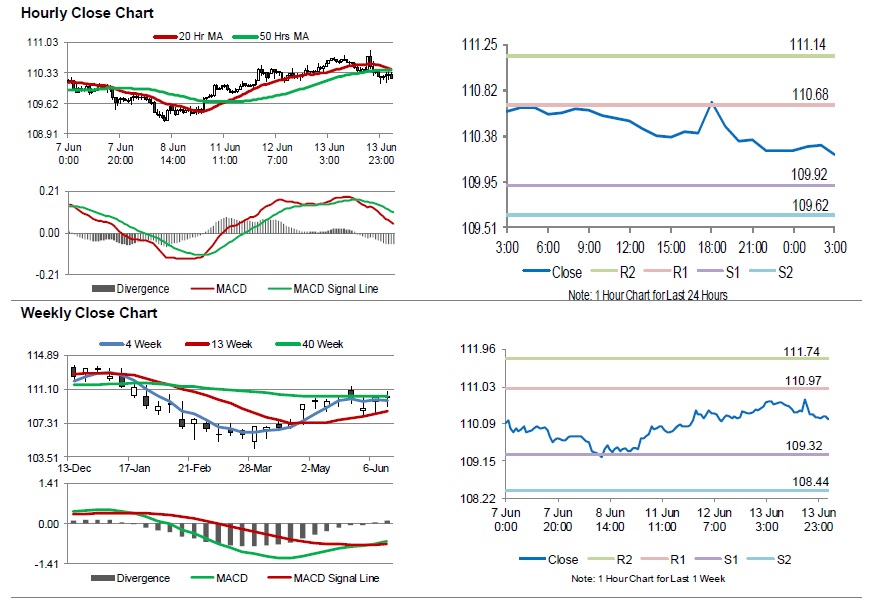
For the 24 hours to 23:00 GMT, the USD declined 0.18% against the JPY and closed at 110.25.
In the Asian session, at GMT0300, the pair is trading at 110.21, with the USD trading marginally lower against the JPY from yesterday’s close.
Early morning data revealed that Japan’s final industrial production climbed by 0.5% on a monthly basis in April, more than market expectations for a rise of 0.3%. Industrial production had registered a rise of 0.3% in the previous month.
The pair is expected to find support at 109.92, and a fall through could take it to the next support level of 109.62. The pair is expected to find its first resistance at 110.68, and a rise through could take it to the next resistance level of 111.14.
Trading trend in the Japanese yen is expected to be determined by the Bank of Japan’s (BoJ) monetary policy decision, due to be released overnight.
The currency pair is trading below its 20 Hr and 50 Hr moving averages.
Swiss Franc Trading A Tad Lower In The Morning Session
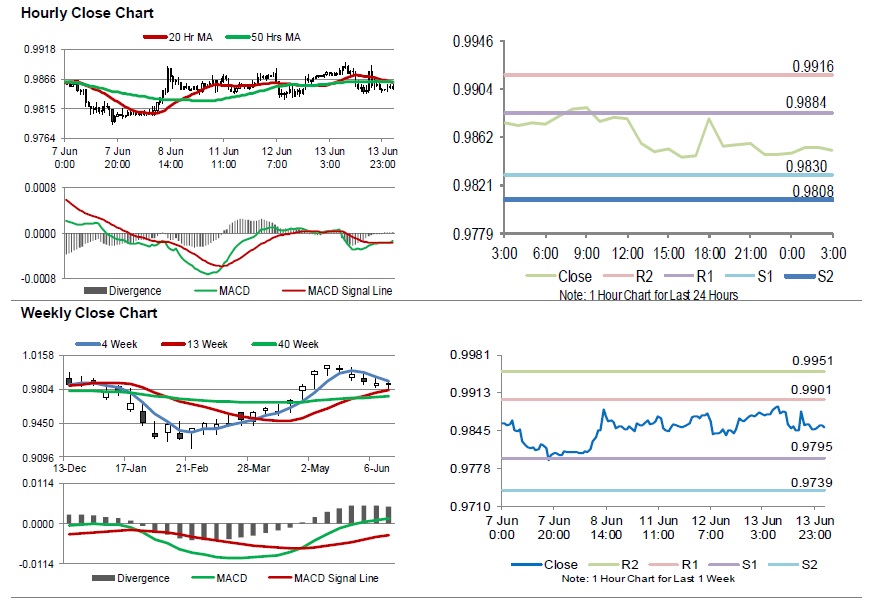
For the 24 hours to 23:00 GMT, the USD declined 0.25% against the CHF and closed at 0.9847.
Data showed that Switzerland’s producer and import prices grew 3.2% on an annual basis in May, compared to a gain of 2.7% reported in the previous month.
In the Asian session, at GMT0300, the pair is trading at 0.9851, with the USD trading slightly higher against the CHF from yesterday’s close.
The pair is expected to find support at 0.9830, and a fall through could take it to the next support level of 0.9808. The pair is expected to find its first resistance at 0.9884, and a rise through could take it to the next resistance level of 0.9916.
The currency pair is trading below its 20 Hr and 50 Hr moving averages.
Loonie Trading On A Weaker Footing In The Asian Session
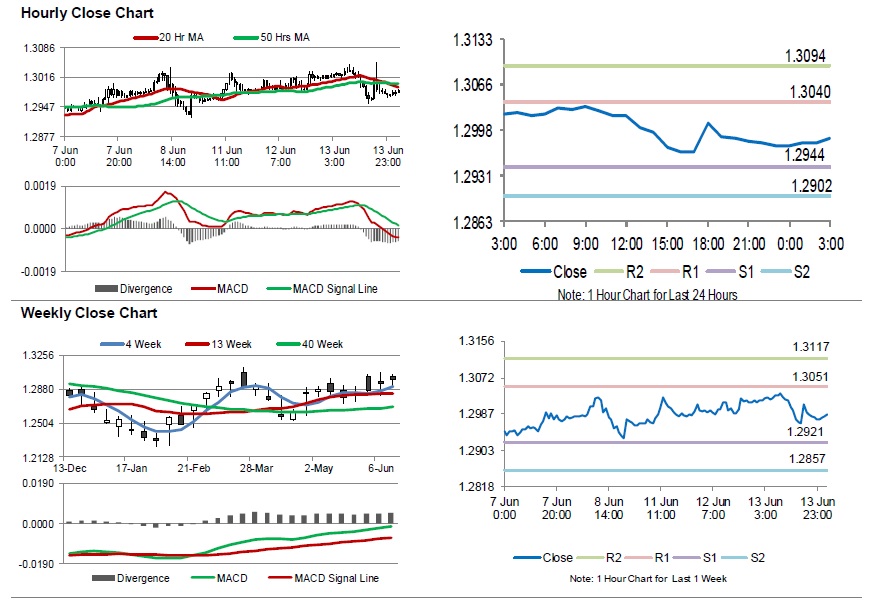
For the 24 hours to 23:00 GMT, the USD declined 0.34% against the CAD and closed at 1.2976.
In the Asian session, at GMT0300, the pair is trading at 1.2986, with the USD trading 0.08% higher against the CAD from yesterday’s close.
The pair is expected to find support at 1.2944, and a fall through could take it to the next support level of 1.2902. The pair is expected to find its first resistance at 1.304, and a rise through could take it to the next resistance level of 1.3094.
Moving ahead, investors would look forward to Canada’s new house price index for April, slated to release later in the day.
The currency pair is trading below its 20 Hr and 50 Hr moving averages.
Australia’s Unemployment Rate Declined To A 6-Month Low Level In May
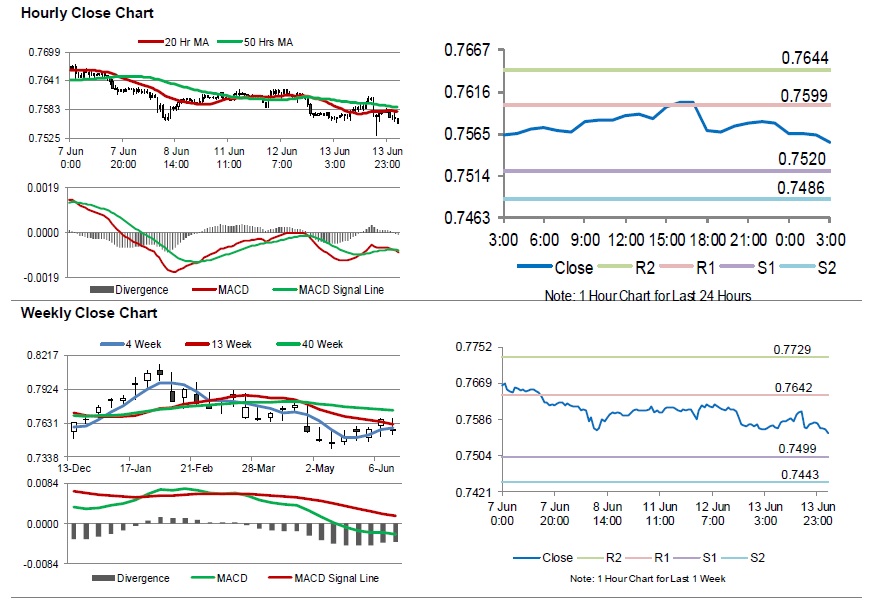
For the 24 hours to 23:00 GMT, the AUD rose 0.09% against the USD and closed at 0.7577.
LME Copper prices declined 1.34% or $31.0/MT to $2278.0/MT. Aluminium prices rose 0.01% or $1.0/MT to $7201.5/MT.
In the Asian session, at GMT0300, the pair is trading at 0.7555, with the AUD trading 0.29% lower against the USD from yesterday's close.
Overnight data indicated that Australia's seasonally adjusted unemployment rate declined to 5.4% in May, hitting a 6-month low and suggesting that the nation's labour market is strengthening. Markets were expecting unemployment rate to ease to 5.5%, after registering a reading of 5.6% in the previous month.
On the other hand, the nation's consumer inflation expectations climbed to 4.2% in June, compared to a reading of 3.7% in the prior month.
Elsewhere, in China, Australia's largest trading partner, retail sales rose to 8.5% on an annual basis in May, undershooting market consensus for a rise to 9.6%. In the previous month, retail sales had recorded an advance of 9.4%. Additionally, the nation's industrial production expanded 6.8% on an annual basis in May, lower than market expectations for a gain of 7.0%. In the previous month, industrial production had advanced 7.0%.
The pair is expected to find support at 0.7520, and a fall through could take it to the next support level of 0.7486. The pair is expected to find its first resistance at 0.7599, and a rise through could take it to the next resistance level of 0.7644.
The currency pair is trading below its 20 Hr and 50 Hr moving averages.
Gold: Yellow Metal Reverses Its Gains In The Asian Session
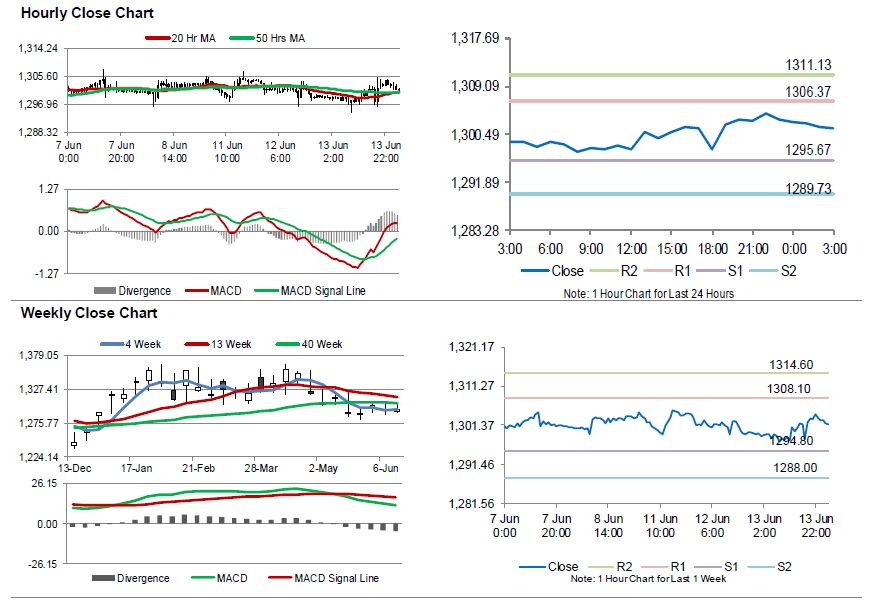
For the 24 hours to 23:00 GMT, Gold rose 0.38% against the USD and closed at USD1304.10 per ounce, amid a broad weakness in US Dollar and US equities.
In the Asian session, at GMT0300, the pair is trading at 1301.60, with gold trading 0.19% lower against the USD from yesterday’s close.
The pair is expected to find support at 1295.67, and a fall through could take it to the next support level of 1289.73. The pair is expected to find its first resistance at 1306.37, and a rise through could take it to the next resistance level of 1311.13.
The yellow metal is showing convergence with its 20 Hr moving average and trading above its 50 Hr moving average.
Silver: White Metal Trading Lower In The Morning Session
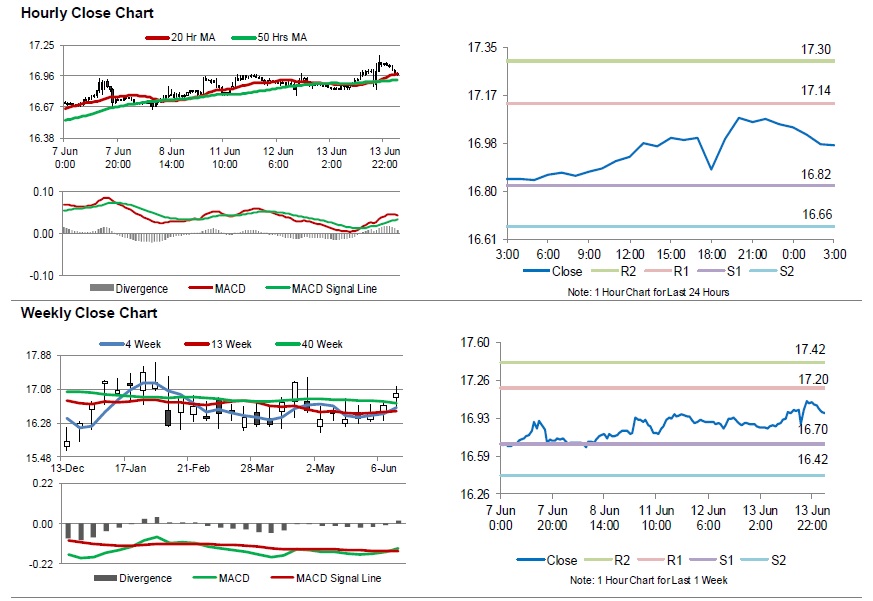
For the 24 hours to 23:00 GMT, Silver rose 1.07% against the USD and closed at USD17.06 per ounce, tracking rise in gold prices.
In the Asian session, at GMT0300, the pair is trading at 16.98, with silver trading 0.47% lower against the USD from yesterday’s close.
The pair is expected to find support at 16.82, and a fall through could take it to the next support level of 16.66. The pair is expected to find its first resistance at 17.14, and a rise through could take it to the next resistance level of 17.307.
The white metal is showing convergence with its 20 Hr moving average and trading above its 50 Hr moving average.
Crude Oil: Oil Extends Its Gains In The Morning Session
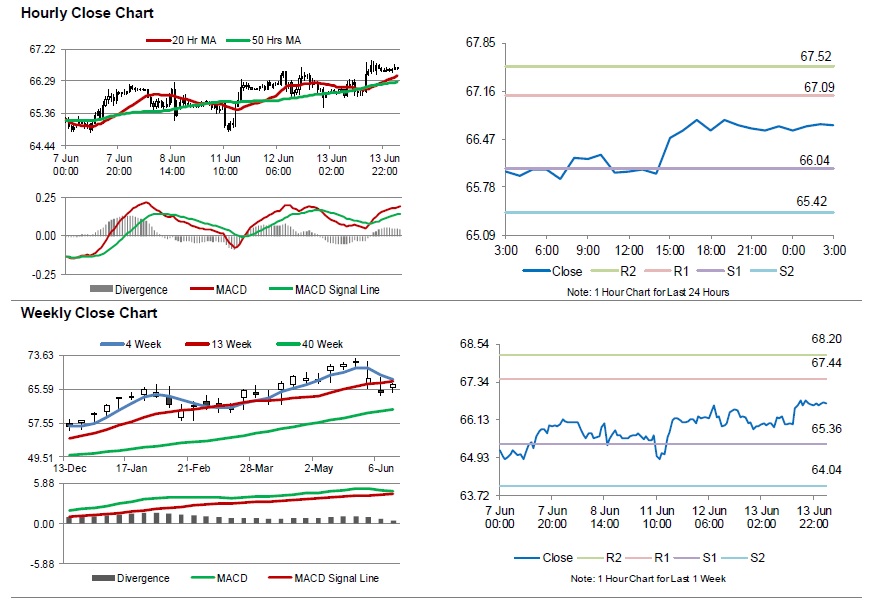
For the 24 hours to 23:00 GMT, Crude Oil rose 1.23% against the USD and closed at USD66.65 per barrel, after the US Energy Information Administration (EIA) reported that crude supplies dropped more-than-expected by 4.1 million barrels in the week ended 8 June 2018, marking its largest fall since the end of March 2018.
In the Asian session, at GMT0300, the pair is trading at 66.67, with oil trading slightly higher against the USD from yesterday’s close.
The pair is expected to find support at 66.04, and a fall through could take it to the next support level of 65.42. The pair is expected to find its first resistance at 67.09, and a rise through could take it to the next resistance level of 67.52.
Crude oil is trading above its 20 Hr and 50 Hr moving averages.
No Stopping The Fed From Getting To Neutral
Fed hikes policy rate by 25 bps to 1.75%-2% New dot plot shows 1 additional rate hike in 2018 and 2019 FOMC statement drops accommodative guidance; 4 hikes away from neutral Muted market reaction: US curve bear flattens, dollar unchanged, stocks lower Powell introduces press conferences after every meeting, starting next year
The Fed hiked its policy rate as widely anticipated by 25 bps from 1.50%‐1.75% to 1.75%‐2%. The decision was unanimous. The balance sheet run‐off (currently $30bn/month) goes according to plan. The issue that it puts pressure on emerging markets especially in combination with higher US budget deficits, as raised by RBI governor Patel last week, wasn't touched upon.
Fed Chairman Powell confirmed that the US economy is doing very well and the outlook remains favourable. Unemployment and inflation are low and the Fed reached its dual mandate of maximum unemployment and price stability. In its statement, the Fed upgraded its language on economic activity (“solid rate”), unemployment (“declined”), household spending (“picked up”) and investments (“continued to grow strongly”). Fresh growth forecasts remained unchanged though compared with three months ago for 2019 (2.4%), 2020 (2.1%) and the longer run (1.8%). This year's median increased to 2.8% from 2.7%. Fiscal stimulus is expected to continue to play an important role. Powell acknowledged for the first time that the trade conflict is a rising risk, but it isn't in the numbers yet.
Turning to the job market, the Fed expects it to remain strong. The path for the projected unemployment rate was downwardly revised from 3.8% in 2018, 3.6% in 2019 and 3.6% in 2020 to 3.6%, 3.5% and 3.5%. The NAIRU forecast was unchanged at 4.5%. Powell clearly mentioned that payrolls levels we've witnessed the past years are unsustainable in the near future. The labour market will continue to strengthen at lower payrolls growth levels.
The inflation path faced an upward revision to 2.1% in 2018, 2019 and 2020, coming from 1.9%, 2% and 2.1% respectively. Price developments are encouraging, but it's too early to declare victory yet. Inflation is expected to remain above the Fed's 2% target in the foreseeable future, but the FOMC will look through this transitory effect which mainly stems from higher oil prices. Powell stressed on multiple occasions that the Fed's inflation target is symmetric, suggesting no willingness to step up the tightening cycle because of a temporary overshoot.
Neutral policy stance by mid-2019?!
The upbeat economic assessment triggered marginal, but significant changes to the FOMC's new dot plot. One governor raised his forecast for this year from a total of 3 rate hikes to 4. Given the tight call in March, it proved to be sufficient to raise the median FOMC forecast from 2.125% to 2.375%, indicating two more rate hikes this year, probably in September and December. The median FOMC projections for 2019 increased as well, from 2.875% to 3.125% (3 hikes in 2019) after two governors lifted their dot compared to March. The 2020 median forecast (3.375%) and the one for the long term neutral rate (2.875%) remained unchanged. The latter remains very sensitive to upward revisions though with 7 governors thinking the neutral rate is higher and 7 who believe it is lower.
Powell said at the press conference that we're 4 rate hikes away from a neutral rate. That's why the FOMC decided to drop its crisis‐introduced forward guidance on rates. “The Federal Funds rate is likely to remain, for some time, below levels that are expected to prevail in the longer run” no longer features in the statement. Powell warned for the risk of rising rates too slowly and the risk of rising them too rapidly. We think that the Fed will continue raising its policy rate on a quarterly basis between now and June next year, consistent with the sustained expansion of economic activity, strong labor market conditions and inflation near the Committee's symmetric 2% objective over the medium term.
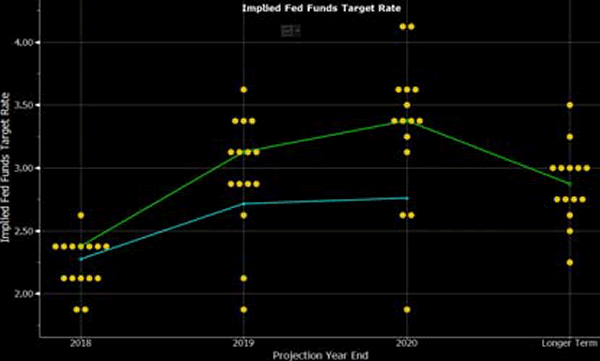
New Fed dot plot (green) and Fed Funds future curve (blue): increase of 2018 and 2019 projections
Powell showed some hesitation when asked what the Fed would do once the neutral stance was reached. The 2020 forecast suggests no strong willingness to turn very restrictive (yet). He said that wide uncertainty remains around what the neutral rate and NAIRU will be and kept all options open. Incoming data on labour markets and inflation will be closely watched, as will other financial variables. Fed Chairman Powell will hold a press conference after every FOMC meeting from January 2019 onwards to enhance communication to markets.
Overall, we conclude that the Fed turned again somewhat more hawkish compared to March 2018. We are pleased to see that the median Fed funds rate forecast is now in line with our own forecasts (4 hikes this year). Bar substantial deviations from the Fed's current scenario, we think that the dots won't materially change again in 2018. Only the neutral rate forecast is probably subject to potential changes, eg when soon to be confirmed Washington‐based Fed governors Clarida and Bowman join the FOMC.
All in all muted market reaction
The hawkish changes to the dot plot and statement initially triggered the traditional reactions. US yields increased, bear flattening the curve. The US 10‐yr yield tested the psychological 3% mark, but failed to sustain above. The dollar gained ground, but soon returned to pre‐ FOMC levels. EUR/USD closed around 1.1785. Today's ECB meeting probably explains some of the cautiousness, with the central bank expected to take the next step in its early normalization process. US stock markets lost 0.1% to 0.4%.
AUD/USD Daily Outlook
Daily Pivots: (S1) 0.7537; (P) 0.7573; (R1) 0.7616; More...
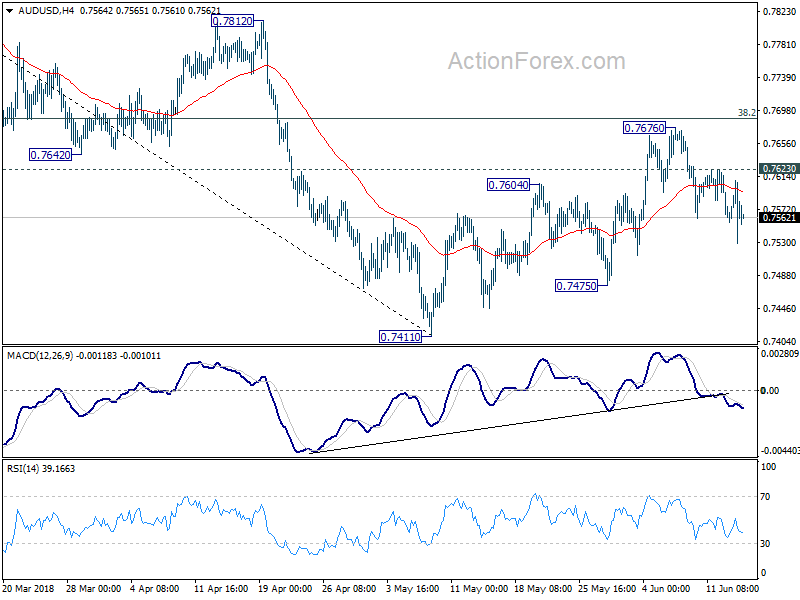
Intraday bias in AUD/USD remains on the downside at this point. As noted before, corrective rise from 0.7411 should have completed just ahead of 38.2% retracement of 0.8135 to 0.7144 at 0.7688. Deeper fall should be seen to 0.7475 support first. Break there should resume larger fall from 0.8135 and target 0.7328 cluster support (61.8% retracement of 0.6826 to 0.8135 at 0.7326). Though, above 0.7623 minor resistance will delay the bearish case and extend the correction from 0.7411 instead.
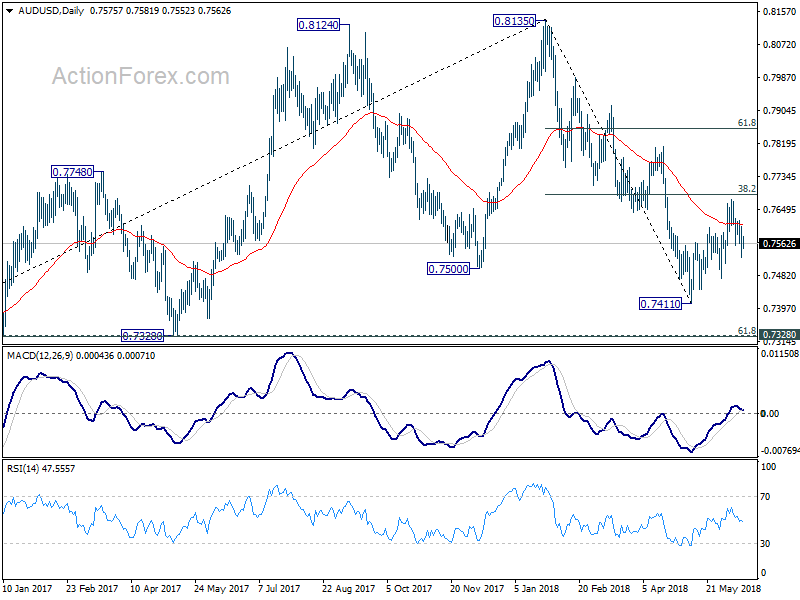
In the bigger picture, medium term rebound from 0.6826 is seen as a corrective move. Prior break of 0.7500 key support suggests that such correction is completed at 0.8135. Deeper decline would be seen back to retest 0.6826 low. In case of another rise, we'd expect strong resistance from 38.2% retracement of 1.1079 to 0.6826 at 0.8451 to limit upside to bring long term down trend resumption eventually.
USD/CAD Daily Outlook
Daily Pivots: (S1) 1.2941; (P) 1.2996; (R1) 1.3040; More.....
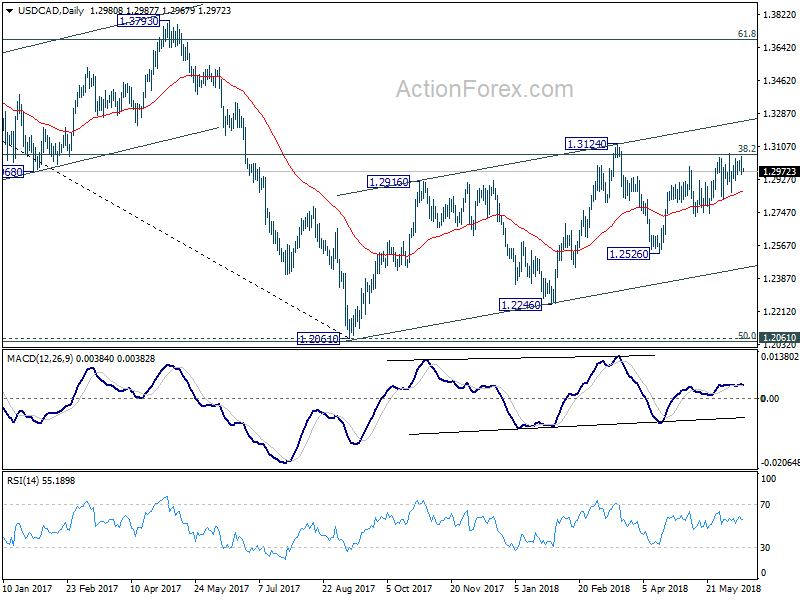
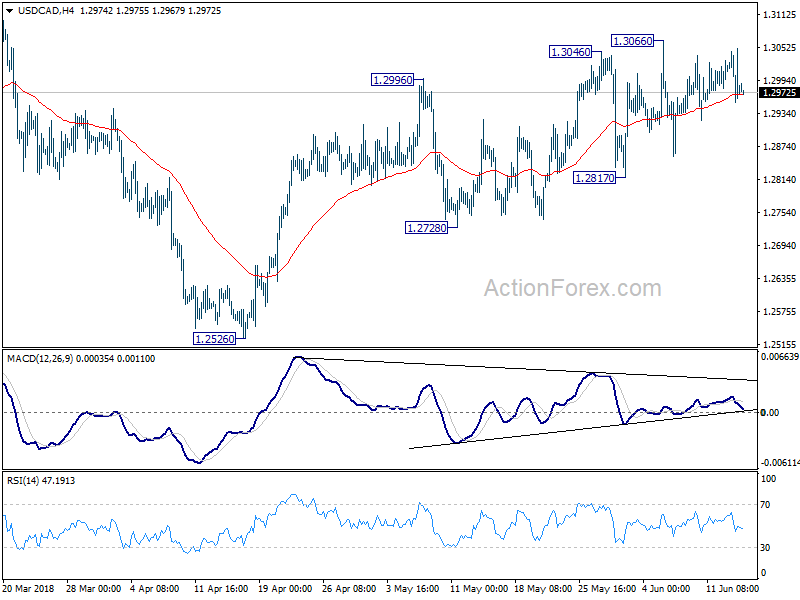
USD/CAD continues to stay in range of 1.2817/3066 and intraday bias remains neutral. Further rise is still expected with 1.2817 support intact. Break of 1.3066 will resume the rally from 1.2526 and target 1.3124 key resistance next. However, break of 1.2817 will indicate near term reversal and turn bias to the downside for 1.2728 support and below.
In the bigger picture, we're favoring the case that that rebound from 1.2061 has not completed yet. But there is no follow through upside momentum so far. Focus remains on 38.2% retracement of 1.4689 to 1.2061 at 1.3065. Sustained trading above there will confirm medium term bullish reversal. That is, down trend from 1.4689 has completed at 1.2061 already. In that case, next target will be 61.8% retracement at 1.3685. However, break of 1.2526 support will dampen this bullish view again. And, focus will be back on 1.2061 key support level, which is close to 50% retracement of 0.9406 (2011 low) to 1.4689 (2015 high) at 1.2048.