Sample Category Title
Sterling jumps on stellar May retail sales
Sterling surges after much stronger than expected retail sales data in May.
Retail sales include fuel rose 1.3% mom versus expectation of 0.5% mom and prior 1.8% mom.
Retail sales include fuel rose 3.9% yoy versus expectation of 2.4% yoy and prior 1.4% yoy.
Retail sales ex-fuel rose 1.3% mom versus expectation of 0.3% mom and prior 1.4% mom
Retail sales ex-fuel rose 4.4% yoy versus expectation of 2.5% yoy and prior 1.4% yoy.
Here are the main points from the release:
- In May 2018, the quantity bought in the retail industry increased by 1.3% when compared with April 2018 with growth across all main sectors.
- Feedback from retailers suggested that a sustained period of good weather and Royal Wedding celebrations encouraged spending in food and household goods stores in May.
- The quantity bought saw a sharp increase to year-on-year growth in May at 3.9% when compared with April at 1.4%; possibly due to a combination of warm weather and slow year-on-year growth in May 2017 at 0.8%.
- Non-store retailing showed strong growth in the quantity bought when compared with the previous year at 16.2%, the previous month at 4.5% and in the three months to May at 4.9%.
- Online spending for food, department and clothing stores continued to increase, achieving new record proportions of online retailing in May at 5.8%, 17.4% and 17.6% respectively.
- The proportion of online spending in clothing stores has grown at a much faster rate in the last 14 months, from 14.7% in March 2017 to 17.6% in May 2018.
Full release here.
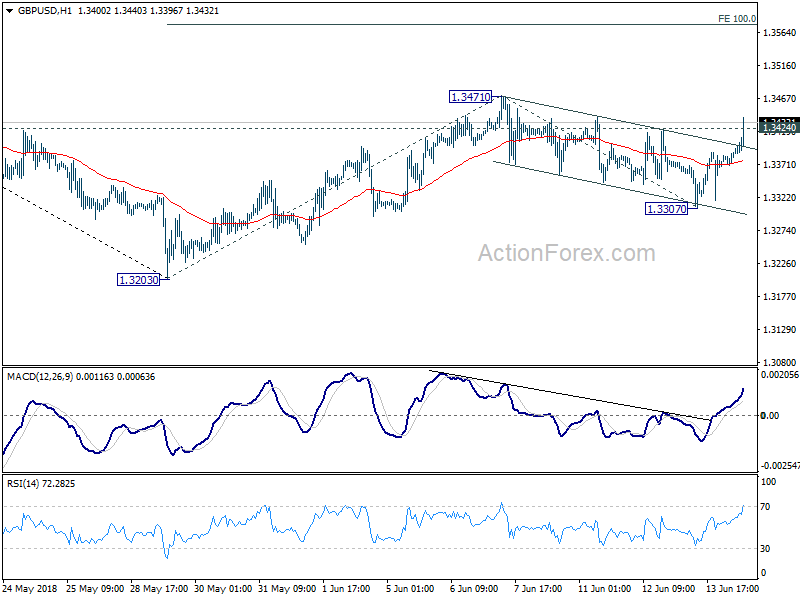
GBP/USD's break of 1.3424 minor resistance now suggests that rebound from 1.3203 is going to resume through 1.3471. It could target 100% projection of 1.3203 to 1.3471 from 1.3307 at 1.3575.
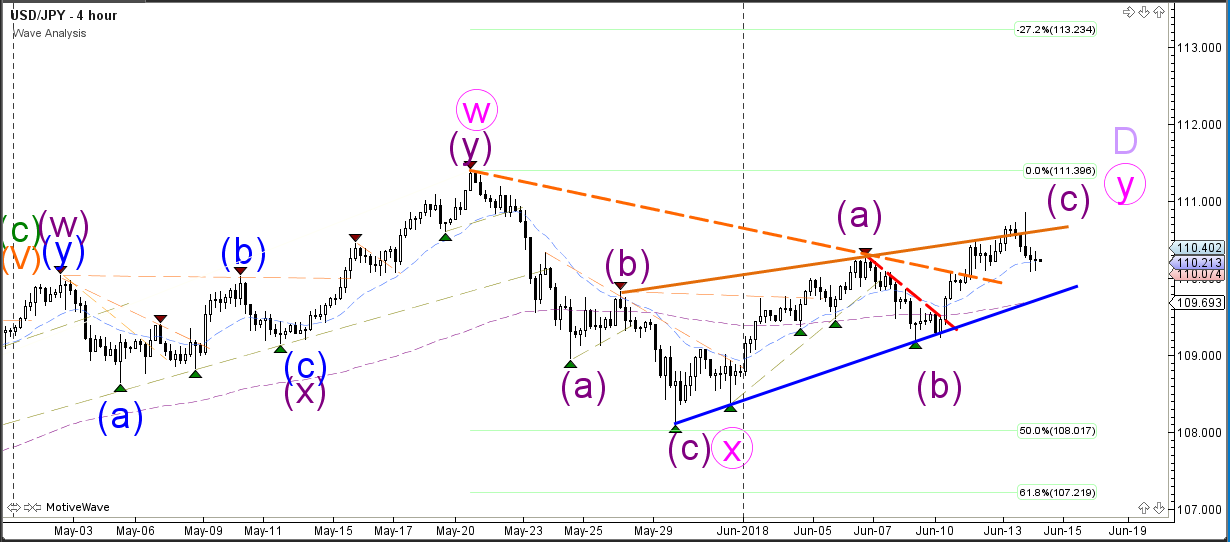
USD/JPY Uptrend Tests Fibonacci Levels Of Wave 4
The USD/JPY bullish breakout is building a bearish pullback, which seems to be a larger ABC (purple) zigzag pattern. An uptrend continuation is likely if price is able to break above the previous top. In that case one of the targets could be the -27.2% Fibonacci level at 113.25.
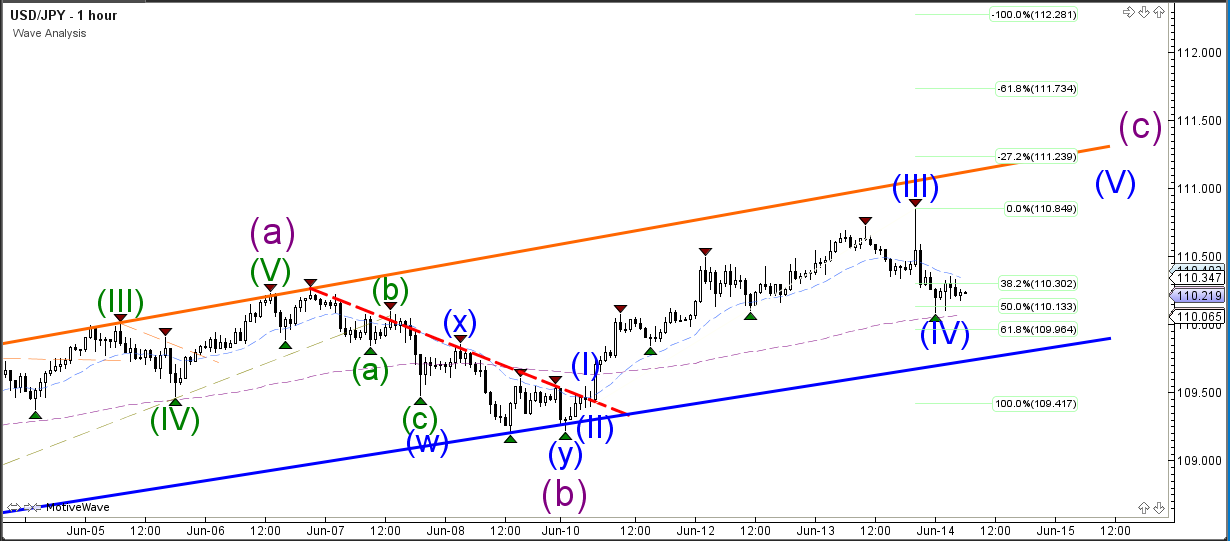
The USD/JPY has made a bearish retracement back to the potential Fibonacci retracement levels of wave 4 (blue). A bullish bounce at these Fib levels could confirm the end of a wave 4 pattern and the start of a wave 5 whereas a bearish break below the 61.8% Fib and channel would make such a bull continuation unlikely.
WTI Is Trapped In A Range – Breakout Is Possible
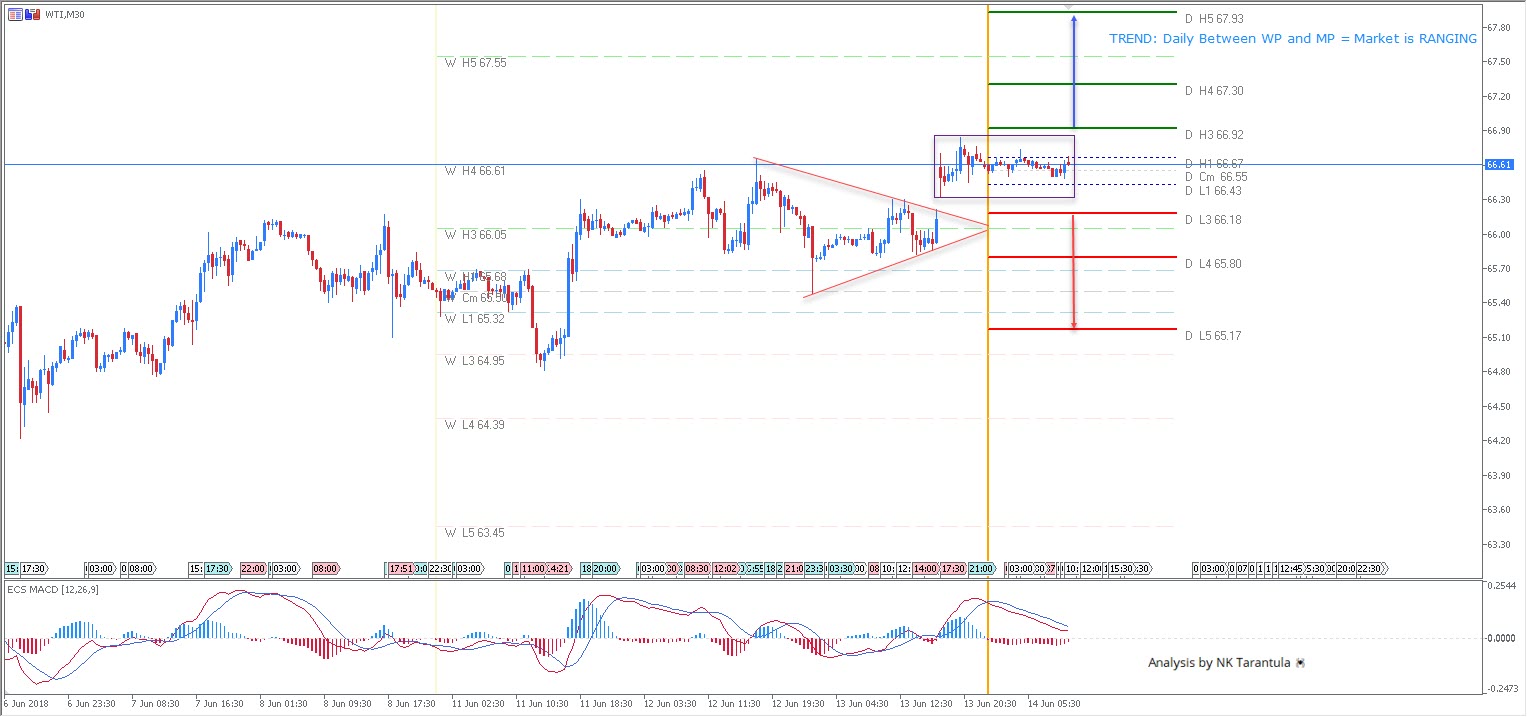
After the breakout of the symmetrical triangle to the upside, the WTI has been consolidating in a tight range between pivot points, mainly D H3 and D L3. If the price closes above D H3 – 66.92 then 67.30 and 67.55 should be next, eventually followed by 67.93. Below D L3 66.18 we might see 65.80 followed by 65.17. Watch for volatility during the US session, later in the day.
W L3 - Weekly Camarilla Pivot (Weekly Interim Support)
W H3 - Weekly Camarilla Pivot (Weekly Interim Resistance)
W H4 - Weekly Camarilla Pivot (Strong Weekly Resistance)
D H4 - Daily Camarilla Pivot (Very Strong Daily Resistance)
D L3 – Daily Camarilla Pivot (Daily Support)
D L4 – Daily H4 Camarilla (Very Strong Daily Support)
POC - Point Of Confluence (The zone where we expect price to react aka entry zone)
USDJPY Outlook: Completion Of Reversal Pattern Risks Deeper Pullback
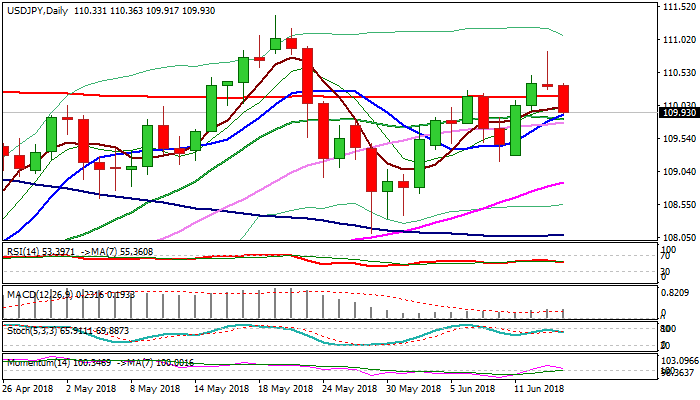
The pair holds firmly in red in early European trading on Friday and probes below psychological 110 support.
The dollar bulls are losing traction after spike to 110.85 was all seen from hawkish Fed on Wednesday, as the greenback fell sharply after hitting three-week high at 110.85.
Strong upside rejection on Wednesday, marked by daily candle with long upper shadow, formed bull-trap pattern, with further easing on Thursday completing reversal pattern on daily chart.
Loss of key 200SMA support and extension through a cluster of supports between 110.02 and 109.82 (provided by 5, 10, 20, 30SMA’s) 30SMA support being reinforced by Fibo 38.2% of 108.11/110.85 rally, would generate next strong bearish signal and risk deeper pullback.
South-heading 14-d momentum and RSI support scenario.
Res: 110.17, 110.36, 110.49, 110.85
Sup: 109.82, 109.47, 109.15, 109.04
FOMC Meeting Results In A Weaker US Dollar Against The Majors
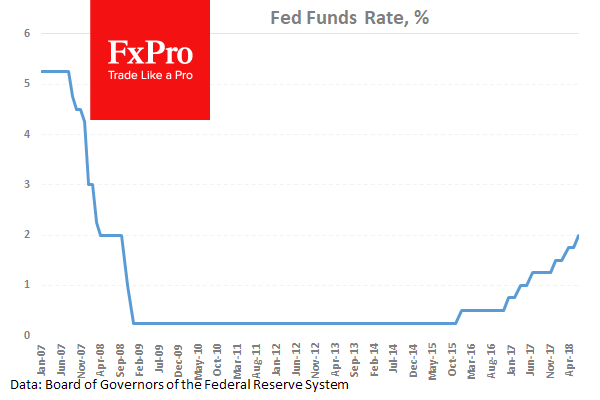
The FOMC raised rates by 0.25 bps yesterday evening to a 1.75% to 2.00% target range in a hawkish move and reaffirmed its expected forecast of 2 more hikes in 2018 and 3 in 2019. The move had been fully anticipated by markets and so did not come as a big surprise. The committee cited a solid growth outlook and greater confidence that inflation is converging on target as supporting their decision. The End of year GDP forecast was raised to 2.8% from 2.7% and the FED is strongly committed to the 2% inflation target. The USD reacted by strengthening against other currencies but this moved was faded with the USD now weaker against EUR, GBP and JPY than when the rate decision was announced. US stocks initially moved higher but again the move was faded and they closed in the red.
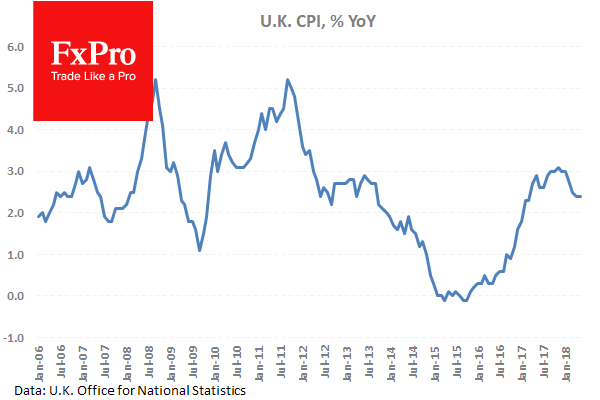
UK Consumer Price Index (May) was 0.4% (MoM) and 2.4% (YoY) against an expected 0.4% (MoM) and 2.5% (YoY) from 0.4% (MoM) and 2.4% (YoY) previously. Core Consumer Price Index (YoY) (May) was 2.1% against an expected 2.1% from 2.1% prior. Producer Price Index – Input (May) was 2.8% (MoM) and 9.2% (YoY) against an expected 1.6% (MoM) and 7.6% (YoY) from 0.6% (MoM) and 5.6% (YoY) previously. Retail Price Index (May) was 0.4% (MoM) and 3.3% (YoY) against an expected 0.4% (MoM) and 3.4% (YoY) from 0.5% (MoM) and 3.4% (YoY) previously.
These data points showed CPI holding steady, with the yearly number above the Bank of England’s 2% target since March of 2017 due to the change in the value of the pound after Brexit. Producer Prices have continued to increase with big beats against the expected numbers. GBPUSD moved lower from 1.33349 to 1.33110 after this data was released.
Eurozone Industrial Production (Apr) was released at -0.9% (MoM) and 1.7% (YoY) against the consensus for -0.5% (MoM) and 2.8% (YoY) from a prior of 0.5% (MoM) and 3.0% (YoY). This data extended its decline with the monthly figure slipping back under zero after rising last month. 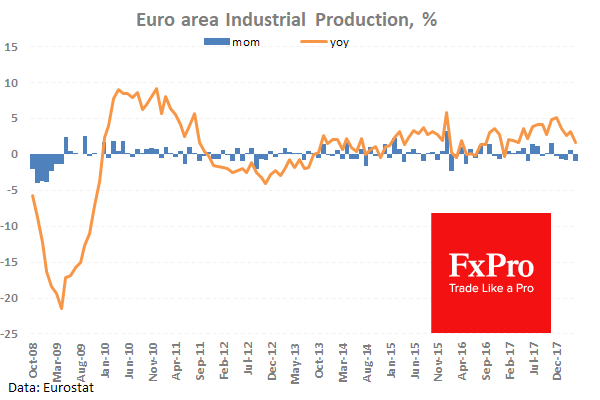
US Producer Price Index ex Food and Energy (YoY) (May) was 2.4% against an expected 2.3% from a previous reading of 2.3%. This data beat the expected number by 0.1% this month. EURUSD moved higher from 1.17584 to 1.17816 after this data release. 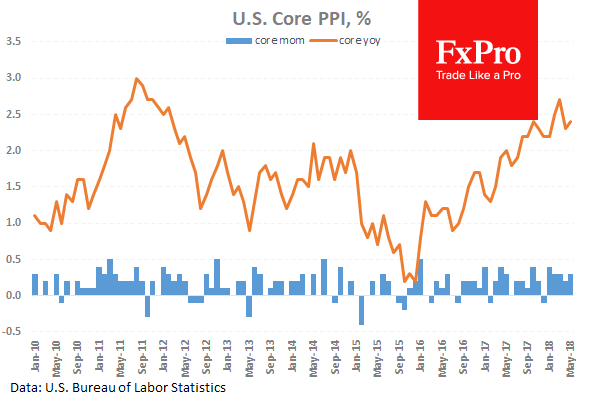
EURUSD is up 0.09% overnight, trading around 1.18020.
USDJPY is down -0.23% in the early session, trading at around 110.080
GBPUSD is up 0.11% this morning trading around 1.33896
Gold is flat in early morning trading at around $1,299.30
WTI is down -0.14% this morning, trading around $66.44
ECB Expected To Leave Rates unchanged but change monetary policy
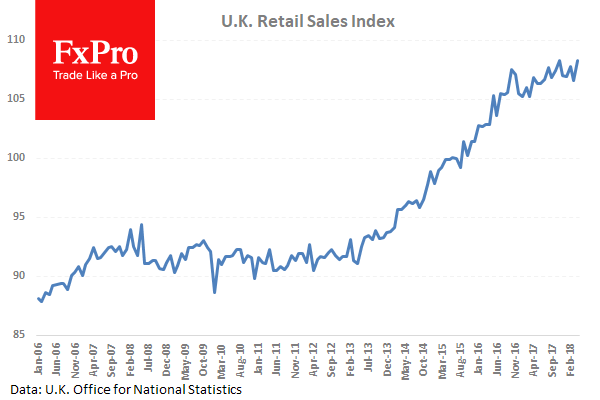
At 08:30 GMT, UK Retail Sales (May) is expected to be 0.5% (MoM) and 2.4% (YoY) from 1.6% (MoM) and 1.4% (YoY) previously. Retail Sales ex-Fuel (May) is expected to be 0.3% (MoM) and 2.5% (YoY) from 1.3% (MoM) and 1.5% (YoY) previously. Yearly figures are expected to show a decrease but monthly numbers are expected to exceed expectations and show a jump in sales. This is a volatile data set but it does give a view on consumer spending. GBP crosses can experience an increase in volatility following this data release.
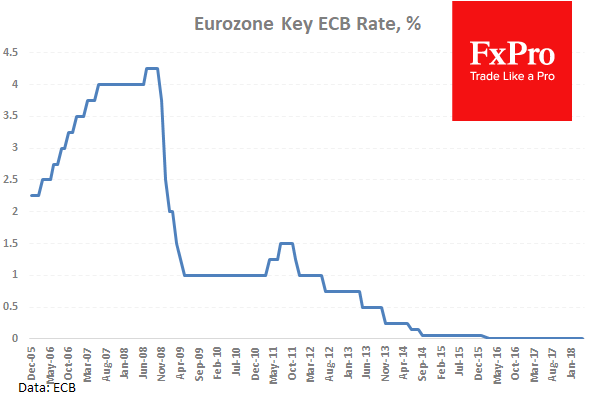
At 11:45 GMT, Eurozone ECB Deposit Rate Decision will be announced today with an expectation of -0.4% compared with a previous -0.4%. The ECB Interest Rate Decision will be released at this time also with an expectation for rates to be left unchanged at 0%. This data could see volatility increase in EUR markets on the approach to the ECB Press Conference and Monetary Policy Statement at 12:30. Comments from ECB President Mario Draghi will be assessed for hints on future monetary policy with hawkish comments adding strength to the Euro. Traders will be waiting for any change in guidance concerning asset purchases or interest rate normalisation.
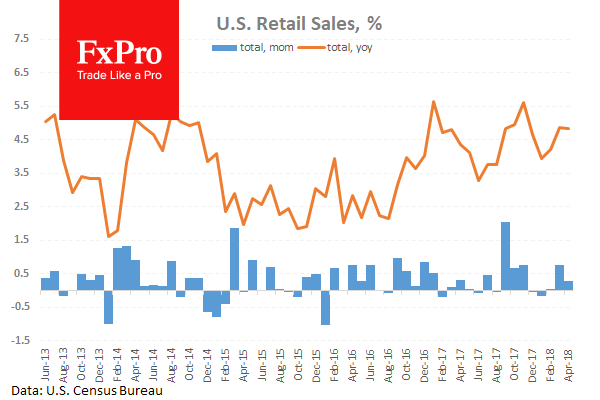
At 12:30 GMT, US Retail Sales (MoM) (May) will be released with an expected 0.4% from 0.2% previously which has been revised down from 0.3%. Retail Sales ex Autos (MoM) (May) is expected at 0.5% from 0.3% prior. Retail Sales Control Group (May) is expected to be 0.4% from 0.5% prior which has been revised up from 0.4%. It is expected that sales will increase marginally this month.
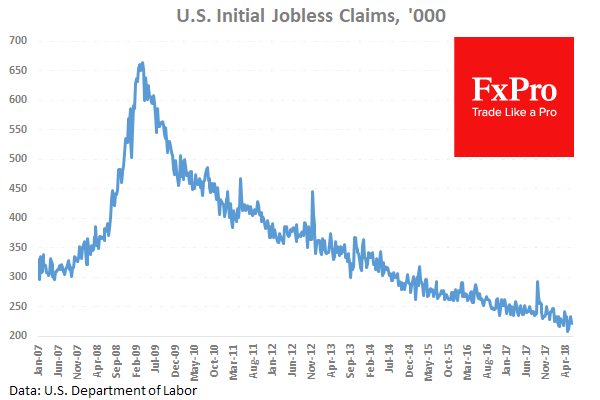
US Continuing Jobless Claims (June 1) is expected to be 1.737M against 1.741M previously. Initial Jobless Claims (June 8) is expected to come in at 224K against 222K previously. This data is showing a small decline in the number of continuing claims but new claims have stabilized somewhat. USD crosses can see an increase in volatility from these data releases.
EURUSD Outlook: Rises Above 1.18 As Impact On Hawkish Fed Fades, ECB In Focus
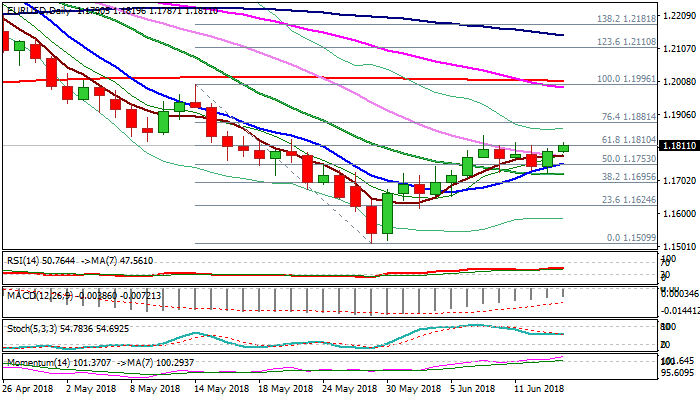
The Euro probes above 1.18 barrier in early European trading on Thursday, as dollar's initial strength after Fed's decision late Wednesday, started to fade. Hawkish tone from the Fed, which signaled two more rate hikes in 2018 initially boosted the dollar and pushed the single currency to one-week low at 1.1724 on Thursday, but Euro's weakness proved to be short-lived. Subsequent bounce managed to eventually close above falling 30SMA and generated initial bullish signal. Bulls broke next pivot at 1.1810 (Fibo 61.8% of 1.1996/1.1509), with close above it needed to confirm bullish continuation. Momentum remains in steep ascend and supports the advance, along with formation of 5/30SMA bull-cross, with rising weekly cloud continuing to underpin. Focus is turning towards ECB's policy decision, due later today, as markets expect the central bank to give more details about the timing of winding down its QE program. Bullish scenario requires sustained break above 1.1810 and former high of 07 June at 1.1839 to expose Fibo barrier at 1.1881 (76.4% of 1.1996/1.1509), break of which would unmask psychological 1.20 barrier, reinforced by 200SMA. Solid supports at 1.1780/70 zone (broken 30SMA / top of thick4-hr cloud) are expected to hold and maintain bullish bias.
Res: 1.1820, 1.1839, 1.1850, 1.1996
Sup: 1.1780, 1.1755, 1.1724, 1.1674
EUR/USD Challenges Resistance Line Of Downtrend Channel
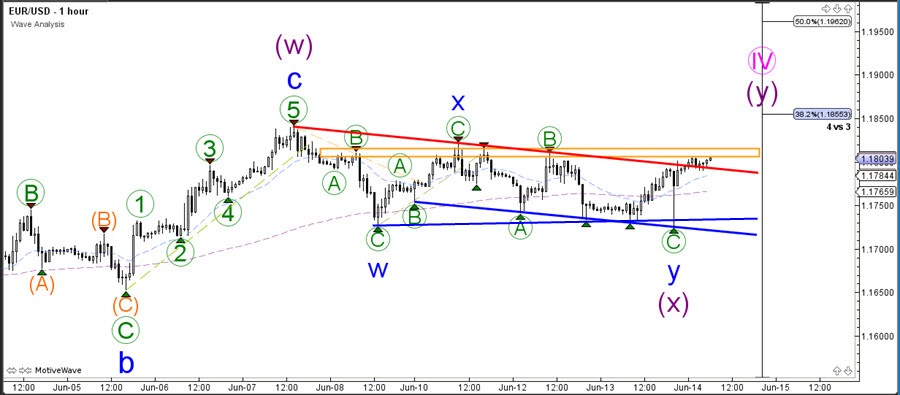
The EUR/USD is unable to break the support zone and is moving sideways, which is increasing the chance of a larger bullish move. A break above the resistance trend line could trigger a bullish breakout.
A bullish break could be part of a wave Y (purple) of a larger wave 4 (pink). The alternative is that the wave 3 (pink) is in fact a wave C and that price is building a larger bullish ABC zigzag.
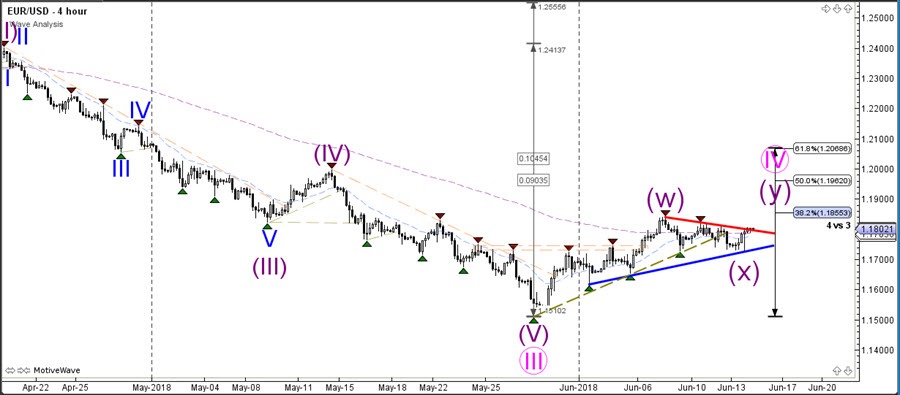
EUR/USD seems to be building a bull flag chart pattern. A bullish break above the resistance could see price move up towards the 50% Fibonacci level whereas a bearish breakout below support could see price test the previous bottom.
Choppy GBP/USD Creates Bull Flag Chart Pattern
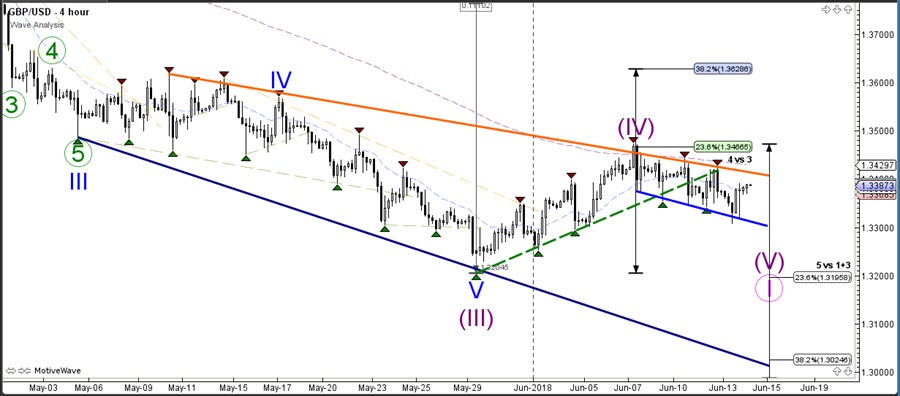
The GBP/USD broke the support trend line but price action remains choppy and indecisive and price could build a bigger bullish correction towards the next 38.2% Fibonacci retracement level.
The GBP/USD bullish break above the resistance trend line (orange) could see price move towards the 38.2% Fib at 136.25. A bearish breakout is needed before price could challenge the previous bottom
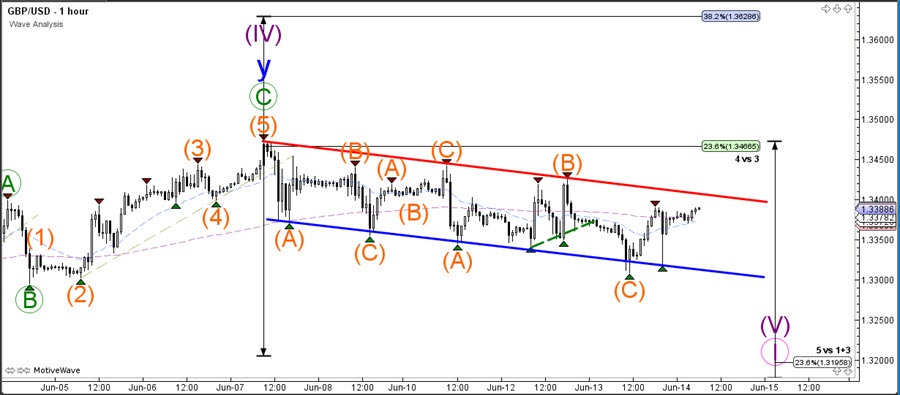
The GBP/USD seems to be building multiple ABC patterns, which is making an expanded (bullish) correction more likely than a downtrend continuation.
XAUUSD Intraday Analysis
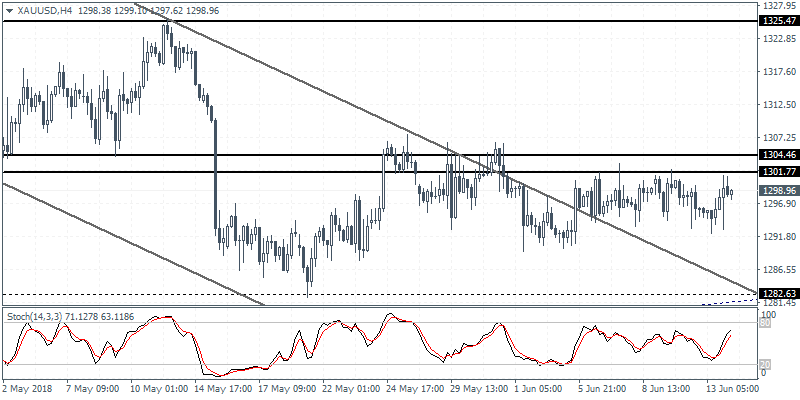
XAUUSD (1298.96): Gold prices remained flat on the day despite the short term volatility and the weaker U.S. dollar. Price action remains stuck below the resistance level of 1304 - 1301 level and today's ECB meeting could likely be the catalyst for a breakout from this range. The downside target at 1282 remains intact, which could be tested in the event of a decline in gold prices. To the upside, gold prices are expected to test the 1325 level provided the resistance level is breached.